Performance Dashboard
|
|
|
- Timothy Carson
- 5 years ago
- Views:
Transcription


1 Unified Corridor Investment Study Performance Dashboard Step 2 Analysis Results DRAFT Revised 10/15/18 October 2018

2 Project Description Three parallel routes - Highway 1, Soquel/Freedom and the Santa Cruz Branch Rail Line - link the communities along the Santa Cruz County coast from Davenport through Watsonville. The Unified Corridor Study examines how well complimentary transportation improvements on all three routes - when designed to function together as a single unified corridor perform to meet the community s transportation needs. The Unified Corridor Study performance dashboard presents the result of the second, in a two step analysis, which compares how each of the scenarios address the study goals of Safety, Efficiency, Economics, Environmental Sustainability, and Social Equity by The evaluation of 16 performance measures for each of the scenarios and a comparison to a no build and baseline conditions is designed to increase understanding of transportation project benefits by transparently evaluating their impacts and lead to effective investments in the corridor.
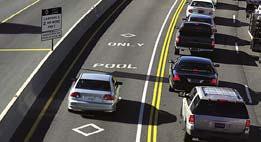
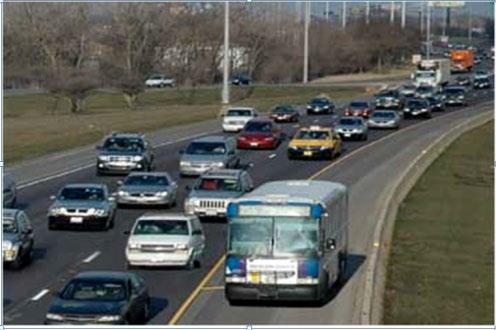
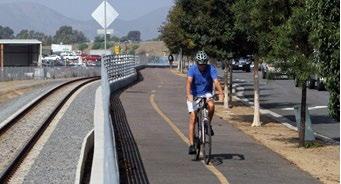
3 Step 2 Scenarios for Analysis Approved by RTC on December 7, 2017 Scenario Highway 1 Projects A Scenario B Scenario C Scenario E No Build Buses on shoulders High occupancy vehicle lanes (HOV) and increased transit frequency Auxiliary lanes to extend merging distance IN ADDITION TO MEASURE D Metering of on-ramps Additional lanes on bridge over San Lorenzo River Mission St intersection improvements Soquel Avenue/Drive and Freedom Blvd BRT lite (faster boarding, transit signal priority and queue jumps) Increased frequency of transit with express services Buffered/protected bike lanes Intersection improvements for auto Intersection improvements for bikes/pedestrians Rail Corridor Bike and pedestrian trail Local rail transit with interregional connections Bus rapid transit Freight service on rail Overall Project Area/Connections between Routes Improved bike/pedestrian facilities throughout urban area closing gaps in network Additional transit connections Bike share, bike amenities, transit amenities, park and ride lots Multimodal transportation hubs Automated vehicles/connected vehicles Transportation Demand and System Management Employers and residences - incentive programs Education and enforcement - electric vehicle, motorist safety, and bike safety Only Watsonville These projects will be evaluated in all scenarios. These projects will be evaluated in all scenarios.
4 This page left intentionally blank.
5 Scenario A Step 2 Performance Measures PM: Total Collisions (Fatal, Injury, and Property Damage Only per year) Scenario A, 979 Revised 10/15/18, 1211 Baseline, 1110 Highway 1 Projects HOV and auxiliary lanes, ramp meters, San Lorenzo bridge widening, multimodal intersection improvements Soquel / Freedom BRT Lite with increased transit frequency, multimodal intersection improvements Rail ROW Bike and pedestrian trail Goal 1 Safer transportation for all modes. PM: Countywide Mean Auto Speed (mph) Scenario A Scenario A Walk 10.9% Bike 4.3% Transit 4.1% Drive Alone 42.8% AM Peak Period 6:00-9:00 AM Baseline PM Peak Period 4:00-7:00 PM PM: Mode Share Goal 2 Reliable and efficient transportation choices that serve the most people and facilitate the transport of goods. Carpool 37.8%

6 PM: Person trips across N-S Screenline 4:00-6:00 PM (In thousands) Scenario A Baseline Seabright Avenue 41st Ave San Andreas/Freedom Goal 3 Develop a well-integrated transportation system that supports economic vitality. PM: Level Of Public Investment (In millions) Annual Cost for O&M $25 Revised 10/12/18 $9 $16 New Public Investment Needed Funding Potential $520 $379 Capital Costs $899 PM: Visitor Tax Revenues (per year in millions) Scenario A Scenario A Total Transient Occupancy Tax Visitor Related Sales Tax $40.1 $39.0 $28.6 $28.0 $27.2 $18.3 $10.3 $12.0 $11.8 Baseline Scenario A
7 PM: Cost Associated with Collisions (per year) Revised 10/15/18 Cost per $224 K Collision x 1,211 Collisions = $271 M Collision Cost Cost per $224 K Collision x Scenario A 979 Collisions = Scenario A $219 M Collision Cost Cost -$52 M Savings PM: Automobile Vehicle Miles Traveled (Countywide VMT per day in millions) Scenario A Baseline Goal 4 Minimize environmental concerns and reduce adverse health impacts. PM: Total Criteria Pollutants (metric tons per day) Baseline Scenario A CO SOX PM10 PM2.5 ROG NOX
 36.5 2 nd lowest score Goal 5 Accessible and equitable transportation system that is responsive to the needs of all users.")
8 PM: Greenhouse Gas Emissions CO 2 e Emissions (metric tons per day) and Percentage Reduction from 2015 Baseline CO 2 e 2,617-27% -26% 1,915 1,941 Baseline Scenario A PM: Environmentally Sensitive Areas (# linear miles along 3 routes) nd lowest score Goal 5 Accessible and equitable transportation system that is responsive to the needs of all users. PM: Transit Vehicle Miles Traveled (per year in millions) Scenario A Baseline
9 PM: Household Transportation Cost Percentage of Income Spent on Transportation (by median income households per year) 18% Baseline 16% 26% Baseline 24% 17% 25% Daily Costs for 2-Vehicle Households Scenario A $ Baseline $46.63 $ $50.14 $ Vehicle Household 2 Vehicle Household PM: Share of Investment Benefit for Transportation Disadvantaged Population 24.0% 14% of population is transportation disadvantaged Scenario A
10 This page left intentionally blank.

11 Scenario B Step 2 Performance Measures PM: Total Collisions (Fatal, Injury, and Property Damage Only per year) Scenario B, 865 Revised 10/15/18, 1211 Baseline, 1110 Highway 1 Projects Bus on shoulder, ramp metering, Mission St. intersection improvements Soquel / Freedom BRT Lite with increased transit frequency, buffered/protected bike lanes, bike/ped intersection improvements Rail ROW Bike and pedestrian trail, rail transit Goal 1 Safer transportation for all modes. PM: Countywide Mean Auto Speed (mph) Scenario B Scenario B Bike 4.4% Walk 10.7% Drive Alone 42.4% AM Peak Period 6:00-9:00 AM Baseline PM Peak Period 4:00-7:00 PM Transit 6.0% Carpool 36.5% PM: Mode Share Goal 2 Reliable and efficient transportation choices that serve the most people and facilitate the transport of goods.
 Revised 10/12/18 Goal 3 Develop a well-integrated transportation system that supports economic vitality.")
12 PM: Person trips across N-S Screenline 4:00-6:00 PM (In thousands) Scenario B Baseline Seabright Avenue 41st Ave San Andreas/Freedom PM: Level Of Public Investment (In millions) Revised 10/12/18 Goal 3 Develop a well-integrated transportation system that supports economic vitality. Annual Cost for O&M $47 $16 $31 New Public Investment Needed Funding Potential $379 $455 Capital Costs $833 PM: Visitor Tax Revenues (per year in millions) Scenario B Scenario B Total Transient Occupancy Tax Visitor Related Sales Tax $40.2 $39.0 $28.6 $28.1 $27.2 $18.3 $10.3 $12.1 $11.8 Baseline Scenario B

13 PM: Cost Associated with Collisions (per year) Revised 10/15/18 Cost per $224 K Collision x 1,211 Collisions = $271 M Collision Cost Cost per $224 K Collision x Scenario B 865 Collisions = Scenario B $192 M Collision Cost Cost -$78 M Savings Goal 4 Minimize environmental concerns and reduce adverse health impacts. PM: Automobile Vehicle Miles Traveled (Countywide VMT per day in millions) Scenario B Baseline PM: Total Criteria Pollutants (metric tons per day) Baseline Scenario B CO SOX PM10 PM2.5 ROG NOX
 38.3 2 nd highest score Goal 5 Accessible and equitable transportation system that is responsive to the needs of all users.")
14 PM: Greenhouse Gas Emissions CO 2 e Emissions (metric tons per day) and Percentage Reduction from 2015 Baseline CO 2 e 2,617-27% -28% 1,915 1,886 Baseline Scenario B PM: Environmentally Sensitive Areas (# linear miles along 3 routes) nd highest score Goal 5 Accessible and equitable transportation system that is responsive to the needs of all users. PM: Transit Vehicle Miles Traveled (per year in millions) Scenario B Baseline
15 PM: Household Transportation Cost Percentage of Income Spent on Transportation (by median income households per year) 18% Baseline 16% 26% Baseline 24% 17% 25% Daily Costs for 2-Vehicle Households Scenario B $ Baseline $46.63 $ $50.14 $ Vehicle Household 2 Vehicle Household PM: Share of Investment Benefit for Transportation Disadvantaged Population 25.2% 14% of population is transportation disadvantaged Scenario B
16 This page left intentionally blank.

17 Scenario C Step 2 Performance Measures PM: Total Collisions (Fatal, Injury, and Property Damage Only per year) Scenario C, 970 Revised 10/15/18, 1211 Baseline, 1110 Highway 1 Projects Bus on shoulders, auxiliary lanes Soquel / Freedom BRT Lite with increased transit frequency, multimodal intersection improvements Rail ROW Bike and pedestrian trail, bus rapid transit, freight service (in Watsonville) Goal 1 Safer transportation for all modes. PM: Countywide Mean Auto Speed (mph) Scenario C Scenario C Bike 4.2% Walk 10.8% Drive Alone 43.1% AM Peak Period 6:00-9:00 AM Baseline PM Peak Period 4:00-7:00 PM Transit 4.8% Carpool 37.1% PM: Mode Share Goal 2 Reliable and efficient transportation choices that serve the most people and facilitate the transport of goods.
 Revised 10/12/18 Goal 3 Develop a well-integrated $11 transportation Annual system that Cost for O&M supports economic $30 vitality.")
18 PM: Person trips across N-S Screenline 4:00-6:00 PM (In thousands) Scenario C Baseline Seabright Avenue 41st Ave San Andreas/Freedom PM: Level Of Public Investment (In millions) Revised 10/12/18 Goal 3 Develop a well-integrated $11 transportation Annual system that Cost for O&M supports economic $30 vitality. $19 New Public Investment Needed Funding Potential $285 $455 Capital Costs $740 PM: Visitor Tax Revenues (per year in millions) Total Transient Occupancy Tax Visitor Related Sales Tax $39.7 $39.0 Scenario C Scenario C $28.6 $27.8 $27.2 $18.3 $10.3 $11.9 $11.8 Baseline Scenario C

19 PM: Cost Associated with Collisions (per year) Revised 10/15/18 Cost per $224 K Collision x 1,211 Collisions = $271 M Collision Cost Cost per $224 K Collision x Scenario C 970 Collisions = Scenario C $217 M Collision Cost Cost -$54 M Savings Goal 4 Minimize environmental concerns and reduce adverse health impacts. PM: Automobile Vehicle Miles Traveled (Countywide VMT per day in millions) Scenario C Baseline PM: Total Criteria Pollutants (metric tons per day) Baseline Scenario C CO SOX PM10 PM2.5 ROG NOX
 36.0 Lowest score Goal 5 Accessible and equitable transportation system that is responsive to the needs of all users.")
20 PM: Greenhouse Gas Emissions CO 2 e Emissions (metric tons per day) and Percentage Reduction from 2015 Baseline CO 2 e 2,617-27% -27% 1,915 1,899 Baseline Scenario C PM: Environmentally Sensitive Areas (# linear miles along 3 routes) 36.0 Lowest score Goal 5 Accessible and equitable transportation system that is responsive to the needs of all users. PM: Transit Vehicle Miles Traveled (per year in millions) Scenario C Baseline
21 PM: Household Transportation Cost Percentage of Income Spent on Transportation (by median income households per year) 18% Baseline 16% 26% Baseline 24% 17% 25% Daily Costs for 2-Vehicle Households Scenario C $ Baseline $46.63 $ $50.14 $ Vehicle Household 2 Vehicle Household PM: Share of Investment Benefit for Transportation Disadvantaged Population 25.2% 14% of population is transportation disadvantaged Scenario C
22 This page left intentionally blank.

23 Scenario E Step 2 Performance Measures PM: Total Collisions (Fatal, Injury, and Property Damage Only per year) Scenario E, 968 Revised 10/15/18, 1211 Highway 1 Projects HOV and auxiliary lanes, ramp meters Soquel / Freedom Buffered/protected bike lanes, bike/pedestrian intersection improvements Rail ROW Bike and pedestrian trail, rail transit, freight service Baseline, 1110 Goal 1 Safer transportation for all modes. PM: Countywide Mean Auto Speed (mph) AM Peak Period 6:00-9:00 AM PM Peak Period 4:00-7:00 PM Transit 5.3% Bike 4.4% Carpool 37.3% Walk 10.7% PM: Mode Share Drive Alone 42.3% Baseline Goal 2 Reliable and efficient transportation choices that serve the most people and facilitate the transport of goods.

24 PM: Person trips across N-S Screenline 4:00-6:00 PM (In thousands) Scenario E Baseline Seabright Avenue 41st Ave San Andreas/Freedom Goal 3 Develop a well-integrated $6 transportation system that Annual Cost for supports economic O&M vitality. $39 $33 PM: Level Of Public Investment (In thousands) Revised 10/12/18 New Public Investment Needed Funding Potential $794 $453 Capital Costs $1,247 Scenario E Scenario E PM: Visitor Tax Revenues (per year in millions) Total Transient Occupancy Tax Visitor Related Sales Tax $40.1 $39.0 $28.6 $28.1 $27.2 $18.3 $10.3 $12.0 $11.8 Baseline Scenario E

25 PM: Cost Associated with Collisions (per year) Revised 10/15/18 Cost per $224 K Collision x 1,211 Collisions = $271 M Collision Cost Cost per $224 K Collision x Scenario E 968 Collisions = Scenario E $217 M Collision Cost Cost -$54 M Savings Goal 4 Minimize environmental concerns and reduce adverse health impacts. PM: Automobile Vehicle Miles Traveled (Countywide VMT per day in millions) Scenario E Baseline PM: Total Criteria Pollutants (metric tons per day) Baseline Scenario E CO SOX PM10 PM2.5 ROG NOX
 40.7 Highest score Goal 5 Accessible and equitable transportation system that is responsive to the needs of all users.")
26 PM: Greenhouse Gas Emissions CO 2 e Emissions (metric tons per day) and Percentage Reduction from 2015 Baseline CO 2 e 2,617-27% -26% 1,915 1,928 Baseline Scenario E PM: Environmentally Sensitive Areas (# linear miles along 3 routes) 40.7 Highest score Goal 5 Accessible and equitable transportation system that is responsive to the needs of all users. PM: Transit Vehicle Miles Traveled (per year in millions) Scenario E Baseline
27 PM: Household Transportation Cost Percentage of Income Spent on Transportation (by median income households per year) 18% Baseline 16% 26% Baseline 24% 17% 25% Daily Costs for 2-Vehicle Households Scenario E $ Baseline $46.63 $ $50.14 $ Vehicle Household 2 Vehicle Household PM: Share of Investment Benefit for Transportation Disadvantaged Population 23.5% 14% of population is transportation disadvantaged Scenario E
28 This page left intentionally blank.
29 All Scenarios Comparison GOAL 1 Safer transportation for all modes. Total Annual Collisions Fatal, Injury, and Property Damage Only Scenario A, 1211 Scenario A, 979 Baseline, 1110 Scenario B, 1211 Scenario B, 865 Baseline, 1110 Scenario C, 1211 Scenario C, 970 Baseline, 1110 Scenario E, 1211 Scenario E, 968 Baseline, Revised 10/15/18 GOAL 2 Reliable and efficient transportation choices that serve the most people and facilitate the transport of goods Countywide Mean Auto Speed (MPH) AM Peak Period (6:00-9:00 AM) Countywide Mean Auto Speed (MPH) PM Peak Period (4:00-7:00 PM) Scenario A Scenario B Scenario C Scenario E Scenario A Scenario B Scenario C Scenario E Baseline Baseline
30 GOAL 2 Reliability and Efficiency (continued) Scenario A Mode Share Scenario B Mode Share Drive Alone 42.8% Drive Alone 42.4% Carpool 37.8% Carpool 36.5% Walk 10.9% Walk 10.7% Bike 4.3% Bike 4.4% Transit 4.1% Transit 6.0% Scenario C Mode Share Scenario E Mode Share Drive Alone 43.1% Drive Alone 42.3% Carpool 37.1% Carpool 37.3% Walk 10.8% Walk 10.7% Bike 4.2% Bike 4.4% Transit 4.8% Transit 5.3% 2015 Baseline 2035 Person Trips (4-6pm) Screenline # 4 at 41st Ave 2035 Person Trips (4-6pm) Screenline # 9 at San Andreas/Freedom Baseline 27 Baseline Scenario A Scenario B Scenario C Scenario E Scenario A Scenario B Scenario C Scenario E In thousands In thousands
31 GOAL 3 Develop a well-integrated transportation system that supports economic vitality. Level of Public Investment Capital Costs and Funding Potential Estimates (In millions) $794 New Public Investments Needed $520 $379 $285 Capital Cost $1,246 Funding Potential $899 $832 $740 $379 $455 $455 $453 Scenario A Scenario B Scenario C Scenario E Annual Cost for Operations & Maintenance (In millions) $16 $6 New Public Investment Needed $9 $25 $47 $11 $30 $39 O& M Cost Funding Potential $16 $31 $19 $33 Scenario A Scenario B Scenario C Scenario E Revised 10/12/18
32 GOAL 3 Economic Vitality (continued) Total Transient Occupancy Tax Visitor Related Sales Tax Visitor Tax Revenues (per year in millions) $40.1 $40.2 $39.7 $40.1 $39.0 $28.6 $28.0 $28.0 $27.8 $28.1 $27.2 $18.3 $10.3 $12.0 $12.1 $11.9 $12.0 $11.8 Baseline Scenario A Scenario B Scenario C Scenario E Cost Associated with Collisions (in millions/year) Scenario A $219 $52 Scenario B $193 $78 Scenario C $217 $54 Scenario E $217 $54 Collision Cost Savings $271 M Revised 10/15/18
33 GOAL 4 Minimize environmental concerns and reduce adverse health impacts Countywide Vehicle Miles Traveled Miles (per day in millions) Baseline Scenario A Scenario B Scenario C Scenario E Environmentally Sensitive Areas Scenario A (mi) 36.5 Scenario B (mi) 38.3 Scenario C (mi) 36.0 Scenario E (mi) Total Criteria Pollutants (metric tons per day) Baseline Scenario A Scenario B Scenario C Scenario E CO SOX PM10 PM2.5 ROG NOX
34 GOAL 4 Environment (continued) CO 2 e Emissions (metric tons/day) and % Reduction from 2015 Baseline 2,617-27% -26% -28% -27% -26% CO 2 e (mtpd) 1,915 1,941 1,886 1,899 1,928 Baseline Scenario A Scenario B Scenario C Scenario E GOAL 5 Accessible and equitable transportation system that is responsive to the needs of all users. Annual Transit Vehicle Miles Traveled (in millions) Scenario A 5.74 Scenario B 6.65 Scenario C 6.11 Scenario E Baseline 3.33
35 GOAL 5 Equity (continued) Household Transportation Cost (% of Median Income) 26% 18% Baseline 24% 17% Baseline 16% 25% 1 Vehicle Household 2 Vehicle Household Scenario A Scenario B Scenario C Scenario E Share of Investment Benefit for Transportation Disadvantaged Population 24.0% 25.2% 25.2% 23.5% 13.7% of population is transportation disadvantaged Scenario A Scenario B Scenario C Scenario E
Performance Dashboard
 Unified Corridor Investment Study Performance Dashboard Step 2 Analysis Results DRAFT Revised 11/08/18 October 2018 Project Description Three parallel routes - Highway 1, Soquel/Freedom and the Santa Cruz
Unified Corridor Investment Study Performance Dashboard
 Unified Corridor Investment Study Performance Dashboard October 2018 Project Description Three parallel routes - Highway 1, Soquel/Freedom and the Santa Cruz Branch Rail Line - link the communities along
Attachment B: GM Memo a
 Attachment B: GM Memo 03-175a TO: Partnership Technical Advisory Committee DATE: May 18, 2003 FR: Lisa Klein W.I.: RE: Project Performance Measures for Transportation 2030 (2005 RTP) Legislation enacted
FACT SHEETS LOS ANGELES COUNTY
 FACT SHEETS LOS ANGELES COUNTY WHAT IS THE REGIONAL TRANSPORTATION PLAN/ SUSTAINABLE COMMUNITIES STRATEGY (RTP/SCS) Every four years the Southern California Association of Governments (SCAG) prepares a
Highest Priority Performance Measures for the TPP
 Highest Priority Performance Measures for the TPP The following list of measures are the highest priority performance measures as identified by modal working groups. These groups consist of staff from
AIR QUALITY AND CLIMATE CHANGE EVALUATION GUIDANCE
 AIR QUALITY AND CLIMATE CHANGE EVALUATION GUIDANCE The following guidance provides additional details regarding the process followed by PSRC to evaluate projects for potential air quality benefits. As
Integrated Transportation Plan. TAC Meeting September 16, 2014
 Integrated Transportation Plan TAC Meeting September 16, 2014 Project Schedule Today TAC Meeting October 10 TAC Meeting (teleconference) October 29 Public Workshop December 9 JIM Presentation Plan Contents
2040 Transportation Policy Plan Conversion to Performance Based Planning Basis. 25 th Annual CTS Transportation Research Conference May 21, 2014
 2040 Transportation Policy Plan Conversion to Performance Based Planning Basis 25 th Annual CTS Transportation Research Conference May 21, 2014 1 About the plan Long-range transportation plan for the Twin
The Role of Transportation Systems Management & Operations in Supporting Livability and Sustainability
 The Role of Transportation Systems Management & Operations in Supporting Livability and Sustainability Michael Grant, ICF International February 7, 2012 NTOC Webinar Highlights of FHWA/FTA Primer Background:
Contra Costa Transportation Authority STAFF REPORT February 15, 2017 Page 2 of 3 Background MTC is expected to seek authorization from the State Legis
 Contra Costa Transportation Authority STAFF REPORT Meeting Date: February 15, 2017 Subject Summary of Issues Regional Measure 3 (RM3) Candidate Projects for Submittal to the Metropolitan Transportation
I-66 Corridor Improvements Outside the Capital Beltway in Northern Virginia, USA
 15th International Conference on Managed Lanes I-66 Corridor Improvements Outside the Capital Beltway in Northern Virginia, USA Case Study for Funding of Transit Service and Transportation Demand Management
The Policies section will also provide guidance and short range policies in order to accomplish the goals and objectives.
 4 Goals & Objectives INTRODUCTION The 2015-2040 MTP preserves and promotes the quality of life and economic prosperity of the MAB by providing a transportation system consistent with the regional goals.
This page intentionally left blank.
 EXECUTIVE SUMMARY This page intentionally left blank. SATOMORROW MULTIMODAL TRANSPORTATION PLAN EXECUTIVE SUMMARY Introduction The City of San Antonio is anticipated to experience tremendous growth resulting
Congestion Management Process 2013 Update
 OVERVIEW OF THE DALLAS-FORT WORTH CONGESTION MANAGEMENT PROCESS Traffic Congestion In The Dallas-Fort Worth Region With the Dallas-Fort Worth (DFW) urban area as its center, the North Central Texas region
Livability 2050 Regional Transportation Plan Update. Transportation Policy Board (TPB) August 23, 2018
 August 23, 2018") Livability 2050 Regional Transportation Plan Update Transportation Policy Board (TPB) August 23, 2018 1 Oct. 2017 Plan Kick-Off Sept. 2019 Plan Adoption Timeline Livability 2050 Regional Transportation
Livability 2050 Regional Transportation Plan Update Transportation Policy Board (TPB) August 23, 2018 1 Oct. 2017 Plan Kick-Off Sept. 2019 Plan Adoption Timeline Livability 2050 Regional Transportation
Contents i Contents Page 1 A New Transportation Plan Community Involvement Goals and Objectives... 11
 Contents i Contents 1 A New Transportation Plan... 1 Why develop a new plan?... 1 What area does the LRTP focus on?... 2 Why is this LRTP important?... 3 Meeting Requirements for Transportation Planning...
FACT SHEETS SAN BERNARDINO COUNTY
 FACT SHEETS SAN BERNARDINO COUNTY WHAT IS THE REGIONAL TRANSPORTATION PLAN/ SUSTAINABLE COMMUNITIES STRATEGY (RTP/SCS) Every four years the Southern California Association of Governments (SCAG) prepares
Performance Measures for Transportation Planning Part 1
 Performance Measures for Transportation Planning Part 1 Flint, MI July 12, 2011 Brian Betlyon FHWA Resource Center Overview Performance Measurement in Transportation Planning Module Outcomes Describe performance
Section 11: Transportation Strategies Toolbox
 Section 11: Transportation Strategies Toolbox A transportation strategies toolbox was developed to provide a systematic approach to identify potential strategies that address corridor transportation needs.
6.0 CONGESTION HOT SPOT PROBLEM AND IMPROVEMENT TRAVEL DEMAND MODEL ANALYSIS
 6.0 CONGESTION HOT SPOT PROBLEM AND IMPROVEMENT TRAVEL DEMAND MODEL ANALYSIS 6.1 MODEL RUN SUMMARY NOTEBOOK The Model Run Summary Notebook (under separate cover) provides documentation of the multiple
Summary of transportation-related goals and objectives from existing regional plans
 SMTC 2050 Long Range Transportation Plan Appendix A: Summary of transportation-related goals and objectives from existing regional plans SMTC 2050 Long Range Transportation Plan Summary of transportation-related
MONITORING IMPLEMENTATION AND PERFORMANCE
 12 MONITORING IMPLEMENTATION AND PERFORMANCE The FAST Act continues the legislation authorized under MAP-21, which created a data-driven, performance-based multimodal program to address the many challenges
PROJECT SUBMISSION FORM
 PROJECT SUBMISSION FORM Basic Project Information CEID 1182 1. Submitting Agency: MDOT/State Highway Administration 2. Secondary Agency: 3. Agency Project ID: 4. Project Type: Interstate Primary Secondary
Alameda Countywide Transportation Plan Update Evaluation Outcomes
 TAWG Meeting 07/14/11 Attachment 06 Handout Alameda Countywide Transportation Plan Update Evaluation Outcomes presented to Technical Advisory Working Group presented by Cambridge Systematics, Inc. July
Performance Measures Workshop, May 18, 2017
 Measuring What Matters: Above and Beyond Requirements Performance Measures Workshop, May 18, 2017 Presentation Overview Background - origin and evolution of the Regional Outcomes Framework. Regional Outcomes
What is the Transportation Policy Plan (TPP)?
?") Summary What is the Transportation Policy Plan (TPP)? The region s long range transportation plan Includes all modes of transportation: highways, transit, airports, freight, biking, pedestrians Meets the
Summary What is the Transportation Policy Plan (TPP)? The region s long range transportation plan Includes all modes of transportation: highways, transit, airports, freight, biking, pedestrians Meets the
TSM/TDM (Transit and Roadway Efficiency) Concept - Analysis and Results
 Concept - Analysis and Results") M E M O R A N D U M TSM/TDM (Transit and Roadway Efficiency) Concept - Analysis and Results TO: FROM: Task Force and Oversight Team Steve Perone/PTV America Tim Burkhardt/CH2M HILL DATE: Revised: August
M E M O R A N D U M TSM/TDM (Transit and Roadway Efficiency) Concept - Analysis and Results TO: FROM: Task Force and Oversight Team Steve Perone/PTV America Tim Burkhardt/CH2M HILL DATE: Revised: August
GUIDING PRINCIPLES MEMORANDUM
 M E T R O P O L I TAN TRA NS P O RTATI O N PLAN GUIDING PRINCIPLES MEMORANDUM El Paso Metropolitan Planning Organization INTRODUCTION The guiding principles for development of the El Paso MPO s Destino
Dear Board of County Commissioners, Mayor Flitner, and Town Councilors,
 May 27, 2015 Dear Board of County Commissioners, Mayor Flitner, and Town Councilors, Thank you for this opportunity to comment on the public review draft of the Integrated Transportation Plan (ITP). The
Strategic Plan. SFMTA Board of Directors Workshop
 Strategic Plan SFMTA Progress Strategic ReportPlan SFMTA Board of Directors Workshop January 23, 2018 Agenda Review of strategic planning and metrics development to date Overview of proposed plan elements
CITY OF JACKSONVILLE 2030 MOBILITY PLAN STUDY UPDATE GOALS, OBJECTIVES, AND PERFORMANCE MEASURES PREPARED FOR: CITY OF JACKSONVILLE
 CITY OF JACKSONVILLE 2030 MOBILITY PLAN STUDY UPDATE GOALS, OBJECTIVES, AND PERFORMANCE MEASURES 3.20.2017 PREPARED FOR: CITY OF JACKSONVILLE 55 Railroad Row White River Junction, VT 05001 802.295.4999
Appendix O Congestion Management Program REGIONAL TRANSPORTATION PLAN/SUSTAINABLE COMMUNITIES STRATEGY
 Appendix O Congestion Management Program REGIONAL TRANSPORTATION PLAN/SUSTAINABLE COMMUNITIES STRATEGY 2014 REGIONAL CONGESTION MANAGEMENT PROGRAM 2014 RTP/SCS APPENDIX O SAN JOAQUIN COUNCIL OF GOVERNMENTS
2030 Transportation Policy Plan SUMMARY PRESENTATION. Land Use Advisory Committee November 15, 2012
 2030 Transportation Policy Plan SUMMARY PRESENTATION Land Use Advisory Committee November 15, 2012 Today s Topics Transportation Policy Plan (TPP) Requirements and Background Current TPP Policies, Issues
The Level of Service Metric and. Alternatives for Multi-Modal Transportation. in Oakland
 The Level of Service Metric and Alternatives for Multi-Modal Transportation in Oakland By Jill Nevins For the City of Oakland, Public Works Agency Mills College Public Policy Program May 2012 Executive
APPENDIX A - PLANS AND POLICY REVIEW FEBRUARY 2017
 APPENDIX A - PLANS AND POLICY REVIEW FEBRUARY 2017 DENVERMOVES Transit Denver Moves: Transit APPENDIX A PLANS AND POLICY REVIEW 2035 Metro Vision Regional Transportation Plan (MVRTP) (2011) 2040 Fiscally
Transit Investment Direction and Plan Introduction. Transportation Advisory Board TPP Workshop August 16, 2017
 Transit Investment Direction and Plan Introduction Transportation Advisory Board TPP Workshop August 16, 2017 Today s Topics - Transit Where are we now, what are the current issues? Where do we want to
SCS Scenario Planning
 E SCS Scenario Planning Introduction As part of the 2035 MTP/SCS process, AMBAG developed a series of land use and transportation alternative scenarios for evaluation and testing to demonstrate how the
MOBILITY AND ALTERNATIVES ANALYSIS
 6 MOBILITY AND ALTERNATIVES ANALYSIS BACK OF SECTION DIVIDER 6.0 Mobility and Alternatives Analysis Travel demand analysis provides a framework for the identification of transportation facilities and services
Management. VA SITE Annual Meeting June 27, 2013 Jay Styles Performance and Strategic t Planning Manager, Business Transformation Office
 VDOT and MAP-21 Performance Management VA SITE Annual Meeting June 27, 2013 Jay Styles Performance and Strategic t Planning Manager, Business Transformation Office Overview Map-21- How is VDOT Preparing?
2040 Addendum Performance-Based Planning November 2018
 2040 Long Range Transportation Plan 2040 Addendum Performance-Based Planning November 2018 Adopted June 13, 2018 250 S. Orange Ave, Suite 200, Orlando, FL 32801 407-481-5672 www.metroplanorlando.org MetroPlan
Mobility and System Reliability Goal
 Mobility and System Reliability Goal Provide surface transportation infrastructure and services that will advance the efficient and reliable movement of people and goods throughout the state. Background:
9.0 Meeting the Challenges
 9.0 Meeting the Challenges 9.1 SLRTP Goals The SLRTP is built around the six TxDOT Strategic Plan goals. 1. Develop an organizational structure and strategies designed to address the future multimodal
Fresno Council of Governments. Sustainable Communities Strategy Scenarios
 Fresno Council of Governments Sustainable Communities Strategy Scenarios 3 SCS Scenario Scenarios: A Scenario A Based on the input collected at the community workshop in November 2012 Metro vs. nonmetro
Appendix O Level of Service Standard and Measurements
 July 8, 2016 Appendix O. Appendix O Standard and Measurements Definition Level of service (LOS) is a mechanism used to determine how well a transportation facility is operating from a traveler s perspective.
SBCAG is a Joint Powers Authority (JPA) of the nine county jurisdictions, which provides a forum for solving regional problems
 of the nine county jurisdictions, which provides a forum for solving regional problems") SBCAG is a Joint Powers Authority (JPA) of the nine county jurisdictions, which provides a forum for solving regional problems The SBCAG region is coextensive with the County of Santa Barbara SBCAG fulfills
SBCAG is a Joint Powers Authority (JPA) of the nine county jurisdictions, which provides a forum for solving regional problems The SBCAG region is coextensive with the County of Santa Barbara SBCAG fulfills
Benefit-Cost Analysis Documentation
 Benefit-Cost Analysis Documentation Hyannis Access II: Project Matrix Current Status & Problem to be Addressed Heavily traveled roadway between the region s limited access highway and its largest commercial
Alternatives Identification and Evaluation
 I-290 Environmental Impact Statement West of Mannheim Road to East of Cicero Avenue Alternatives Identification and Evaluation May 2012 Draft Interim Report: Initial Alternatives Identification and Round
09Scenario Evaluation
 09 Evaluation CHAPTER 9: Evaluation 73 74 2018 Draft Regional Transportation Plan/Sustainable Communities Strategy 9 SCENARIO EVALUATION Testing The four scenarios discussed in the previous chapter were
VEHICLES MILES TRAVELED (VMT) TRAFFIC IMPACT METRIC
 TRAFFIC IMPACT METRIC") VEHICLES MILES TRAVELED (VMT) TRAFFIC IMPACT METRIC A project-specific quantified analysis of the MGA Campus has been undertaken to compare BAU to the project including the project s VMT reduction program
VEHICLES MILES TRAVELED (VMT) TRAFFIC IMPACT METRIC A project-specific quantified analysis of the MGA Campus has been undertaken to compare BAU to the project including the project s VMT reduction program
7.0 TRANSPORTATION MANAGEMENT
 7.0 TRANSPORTATION MANAGEMENT I. Introduction/Current State of Transportation Management in KC Region The Kansas City region has invested considerable effort and resources in the design and implementation
1003 K Street NW, Suite 209 Washington, DC MEMORANDUM. Matthew Ridgway, Nat Bottigheimer, and Alex Rixey, Fehr & Peers
 1003 K Street NW, Suite 209 Washington, DC 20001 202.854.2750 MEMORANDUM Date: To: From: Subject: Eric Graye, M-NCPPC Matthew Ridgway, Nat Bottigheimer, and Alex Rixey, Fehr & Peers Performance Metrics
2016 RTP/SCS Performance Measures Update Technical Working Group
 2016 RTP/SCS Performance Measures Update Technical Working Group March 19, 2015 Ping Chang & Naresh Amatya SCAG Staff Presentation Outline Background Evolving/Enhanced Performance Measures (PM) Framework
I-290 Eisenhower Expressway
 I-290 Eisenhower Expressway From west of Mannheim Road to Racine Avenue SECTION 2.0 Alternatives Alternatives December 2016 2.0 Alternatives 2.1 Introduction The process for developing and evaluating alternatives
Benefit Cost Analysis Narrative
 Chicago Region Environmental and Transportation Efficiency Program (CREATE) Grade Separations of: GS21a - Union Pacific and 95 th Street GS11 - Belt Railway Company of Chicago and Columbus Ave. GS 9 -
6 CHARTING PERFORMANCE
 DRAFT 6 CHARTING PERFORMANCE OVERVIEW OF PERFORMANCE BASED PLANNING Background of Performance Based Planning Increasingly, over the past two decades, transportation agencies have been utilizing performance
Sustainable Transportation & Land Use Integration Study
 Sustainable Transportation & Land Use Integration Study Stakeholders Group Meeting Two Includes additions made after meeting March 28, 2011 Hot Topics: Emerging themes, technologies, and techniques Outline
Critical Issues for Transportation Policy And Finance The Second William O. Lipinski Symposium on Transportation Policy
 Critical Issues for Transportation Policy And Finance The Second William O. Lipinski Symposium on Transportation Policy Martin Wachs, Director Transportation, Space & Technology The RAND Corporation Many
Greenhouse Gas Emission Reduction Strategies
 Greenhouse Gas Emission Reduction Strategies 2011 ITE Quad Conference April 18 19, 2011, Embassy Suites; Lynnwood, WA Victor L. Sl Salemann, PE Senior Associate David Evans and Associates Bellevue, WA
ACTIVE TRANSPORTATION ADVISORY COMMITTEE. Memphis MPO March 30, 2015
 ACTIVE TRANSPORTATION ADVISORY COMMITTEE Memphis MPO March 30, 2015 Agenda Welcome & Introductions Announcements and Briefings Livability 2040: Regional Transportation Plan Congestion Management Process
Transform 66 Multimodal Project: Prioritization Process and Evaluation Criteria Approved March 3, 2016
 Transform 66 Multimodal Project: Prioritization Process and Evaluation Criteria Approved March 3, 2016 The Memorandum of Agreement (MOA) for the Transform 66: Inside the Beltway Project directs NVTC to
Highway and Freight Current Investment Direction and Plan. TAB September 20, 2017
 Highway and Freight Current Investment Direction and Plan TAB September 20, 2017 Today s Topics Where are we now, what are the current issues? Where do we want to go? How will we get there? What are the
Moving Forward 2040 Long Range Transportation Plan Bicycle Mobility Master Plan Transit Master Plan
 Moving Forward 2040 Long Range Transportation Plan Bicycle Mobility Master Plan Transit Master Plan Paul DiGiuseppe Assistant Chief, Division of Planning Department of Administration (DOA) Needed to keep
APPENDIX B - GLOSSARY FEBRUARY 2017
 APPENDIX B - GLOSSARY FEBRUARY 2017 DENVERMOVES Transit Denver Moves: Transit - ii - APPENDIX B TRANSIT AND MOBILITY GLOSSARY Amenities, stop or station: Objects or facilities (such as a shelter, bench,
PERFORMANCE-BASED PLANNING AND PROGRAMMING
 February 2017 performance-based planning and programming Boston Region MPO PERFORMANCE-BASED PLANNING AND PROGRAMMING WHAT IS PERFORMANCE-BASED PLANNING AND PROGRAMMING? Performance-based planning and
Category 3, BART Capacity, Access and Parking Improvements. Contra Costa Transportation Authority STAFF REPORT Page 2 of 5 The Authority directed staf
 Meeting Date: Subject Summary of Issues Recommendations Financial Implications Options Attachments Changes from Committee Development of a Potential Transportation Expenditure Plan (TEP) Review and Discussion
Future Build Alternative Traffic Forecasts and Level of Service Analysis
 4.2.10 Future Build Alternative Traffic Forecasts and Level of Service Analysis For the five Build Alternatives, study intersections within one mile of potential station locations were analyzed, as it
Executive Summary. What is the Regional Transportation Commission of Southern Nevada?
 Executive Summary What is the Regional Transportation Commission of Southern Nevada? With more than 2 million people living in Southern Nevada and another 39 million tourists visiting our community annually,
Public Input from Regional Visioning Forums
 Public Input from Regional Visioning Forums Innovation and Economic Development Provide transportation systems to continue to position Florida as a global hub for trade, logistics, and exports-oriented
12 Evaluation of Alternatives
 12 Evaluation of Alternatives This chapter evaluates the effectiveness of the No-Build Alternative and the proposed METRO Blue Line Light Rail Transit (BLRT) Extension project based on the information
ITEM 11 - Information January 21, Briefing on Project Submissions for the 2015 CLRP
 ITEM 11 - Information January 21, 2015 Briefing on Project Submissions for the 2015 CLRP Staff Recommendation: Issues: Background: Receive briefing on the major projects submitted for the 2015 CLRP by
Database and Travel Demand Model
 Database and Travel Demand Model 7 The CMP legislation requires every CMA, in consultation with the regional transportation planning agency (the Metropolitan Transportation Commission (MTC) in the Bay
CHAPTER 8. Congestion Management
 CHAPTER 8 Congestion Management CHAPTER 8: Congestion Management The CMP is a management system and process conducted to improve traffic operations and safety through operational improvements and strategies
Long-Range Plan Task Force: Draft Analysis Results
 Long-Range Plan Task Force: Draft Analysis Results November 15, 2017 Prepared for: National Capital Region Transportation Planning Board Transportation Planning Board Item #9 Presentation Components Analysis
New Climate for Transportation. How the City of San Diego and SANDAG must improve transportation to meet climate goals.
 New Climate for Transportation How the City of San Diego and SANDAG must improve transportation to meet climate goals. 2 N e w C l i m a t e f o r T r a n s p o r t a t i o n Acknowledgements Colin Parent
10.0 Congestion Management Process
 Livability 2040 Regional Transportation Plan 10-1 10.0 Congestion Management Process 10.1 CMP Summary The identification and evaluation of projects for the Livability 2040 Regional Transportation Plan
TCATS October 12-Michigan Works 5:30-7pm. NATS October 19-Niles District Library 6-7:30pm
 Goal Development Workshop TCATS October 12- Works 5:30-7pm NATS October 19-Niles District Library 6-7:30pm SAFETEA-LU Goals 2035 TwinCATS Goals 2030 TwinCATS Goals 1. Support the economic vitality of the
Congestion Management Process 2013 Update
 Congestion Management Process 2013 Update TRAVEL DEMAND MANAGEMENT AND TRANSPORTATION SYSTEM MANAGEMENT AND OPERATIONS STRATEGIES AND PROJECTS TDM and TSM&O Strategies Commuter Transportation Options Associated
REGIONAL VISION REGIONAL GOALS
 REGIONAL VISION Greater Kansas City is a region of opportunity. Its robust economy, healthy environment and social capacity support the creativity, diversity and resilience of its people, places and communities.
Guidance for Responding to the Transportation 2040 Prioritization Measures
 2018 Transportation 2040 Update January 2017 Call for Projects Guidance for Responding to the Transportation 2040 Prioritization Measures Introduction The purpose of this document is to give project sponsors
Comparison of I-210 and I-710 as Potential ICM Corridors
 Comparison of I-210 and I-710 as Potential ICM Corridors Positive Aspects Traffic sensors Very good PeMS coverage of freeway mainline, HOV lanes, and ramps Many intersections within Pasadena already equipped
VISION STATEMENT, MISSION STATEMENT, AND GOALS AND OBJECTIVES
 VISION STATEMENT, MISSION STATEMENT, AND GOALS AND OBJECTIVES Vision Statement: Our vision is to provide a high quality, safe, efficient, and cost-effective multi-modal transportation system that supports
Alternatives Analysis
 Alternatives Analysis Evaluation Framework Report Prepared for: Metropolitan Atlanta Rapid Transit Authority Prepared by: AECOM/JJG Joint Venture Atlanta, GA November 2012 TABLE OF CONTENTS Executive Summary
December 19, 2014 VIA E- MAIL. Re: Recommendations for the 2015 Interregional Transportation Strategic Plan (ITSP) Update
 Update") December 19, 2014 Tracey Frost, System Planning Branch Chief Caltrans Office of Multimodal System Planning Division of Transportation Planning Sacramento, CA 94274 E- mail: Tracey_Frost@dot.ca.gov hq.system.planning@dot.ca.gov
December 19, 2014 Tracey Frost, System Planning Branch Chief Caltrans Office of Multimodal System Planning Division of Transportation Planning Sacramento, CA 94274 E- mail: Tracey_Frost@dot.ca.gov hq.system.planning@dot.ca.gov
Appendix F 2008 Travel Demand Modeling
 Appendix F 2008 Travel Demand Modeling TRAVEL DEMAND MODELING Purpose: The Jackson/Teton County Comprehensive Plan Update is revisiting land use and transportation planning policies to ensure they can
09Scenario. Evaluation. CHAPTER 9: Scenario Evaluation 85. Modesto Junior College, Modesto, CA
 09 Evaluation Modesto Junior College, Modesto, CA CHAPTER 9: Evaluation 85 86 2018 Regional Transportation Plan/Sustainable Communities Strategy Historic Downtown, Turlock, CA 9 SCENARIO EVALUATION Testing
WELCOME. Schedule. Contact Information. Please Provide Written Comments
 WELCOME Schedule April 18, 2012 Open House: 6:30 p.m. to 8:30 p.m. Project Presentation: 7:00 p.m. Mary Ellen Henderson Middle School 7130 Leesburg Pike Falls Church, VA 2203 Contact Information Kala Leggett
Dumbarton Transportation Corridor Study
 Dumbarton Transportation Corridor Study Stakeholder/Public Meeting September 2016 Dumbarton Corridor Source: Wikipedia 2 1 Transportation Study Initiated due to recent growth Study partners: SMCTA ACTC
CHAPTER 6 TRANSPORTATION PLAN AND POLICIES
 CHAPTER 6 TRANSPORTATION PLAN AND POLICIES TRANSPORTATION PLAN AND POLICIES The extent to which the 2014 RTP/SCS improves the performance of the region s transportation system, improves mobility and access,
CHAPTER 8 TRANSPORTATION ELEMENT
 CHAPTER 8 TRANSPORTATION ELEMENT Section 8.01 Purpose: The purpose of this Chapter (element) is to establish the desired and projected transportation system within Niceville and to plan for future motorized
CHARTING PROGRESS TO 2040 RESULTS OF MINI-SURVEYS
 CHARTING PROGRESS TO RESULTS OF MINI-SURVEYS A series of mini-surveys was released between May and July, to collect input on investment strategies for Charting Progress to, the Boston Region s long-range
PERFORMANCE-BASED PLANNING AND PROGRAMMING
 February 2017 performance-based planning and programming Boston Region MPO PERFORMANCE-BASED PLANNING AND PROGRAMMING WHAT IS PERFORMANCE-BASED PLANNING AND PROGRAMMING? Performance-based planning and
City of Berkeley. Guidelines for Development of Traffic Impact Reports
 Office of Transportation (OOT) City of Berkeley Guidelines for Development of Traffic Impact Reports Office of Transportation, City of Berkeley 1 1. Overview These guidelines provide a framework to help
Des Moines Area MPO. MPO Planning Subcommittee Meeting March 3, Des M oines Area M etropolitan Planning Organization
 Des Moines Area MPO MPO Planning Subcommittee Meeting March 3, 2014 2014 Des M oines Area M etropolitan Planning Organization Agenda 1. Call To Order 2. VOTE: Approval of Agenda 3. VOTE: Approval of Meeting
I-81 CORRIDOR IMPROVEMENT PLAN EXECUTIVE SUMMARY
 I-81 CORRIDOR IMPROVEMENT PLAN EXECUTIVE SUMMARY DECEMBER 3, 2018 Overview As a critical north-south backbone of the East Coast s freight network, the I-81 corridor is vital to the efficient movement of
Transportation A Conversation on Regional Transportation. Tacoma City Manager April 15, Update to the Regional Transportation Plan
 Transportation 2040 Update to the Regional Transportation Plan A Conversation on Regional Transportation Tacoma City Manager April 15, 2009 1 Puget Sound Regional Council The Region: 4 counties 82 cities
3. STATION SPACING AND SITING GUIDELINES
 3. STATION SPACING AND SITING GUIDELINES The station spacing and siting guidelines are summarized in Table 3-1. Table 3-1 also includes benchmark information for local transit service and express bus as
Progress Report Regional Express & Bus Rapid Transit Program
 Progress Report Regional Express & Bus Rapid Transit Program ST Express Bus routes serve urban centers in Snohomish, King, and Pierce. March 2018 Prepared by Project Control & VE l Design, Engineering
SUBURBAN EDGE COMMUNITY ROLE COUNCIL ROLE ALL COMMUNITIES SUBURBAN EDGE
 Orderly and Efficient Land Use Align land use, development patterns, and infrastructure to make the best use of public and private investment. Plan and stage development for forecasted growth through 2040