Emissions Calculations Joshua Kalfas. Emissions Inventory Workshop February 3 rd, 2015 Tulsa, OK
|
|
|
- Jade Powers
- 5 years ago
- Views:
Transcription


1 Emissions Calculations Joshua Kalfas Emissions Inventory Workshop February 3 rd, 2015 Tulsa, OK
2 Introduction Q: What is an Air Emissions Inventory? A: It is a report describing a facility. It lists activities/equipment that release emissions through various processes and quantifies emissions released. Two fundamental questions to ask before completing emission calculations: What is this emission? Where did this emission come from? 2
3 Presentation Structure Topics and Example Calculations Include: Emission Release Points "Stack" "Fugitive Emissions" Overview of General Emission Calculation Equation Activities or Processes Emission Factors Emissions Notes and Example Calculations Volatile Organic Compound (VOC) Guidance Update Particulate Matter Control Scenarios Final Important Items to Remember 3
4 Emission Release Points "Stack" means, unless specifically defined otherwise, any chimney, flue, duct, conduit, exhaust, pipe, vent or opening designed or specifically intended to conduct emissions to the atmosphere. "Fugitive Emissions" means, unless specifically defined otherwise, those emissions which could not reasonably pass through a stack, chimney, vent, or other functionally equivalent opening. 4
5 Emission Release Points "Stack" parameters to report include: Height (feet) Diameter (feet) Gas Temp ( F) Flow Rate (acfm)* AND/OR Gas Exit Velocity (ft/s) *details discussing the importance of reporting acfm are discussed in which is found in the EI FAQs. 5
6 Emission Release Points "Fugitive emissions" parameters to report include: Height Above Grade (feet) Surface Area (square feet) 6
7 Overview of General Equation A EF = E A is Activity Rate EF is Emission Factor (determined by method) E is calculated Emission 7
8 Overview of General Equation A EF = E A is Activity Rate Identify an Activity or Process By Reviewing: Permit Information Previous Emissions Inventory Permit Application Comprehensive Process Flow Diagrams Manufacturer or Supplier Details Site Maps Plot Plans 8
9 Overview of General Equation A EF = E A is Activity Rate Collect Information On: Source Classification Code Process Material Process Rate Hours Process Occurred Design Capacity (if applicable) Fuel Data (if applicable) Reportable Pollutants Control Scenario (if applicable) Permit or Rule Limit (if applicable) Excess Emissions (if applicable) 9
10 Overview of General Equation A EF = E EF is Emission Factor (determined by method) Q: What is an Emission Factor? A: An Emission Factor is a representative value that attempts to relate the quantity of a pollutant released to the atmosphere with an activity associated with the release of that pollutant. 10
11 Relative Accuracy Overview of General Equation A EF = E EF is Emission Factor (determined by method) Calculation Methods Continuous Emission Monitoring System (CEMS) EPA RM Stack Test Similar Unit EPA RM Stack Test Mass Balance Manufacture Test Data Process Simulation Software WebFIRE Data Factors (EPA) AP-42 or other EPA Documents 11
12 Overview of General Equation All Values Have Physical Dimensions A EF = E Two fundamental questions to ask before completing emission calculations: What is this emission? Where did this emission come from? 12
13 Overview of General Equation A EF = E EF is Emission Factor (determined by method) WebFIRE and AP-42 13
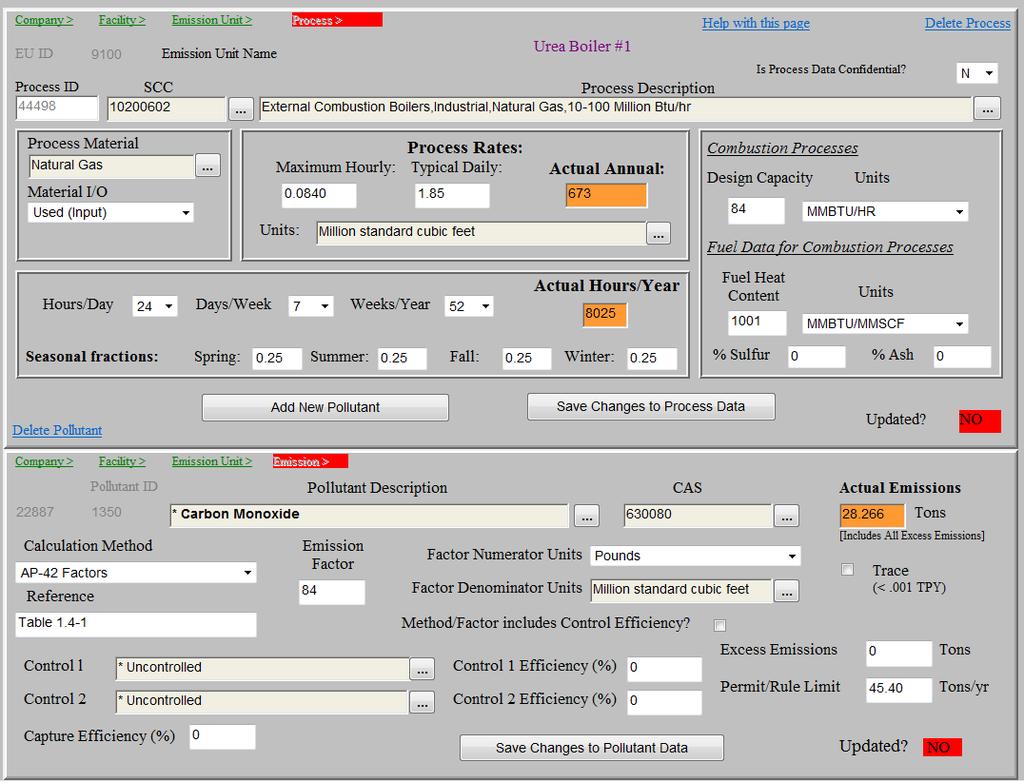
14 Industrial Boiler CO calculation using AP-42 Activity Information: Source Classification Code: Process Material: Natural Gas Process Rate: 673 mmscf/1 year Hours Process Occurred: 8,025 Design Capacity (if applicable): 84 mmbtu/1 hour Fuel Data (if applicable): 1,001 mmbtu/1 mmscf Reportable Pollutants: example Control Scenario (if applicable): none Permit or Rule Limit (if applicable): tons/year Excess Emissions (if applicable): - 14
15 Industrial Boiler CO calculation using AP
16 Industrial Boiler CO calculation using AP-42 A EF = E 673 mmscf NG 84 lbs CO 1 mmscf NG = 56, 532 lbs CO Convert to Tons 56, 532 lbs CO 1 ton 2, 000 lbs = tons CO 16

17 17
: 400 hp Fuel Data (if applicable): 137 mmbtu/1000 gal Reportable Pollutants: example Control Scenario (if applicable): none Permit or Rule Limit")
18 Reciprocating Emergency Generator NO x calculation using WebFIRE Activity Information: Source Classification Code: Process Material: Diesel Fuel Process Rate: 10 gal Diesel Fuel/1 hour Hours Process Occurred: 50 Design Capacity (if applicable): 400 hp Fuel Data (if applicable): 137 mmbtu/1000 gal Reportable Pollutants: example Control Scenario (if applicable): none Permit or Rule Limit (if applicable): - Excess Emissions (if applicable): - 18
19 Reciprocating Emergency Generator NO x calculation using WebFIRE 19
20 Reciprocating Emergency Generator NO x calculation using WebFIRE 500 gal diesel 302 lbs NO x A EF = E 604 lbs NO x 1, 000 gal diesel = 302 lbs NO x Convert to Tons 1 ton 2, 000 lbs = tons NO x 20
21 Volatile Organic Compounds (VOC) VOC reporting guidance has changed: When calculating Total VOC emissions, do not subtract other pollutants from the Total VOC emission value. Calculate and report all other pollutants as usual. Verify that existing databases or spreadsheets completing calculations are updated to reflect current reporting guidance. 21
: 1,100 horse power Fuel Data (if applicable): 1,020 mmbtu/mmscf Reportable Pollutants: example Control Scenario (if applicable): none")
22 2-Cycle Lean Burn NG Engine VOC & Formaldehyde calculation using WebFIRE Activity Information: Source Classification Code: Process Material: Natural Gas Process Rate: 46 mmscf NG/1 year Hours Process Occurred: 5500 Design Capacity (if applicable): 1,100 horse power Fuel Data (if applicable): 1,020 mmbtu/mmscf Reportable Pollutants: example Control Scenario (if applicable): none Permit or Rule Limit (if applicable): - Excess Emissions (if applicable): - 22


23 2-Cycle Lean Burn NG Engine VOC & Formaldehyde calculation using WebFIRE 23
24 2-Cycle Lean Burn NG Engine VOC & Formaldehyde calculation using WebFIRE A EF = E 46 mmscf NG 1, 020 mmbtu NG 1 mmscf NG lbs VOC 1 mmbtu NG = 5, lbs VOC Convert to Tons 5, lbs VOC 1 ton 2, 000 lbs = tons VOC 24
25 2-Cycle Lean Burn NG Engine VOC & Formaldehyde calculation using WebFIRE A EF = E 46 mmscf NG 1, 020 mmbtu NG 1 mmscf NG lbs Form 1 mmbtu NG = 2, 590 lbs Form Convert to Tons 2, 590 lbs Form 1 ton 2, 000 lbs = tons Form 25
26 2-Cycle Lean Burn NG Engine VOC & Formaldehyde calculation using WebFIRE tons Total VOC tons Formaldehyde tons VOC (non HAP) Report Both Emissions Without Subtractions tons Total VOC tons Formaldehyde 26
: - Fuel Data (if applicable): - Reportable Pollutants: example Control Scenario (if applicable): none Permit or Rule Limit (if applicable): - Excess")
27 Surface Coating VOC & Xylene calculation using MSDS Activity Information: Source Classification Code: Process Material: Acrylic Red Top Coat Process Rate: 800 gallons/1 year Hours Process Occurred: 2,080 Design Capacity (if applicable): - Fuel Data (if applicable): - Reportable Pollutants: example Control Scenario (if applicable): none Permit or Rule Limit (if applicable): - Excess Emissions (if applicable): - 27
28 Surface Coating VOC & Xylene calculation using MSDS 28
29 Surface Coating VOC & Xylene calculation using MSDS A EF = E 800 gallons paint lbs VOC 1 gallon paint = 7, 000 lbs VOC Convert to Tons 7, 000 lbs VOC 1 ton 2, 000 lbs = 3. 5 tons VOC 29
30 Surface Coating VOC & Xylene calculation using MSDS A EF = E 800 gallons paint = 3. 5 tons VOC 3. 5 tons VOC Xylene VOC = tons Xylene 30
31 Surface Coating VOC & Xylene calculation using MSDS tons Total VOC tons Xylene tons VOC (non HAP) Report Both Emissions Without Subtractions tons Total VOC tons Xylene 31
")
32 Particulate Matter (PM) 32
33 Particulate Matter (PM) Two classes of Particulate Matter (PM) are reported in emissions inventories: PM-10, which is all particulate matter where aerodynamic diameter 10 μm This value should always be PM-2.5 in OK DEQ EIs PM-2.5, which is all particulate matter where aerodynamic diameter 2. 5 μm PM (Condensable) is part of PM
: - Fuel Data (if applicable): - Reportable Pollutants: example Control Scenario (if applicable): none Permit or Rule Limit (if applicable): - Excess")
34 Stone Quarry Tertiary Crushing PM-10 calculation using AP-42 Activity Information: Source Classification Code: Process Material: Stone Process Rate: 1,361,120 tons/1 year Hours Process Occurred: 3,640 Design Capacity (if applicable): - Fuel Data (if applicable): - Reportable Pollutants: example Control Scenario (if applicable): none Permit or Rule Limit (if applicable): - Excess Emissions (if applicable): - 34
35 Stone Quarry Tertiary Crushing PM-10 calculation using AP
36 Stone Quarry Tertiary Crushing PM-10 calculation using AP-42 A EF = E 1, 361, 120 tons stone lbs PM 10 1 ton stone = 3, 267 lbs PM 10 3, 267 lbs PM 10 Convert to Tons 1 ton 2, 000 lbs = tons PM 10 36
37 Control Scenarios Q: What is a Control Scenario? A: It is a control system, abatement equipment, or an approach applied to reduce emissions of a pollutant. 37
38 Control Scenarios Q: What is Capture Efficiency? A: When a control scenario is operating as designed, it is the percentage of air emissions that are directed to the control equipment or an estimate of that portion of an affected emissions stream that is collected and routed to the control measure. 38
39 Control Scenarios Q: What is Control Efficiency? A: It is the percentage of actual air emissions prevented from being emitted by the control scenario. The actual efficiency should reflect device degradation. Any emissions during downtime should be accounted for in the total actual emissions. 39
40 Control Scenarios A EF = E E is Emission To Include a Control Scenario: Calculate the Emission Apply the Capture Efficiency Apply the Control Efficiency to the Captured Emission Sum the Uncaptured Emission and the Emission Remaining After Applying the Control Efficiency 40

41 Control Scenarios A EF = E E is Emission 100 Tons Uncontrolled Emission 50 Tons Control Scenario 50% Capture 25 Tons 50% Control 75 Tons Total Emission 50 Tons A EF 1 ER Not all Capture Efficiencies 100 = E are 100%. Use appropriately. 41
42 Stone Quarry Tertiary Crushing PM-10 calculation using AP-42 and a Control Activity Information: Source Classification Code: Process Material: Stone Process Rate: 1,361,120 tons/1 year Hours Process Occurred: 3,640 Design Capacity (if applicable): - Fuel Data (if applicable): - Reportable Pollutants: example Control Scenario (if applicable): Dust Suppression Permit or Rule Limit (if applicable): - Excess Emissions (if applicable): - Capture = 100% Control = 77.7% 42
43 Stone Quarry Tertiary Crushing PM-10 calculation using AP-42 and a Control A EF 1 ER 100 = E tons PM = tons PM 10 Most Capture Efficiencies are 100% 43
: - Fuel Data (if applicable): - Reportable Pollutants: example Control Scenario (if applicable): Cyclone & Filter/Baghouse Permit or Rule Limit (if")
44 Grain Handling Facility PM-10 calculation with a Control Scenario Activity Information: Source Classification Code: Process Material: Grain Process Rate: 10,000 tons/1 year Hours Process Occurred: 8,760 Design Capacity (if applicable): - Fuel Data (if applicable): - Reportable Pollutants: example Control Scenario (if applicable): Cyclone & Filter/Baghouse Permit or Rule Limit (if applicable): - Excess Emissions (if applicable): - 44

45 Grain Handling Facility PM-10 calculation with a Control Scenario 45
46 Grain Handling Facility PM-10 calculation with a Control Scenario A EF = E 10, 000 tons grain 3 lbs PM 10 1 ton grain = 30, 000 lbs PM 10 30, 000 lbs PM 10 Convert to Tons 1 ton 2, 000 lbs = 15 tons PM 10 46
47 Grain Handling Facility PM-10 calculation with a Control Scenario Before applying A EF 1 ER 100 = E 15 tons PM 10 10% = 1. 5 tons PM tons of PM 10 is uncaptured and directly emitted 47
48 Grain Handling Facility PM-10 calculation with a Control Scenario tons PM = 2. 7 tons PM tons PM = tons PM tons of PM 10 is directly emitted after the control scenario 48
49 Grain Handling Facility PM-10 calculation with a Control Scenario Sum the Uncaptured Emission and the Emission Remaining After Applying the Control Scenario 1. 5 tons PM tons PM 10 = tons PM tons PM 10 is emitted with no Control Scenario tons of PM 10 is emitted with the Control Scenario
50 Important Items To Remember A Facility s Potential To Emit (PTE) Does Not Equal a Facility s Reportable Emissions Remember to Apply Most Current Guidance "The best available data at the time the emission inventory is or should have been prepared shall be used to determine emissions." Report Gap-Filled CEMS Data Calculation Parameters Are Needed For Redbud! Do Reported Parameters Enable Emissions Verification? Supporting Documentation Must Be Maintained 50
51 OKDEQ Emission Inventory Section If you would like to see an example calculation for another industry, activity, or control scenario not presented today: with your request. 51
52 Questions? 52
53 OKDEQ Emission Inventory Section Program Manager: Mark Gibbs Emission Inventory Section Staff: Michelle Horn Joshua Kalfas Cecelia Kleman Christopher Laley Cody Lathrop Carrie Schroeder 53