Opportunities and barriers to implementing circular economy in a big city. Wednesday 5 July 2017
|
|
|
- Marion Banks
- 5 years ago
- Views:
Transcription

1 Opportunities and barriers to implementing circular economy in a big city Wednesday 5 July 2017
2 Background to LWARB LWARB has three objectives, prescribed by the GLA Act: To promote and encourage, so far as relating to Greater London: the production of less waste an increase in the proportion of waste that is re-used or recycled and the use of methods of collection, treatment and disposal of waste which are more beneficial to the environment The Board must: act in accordance with provisions of the London Environment Strategy dealing with municipal waste management act in general conformity with the London Plan The Board may: Do anything that it thinks will facilitate, or is incidental or conducive to, the carrying out of its functions - (except borrow money)
3 Background to LWARB The London Waste and Recycling Board (LWARB) was introduced following a review of Mayoral and Assembly power LWARB was established in the GLA Act 2007 and other matters were prescribed in the London Waste and Recycling Board Order 2008 The Board is chaired by the Mayor of London or his/her representative the current chair is Liz Goodwin (until 2016 the chief executive of WRAP). The first Chair of LWARB was Boris Johnson ( ) followed by James Cleverly AM until 2012 and then Richard Tracey AM until May 2016 LWARB has received c. 76 million in grant funding from government and GLA/LDA between LWARB is not currently in receipt of grant income from government with future programmes being funded by returns on investment.
 850,000 commercial loan Delivery programme working in partnership with business, local government, academia, and other cities Existing programme supplemented by additional 1")
4 LWARB Programmes 175,000 pa to 2020 (plus EU and other contributions) 1,500,000 pa (plus WRAP and EU funding) 1,000,000 to 2020 (flats) Support 650,000 (+ EU) LGF 7,000,000 (+ EU ) Accelerator 1,500,000 (+ match) 850,000 commercial loan Delivery programme working in partnership with business, local government, academia, and other cities Existing programme supplemented by additional 1 million contribution to an intensive flats recycling taskforce programme. 3 year Circular Economy Business Support programme; Accelerator / Incubator with VC fund; LGF circular economy start up fund Stand alone business to increase revenues for LA commercial waste. Wholly owned by LWARB capitalised with 850,000 loan boroughs, business, GLA boroughs, GLA boroughs, business boroughs, business
5
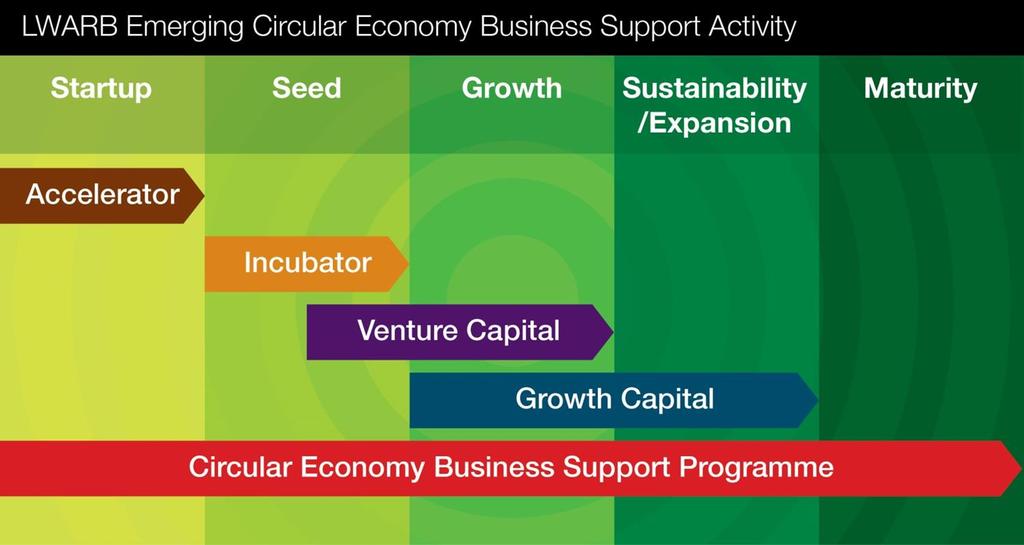
6 Investment and business support to catalyse development of the circular economy. Supporting SMEs, from start up to maturity, with the aim of reducing London s waste footprint and creating economic benefits for the city, including new jobs. A partnership model with funds being deployed to draw in capital and resources from the private sector. Risk diversification policy via fund or intermediary investment rather than direct investment. Investment budget to 2020 (excluding overheads but including business support programme) is c m.


7 Portfolio Management New Investment Activity Collaboration Business Support
8

 : 1. Circular supplies 2.")


9 Advance London Business Support is a three-year programme jointly funded by the ERDF and LWARB. What? Advance London will support businesses to develop, pilot and implement new and innovative circular business models (based on research by Accenture) : 1. Circular supplies 2. Resource recovery 3. Product life extension 4. Sharing platforms 5. Product as a service The programme will be primarily targeted at SMEs active in five priority sectors : Built environment Food Textiles Electricals Plastics For who? How? Over the 3 years Advance London will be focussed on: Providing 100 SMEs with at least 3 hours of support Providing 80 SMEs with at least 12 hours of support Helping SMEs create at least 48 new jobs Enabling SMEs to introduce 30 new product offerings Market research Business Planning Financial modelling Networking (i.e. supply chains) Facilitating access to investment and funding
10
11 A circular economy is one that keeps products, components and materials at their highest use and value at all times. Five key focus areas: built environment; food; textiles; electricals; and plastics. Accelerating a circular economy in London will contribute to the reduction of the city s waste, increase recycling and re-use, create jobs in re-use, remanufacturing and materials innovation and contribute to London s zero carbon city aspirations. Moving to a circular economy within these focus areas, could bring London net benefits of at least 7 billion every year by 2036 and 12,000 net new jobs. LWARB has published a route map to a more circular economy in London which will help direct our activities in this area in June this year.

12
13 What does the route map cover for each focus area? the opportunity the circular economy presents what the key challenges are what s happening already what practical actions could move us forward in London 13
14 Cross cutting themes in the route map Communications Collaboration Policy Procurement Finance Business support Innovation Collaboration Demonstration 14


15 Communication Collaboration Demonstration Funding

16
17
18 Resource London London waste authority support programme established in April 2015 as a jointly funded partnership between LWARB and WRAP. Budget of 9.3 million between (including LWARB, WRAP and EU funding). By 2020, London will have more harmonised, consistent and efficient waste and recycling services that will: Reduce the city s waste footprint and reinvigorate recycling to make a significant contribution towards the Mayor s ambition for London to achieve 65% recycling by 2030; and make a significant contribution towards England achieving its 50% household waste recycling target in 2020.


19 Minimising the amount of waste produced and maximising re-use Increasing and improving the capture of unavoidable food waste Improving the yield and quality of dry recycling Restricting residual waste

20 support delivered through three work-streams: Service support to recycle greater volumes of higher quality materials whilst reducing costs; Behaviour Change London wide and borough level communications and behaviour change activity Innovation and development Developing expertise within waste authorities to reduce identified skills gaps and enable progressive solutions to be implemented. 3.2 million three year innovative food waste intervention project; 1 million Flats Taskforce 2.4 million three year Recycle for London regional behaviour change campaign
21 Background to London Waste and Recycling Board Context to London s recycling performance
22 Unique challenges facing the capital 8.7 million residents, forecast to reach 10 million by the 2030 s; Flats accounting for up to 80% of housing stock in some boroughs, and purpose built flats account for 37% of London total housing stock. GLA projections show this figure rising to 46% by 2030 (with an additional c.1.89million purpose built flats being built by that date); London is a city of transience and movement 32% of households in London s private rented sector have moved in the last year and 70% have lived in their current home for less than two years. Huge swell of daytime visitors; London is also culturally diverse, with more than 100 different languages spoken in almost every borough across London Significant budget constraints, resent cuts to central government grants since , have reduced spending per London resident on average 31.4%. These are set within the context of a complex service provision landscape, with 33 local authorities operating their own separate recycling collection approaches.
23 Recyling Rate REcylcing Rate Recycling Rate Social challenge 60,0% 50,0% 40,0% 30,0% 20,0% 10,0% 0,0% Popuation Density (/km^2) 60% 60,0% 50% 50,0% 40% 30% 20% 10% 40,0% 30,0% 20,0% 10,0% 0% Index of Multiple Depivation 0,0% % Homes owned outright or with mortgage

24 London Waste disposal and collection arrangements
25 London performance Recycling Rate 52,0 14,7 12/13. 13/14. 14/15. 15/16 London England Bexley Newham Household Waste (Kg per HH) , , /13. 13/14. 14/15. 15/16 London England Barking Ealing % Landfilled 12/13. 13/14. 14/15. 15/16 London England 60,00% Borough Recycling Rates ,00% 40,00% 30,00% 20,00% 10,00% 0,00% 2012/ / / /16
26 London fact sheet Recycling Residual Property Recycling collection 12% 6% 82% Recycling containment 21% 27% 3% 49% Refuse containers 42% 58% Housing ownership 2% 25% 48% 24% 1% comingled twin stream source separated Bins boxes sacks containers sacks Owned; Total Social Rented; Total Living Rent Free Shared Ownership Private Rented; Total Food collections 30% 15% 58% food mixed organics chargabl e with no food free with no food Free - combine d organics Green waste collections Separat e food no garden None Free plus separate food Chargea ble with separate food Refuse frequency 27% 9% 64% more than weekly weekly fortnightly conve rted ; 12,63 % purpo se ; 37,60 % Property types detac hed ; 6,26 % flats in comm ercial; 1,85 % semi; 18,67 % terrac e ; 22,99 %

27 Recycling Collection Service Providers
28 Nb. Both LB Recycling Collections with organics
29 Residual Collection
30