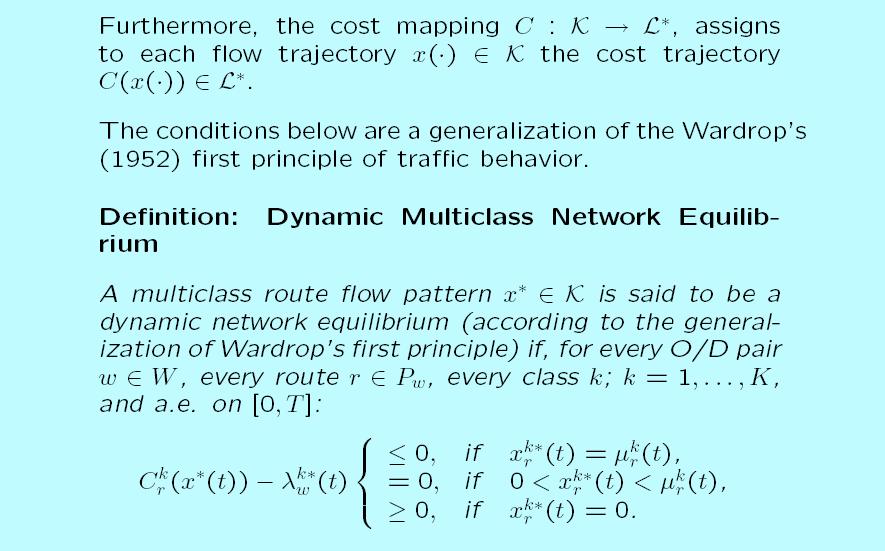
Anna Nagurney John F. Smith Memorial Professor Department of Finance and Operations Management University of Massachusetts Amherst, MA 01003
|
|
|
- Ralph Burns
- 5 years ago
- Views:
Transcription

1 Multicriteria Decision-Making for the Environment: Sustainability and Vulnerability Analysis of Critical Infrastructure Systems from Transportation Networks to Electric Power Supply Chains Anna Nagurney John F. Smith Memorial Professor Department of Finance and Operations Management University of Massachusetts Amherst, MA th International Conference on Multiple Criteria Decision Making MCDM for Sustainable Energy and Transportation Systems January 8, 2008
2 Funding for this research has been provided by: National Science Foundation AT&T Foundation John F. Smith Memorial Fund - University of Massachusetts at Amherst
3 Outline of Presentation Background The Transportation Network Equilibrium Problem and Methodological Tools The Braess Paradox Transportation and Critical Infrastructure Networks Some Interesting MCDM Applications to Sustainability A New Network Performance/Efficiency Measure with Applications to Critical Infrastructure Networks A New Approach to Transportation Network Robustness What About Dynamic Networks? The Time-Dependent (Demand-Varying) Braess Paradox and Evolutionary Variational Inequalities Extension of the Efficiency Measure to Dynamic Networks Where Are We Now? An Empirical Case Study
4 Background
5 We Are in a New Era of Decision-Making Characterized by: complex interactions among decision-makers in organizations; alternative and at times conflicting criteria used in decision-making; constraints on resources: natural, human, financial, time, etc.; global reach of many decisions; high impact of many decisions; increasing risk and uncertainty, and the importance of dynamics and realizing a fast and sound response to evolving events.
6 Network problems are their own class of problems and they come in various forms and formulations, i.e., as optimization (linear or nonlinear) problems or as equilibrium problems and even dynamic network problems. Critical infrastructure network problems, with an emphasis on Transportation, will be the focus of this talk.


7 Bus Network Transportation, Communication, and Energy Networks Rail Network Iridium Satellite Constellation Network Satellite and Undersea Cable Networks British Electricity Grid
8 Components of Common Physical Networks Network System Nodes Links Flows Transportation Intersections, Homes, Workplaces, Airports, Railyards Roads, Airline Routes, Railroad Track Automobiles, Trains, and Planes, Manufacturing and logistics Communication Workstations, Distribution Points Computers, Satellites, Telephone Exchanges Processing, Shipment Fiber Optic Cables Radio Links Components, Finished Goods Voice, Data, Video Energy Pumping Stations, Plants Pipelines, Transmission Lines Water, Gas, Oil, Electricity

9 US Railroad Freight Flows

10 Natural Gas Pipeline Network in the US

11 World Oil Trading Network

12 The study of the efficient operation on transportation networks dates to ancient Rome with a classical example being the publicly provided Roman road network and the time of day chariot policy, whereby chariots were banned from the ancient city of Rome at particular times of day.
13 policies surrounding networks today may have a major impact not only economically but also environmentally, socially, politically, and securitywise. Characteristics of Networks Today large-scale nature and complexity of network topology; congestion; the interactions among networks themselves such as in transportation versus telecommunications;
14 alternative behaviors of the users of the network system-optimized versus user-optimized (network equilibrium), which may lead to paradoxical phenomena.
15 The Transportation Network Equilibrium Problem and Methodological Tools
 beginning with the book, Studies in the Economics of Transportation, by Beckmann, McGuire, and Winsten")
16 Transportation science has historically been the discipline that has pushed the frontiers in terms of methodological developments for such problems (which are often large-scale) beginning with the book, Studies in the Economics of Transportation, by Beckmann, McGuire, and Winsten (1956).
17 Quandt (1967) and Schneider (1968) introduced multicriteria decisionmaking into transportation network modeling (see also Dial (1979)). Dafermos (1980) showed that the transportation network equilibrium (also referred to as user-optimization) conditions as formulated by Smith (1979) were a finite-dimensional variational inequality. In 1981, Dafermos proposed a multicriteria transportation network equilibrium model in which the costs were flow-dependent. In 1993, Dupuis and Nagurney proved that the set of solutions to a variational inequality problem coincided with the set of solutions to a projected dynamical system (PDS) in R n. In 1996, Nagurney and Zhang published Projected Dynamical Systems and Variational Inequalities. In 2002, Cojocaru proved the 1993 result for Hilbert Spaces. In 2002, Nagurney and Dong published Supernetworks: Decision- Making for the Information Age.
")
18 The Transportation Network Equilibrium (TNE) Problem

19 In other words, the cost of a path is equal to the sum of the costs on the links comprising the path.

20 Transportation Network Equilibrium

21
22 The Braess (1968) Paradox Assume a network with a single O/D pair (1,4). There are 2 1 paths available to travelers: a b p 1 =(a,c) and p 2 =(b,d). For a travel demand of 6, the 2 3 equilibrium path flows are x * p1 = x * p2 = 3 and c d The equilibrium path travel cost 4 is C p1 = C p2 = 83. c a (f a )=10 f a c b (f b ) = f b +50 c c (f c ) = f c +50 c d (f d ) = 10 f d
23 Adding a Link Increases Travel Cost for All! Adding a new link creates a new path p 3 =(a,e,d). The original flow distribution pattern is no longer an equilibrium pattern, since at this level of flow the cost on path p 3, C p3 =70. The new equilibrium flow pattern network is x * p1 = x * p2 = x p3* =2. The equilibrium path travel costs: C p1 = C p2 = C p3 = a c 1 e 4 b d c e (f e ) = f e


24 The 1968 Braess article has been translated from German to English and appears as On a Paradox of Traffic Planning by Braess, Nagurney, Wakolbinger in the November 2005 issue of Transportation Science.
25 If no such symmetry assumption holds for the user link costs functions, then the equilibrium conditions can no longer be reformulated as an associated optimization problem and the equilibrium conditions are formulated and solved as a variational inequality problem!
, Smith")
26 VI Formulation of TNE Dafermos (1980), Smith (1979)
27 A Geometric Interpretation of a Variational Inequality and a Projected Dynamical System Dupuis and Nagurney (1993) Nagurney and Zhang (1996) x 0
28 The variational inequality problem, contains, as special cases, such classical problems as: systems of equations optimization problems complementarity problems and is also closely related to fixed point problems. Hence, it is a unifying mathematical formulation for a variety of mathematical programming problems.
29 Transportation and Critical Infrastructure Networks
30 The TNE Paradigm is the Unifying Paradigm for Critical Infrastructure Problems: Transportation Networks the Internet Financial Networks Electric Power Supply Chains.
31 The TNE Paradigm can also capture multicriteria decision-making associated with sustainability. Decision-makers (manufacturers, retailers, and/or consumers) in multitiered networks may seek to: maximize profits minimize pollution (emissions/waste) minimize risk with individual weights associated with the different criteria.


32 Ironically, several of the critical infrastructure systems; in particular, transportation networks and electric power supply chains are also the dominant sources of emissions!
33 Data on Emissions Generated Electricity generation is the dominant industrial source of air emissions in the US today. Fossil fuel-based power plants are responsible for 67% of the nation s sulfur dioxide emissions, 23% of the nitrogen oxide emissions, and 40% of man-made carbon dioxide emissions (EPA). Electricity worldwide is produced mainly by using coal, which is responsible for 40% of the carbon dioxide pollution (and, hence, global warming). Coal is expected to maintain about 36% share of the electricity generation market through 2020 (IPCC). Motorists contribute the majority of the carbon dioxide emitted and about 75% of the nitrogen oxides in major population centers such as London. Road traffic is the fastest growing source of pollution in Europe. Increasing vehicular usage in China and India is also contributing significantly to worldwide emissions.
).")
34 Spatial Nature of Pollutants The impacts of pollutants (such as SO 2, NO x, and Hg) depend critically on the location of their sources and where their impacts are realized. There are noted traffic volumes of pollutants from Asia to North America as well as from North America to Europe (Akimoto (2003)). Pollutants released from Midwestern US power plants travel by winds toward the East Coast of the US and Canada (EPA).
35 The Equivalence of Supply Chains and Transportation Networks Nagurney, Transportation Research E (2006).
36 Nagurney, Ke, Cruz, Hancock, Southworth, Environment and Planning B (2002)
37 The fifth chapter of Beckmann, McGuire, and Winsten s book, Studies in the Economics of Transportation (1956) describes some unsolved problems including a single commodity network equilibrium problem that the authors imply could be generalized to capture electric power networks. Specifically, they asked whether electric power generation and distribution networks can be reformulated as transportation network equilibrium problems.

38 From:

39 Electric Power Supply Chains
40 The Electric Power Supply Chain Network Nagurney and Matsypura, Proceedings of the CCCT (2004).
41 The Transportation Network Equilibrium Reformulation of Electric Power Supply Chain Networks Electric Power Supply Transportation Chain Network Network Nagurney, Liu, Cojocaru, and Daniele, Transportation Research E (2007).
42 Electric Power Supply Chain Network with Fuel Suppliers Matsypura, Nagurney, and Liu, International Journal of Emerging Power Systems (2007).
43 In 1952, Copeland wondered whether money flows like water or electricity.
44 The Transportation Network Equilibrium Reformulation of the Financial Network Equilibrium Model with Intermediation Liu and Nagurney, Computational Management Science (2007).
45 We have shown that money as well as electricity flow like transportation and have answered questions posed fifty years ago by Copeland and by Beckmann, McGuire, and Winsten!
46 Some Interesting MCDM Applications to Sustainability
47 Papers where environmentally-based MCDM network problems have been transformed and solved using the TNE equivalences/relationships: Modelling Generator Power Plant Portfolios and Pollution Taxes in Electric Power Supply Chain Networks: A Transportation Network Equilibrium Transformation, Wu, Nagurney, Liu, and Stranlund, Transportation Research D (2006). Optimal Endogenous Carbon Taxes for Electric Power Supply Chains with Power Plants, Nagurney, Liu, and Woolley, Mathematical Modelling (2006). Sustainable Supply Chain Networks and Transportation, Nagurney, Liu, and Woolley, International Journal of Sustainable Transportation (2007). Spatially Differentiated Trade of Permits for Multipollutant Electric Power Supply Chains, Woolley, Nagurney, and Stranlund, presented at the INFORMS Puerto Rico Conference (2007). An Integrated Electric Power Supply Chain and Fuel Market Network Framework: Theoretical Modeling with Empirical Analysis for New England, Liu and Nagurney, INFORMS Seattle Meeting (2007).
48 Recent disasters have demonstrated the importance and the vulnerability of network systems. Examples: 9/11 Terrorist Attacks, September 11, 2001; The biggest blackout in North America, August 14, 2003; Two significant power outages in September one in the UK and the other in Italy and Switzerland; Hurricane Katrina, August 23, 2005; The Minneapolis I35 Bridge Collapse, August 1, 2007.

49
50 Recent Literature on Network Vulnerability Latora and Marchiori (2001, 2002, 2004) Holme, Kim, Yoon and Han (2002) Taylor and D este (2004) Murray-Tuite and Mahmassani (2004) Chassin and Posse (2005) Barrat, Barthélemy and Vespignani (2005) Sheffi (2005) Dall Asta, Barrat, Barthélemy and Vespignani (2006) Jenelius, Petersen and Mattson (2006) Taylor and D Este (2007)
51 Our Research on Network Efficiency, Vulnerability, and Robustness A Network Efficiency Measure for Congested Networks, Nagurney and Qiang, Europhysics Letters, 79, December (2007). A Transportation Network Efficiency Measure that Captures Flows, Behavior, and Costs with Applications to Network Component Importance Identification and Vulnerability, Nagurney and Qiang, Proceedings of the POMS 18th Annual Conference, Dallas, Texas (2007). A Network Efficiency Measure with Application to Critical Infrastructure Networks, Nagurney and Qiang, Journal of Global Optimization (2008), in press. Robustness of Transportation Networks Subject to Degradable Links, Nagurney and Qiang, Europhysics Letters, 80, December (2007). A Unified Network Performance Measure with Importance Identification and the Ranking of Network Components, Qiang and Nagurney, Optimization Letters (2008).
52 A New Network Performance/Efficiency Measure with Applications to Critical Infrastructure Networks
53 The Nagurney and Qiang (N-Q) Network Efficiency Measure The network performance/efficiency measure ε(g,d), for a given network topology G and fixed demand vector d, is defined as where n w is the number of O/D pairs in the network and λ w is the equilibrium disutility for O/D pair w. Nagurney and Qiang, Europhysics Letters, 79 (2007).
54 Importance of a Network Component Definition: Importance of a Network Component The importance, I(g), of a network component gεg is measured by the relative network efficiency drop after g is removed from the network: where G-g is the resulting network after component g is removed.
55 The Latora and Marchiori (L-M) Network Efficiency Measure Definition: The L-M Measure The network performance/efficiency measure, E(G) for a given network topology, G, is defined as: where n is the number of nodes in the network and d ij is the shortest path length between node i and node j.
56 The L-M Measure vs. the N-Q Measure Theorem: If positive demands exist for all pairs of nodes in the network, G, and each of demands is equal to 1, and if d ij is set equal to λ w, where w=(i,j), for all wεw, then the N- Q and L-M network efficiency measures are one and the same.
57 The Approach to Study the Importance of Network Components The elimination of a link is treated in the N-Q network efficiency measure by removing that link while the removal of a node is managed by removing the links entering and exiting that node. In the case that the removal results in no path connecting an O/D pair, we simply assign the demand for that O/D pair to an abstract path with a cost of infinity. Hence, our measure is well-defined even in the case of disconnected networks. The measure generalizes the Latora and Marchiori network measure for complex networks.
58 Example 1 Assume a network with two O/D pairs: w 1 =(1,2) and w 2 =(1,3) with demands: d w1 =100 and d w2 =20. 1 The paths are: for w 1, p 1 =a; for w 2, p 2 =b. a b The equilibrium path flows are: x p1* = 100, x p2* = c a (f a )=0.01f a +19 c b (f b )=0.05f b +19 The equilibrium path travel costs are: C =C =20. p 1 p2
59 Importance and Ranking of Links and Link Nodes Importance Value from Our Measure Importance Ranking from Our Measure a b Node Importance Value from Our Measure Importance Ranking from Our Measure

60 Example 2 The network is given by: w 1 =(1,20) w 2 =(1,19) d w1 = 100 d w2 = 100 From: Nagurney, Transportation Research B (1984)


61 Example 2: Link Cost Functions
62 Example 2: Importance and Ranking of Links
63 Example 2: Link Importance Rankings Importance Values Link
64 Example 3 Elastic Demand The network topology is the following: O/D pairs are: w 1 = (0,3), w 2 = (0,4) Link cost functions are: c a (f a )=f a, c b (f b )=f b, c c (f c )=f c, c d (f d )=f d, c e (f e )=f e, c f (f f )=f f Inverse demand functions are: λ w1 (d w1 ) = 100 d w1 λ w2 (d w2 ) = 40 d w2
65 Example 3: Importance and Rankings of Links
66 Example 3: Importance and Rankings of Nodes
67 The Advantages of the N-Q Network Efficiency Measure The measure captures demands, flows, costs, and behavior of users, in addition to network topology; The resulting importance definition of network components is applicable and well-defined even in the case of disconnected networks; It can be used to identify the importance (and ranking) of either nodes, or links, or both; and It can be applied to assess the efficiency/performance of a wide range of network systems. It is applicable also to elastic demand networks (Qiang and Nagurney, Optimization Letters (2008)). It has been extended to dynamic networks.
68 Motivation for Research on Transportation Network Robustness According to the ASCE: Poor maintenance, natural disasters, deterioration over time, as well as unforeseen attacks now lead to estimates of $94 billion in the US in terms of needed repairs for roads alone. Poor road conditions in the United States cost US motorists $54 billion in repairs and operating costs annually.
69 The focus of the robustness of networks (and complex networks) has been on the impact of different network measures when facing the removal of nodes on networks. We focus on the degradation of links through reductions in their capacities and the effects on the induced travel costs in the presence of known travel demands and different functional forms for the links.

70


71 Impacts of Climate Change on Transportation Infrastructure Examples from Alaska (Smith and Lavasseur)
72 According to the European Environment Agency (2004), since 1990 the annual number of extreme weather and climate related events has doubled, in comparison to the previous decade. These events account for approximately 80% of all economic losses caused by catastrophic events. In the course of climate change, catastrophic events are projected to occur more frequently (see Schulz (2007)). Schulz (2007) applied the Nagurney and Qiang (2007) network efficiency measure to a German highway system in order to identify the critical road elements and found that this measure provided more reasonable results than the measure of Taylor and D Este (2007).
73 Robustness in Engineering and Computer Science IEEE (1990) defined robustness as the degree to which a system of component can function correctly in the presence of invalid inputs or stressful environmental conditions. Gribble (2001) defined system robustness as the ability of a system to continue to operate correctly across a wide range of operational conditions, and to fail gracefully outside of that range. Schilllo et al. (2001) argued that robustness has to be studied in relation to some definition of the performance measure.
74 Robustness in Transportation Sakakibara et al. (2004) proposed a topological index. The authors considered a transportation network to be robust if it is dispersed in terms of the number of links connected to each node. Scott et al. (2005) examined transportation network robustness by analyzing the increase in the total network cost after removal of certain network components.
75 BPR Link Cost Functions We use the Bureau of Public Roads (BPR) link cost functional form in our transportation network robustness study, which is given by: where k and β are greater than zero and the u s are the practical capacities on the links.
76 A New Approach to Transportation Network Robustness
77 The Transportation Network Robustness Measure Nagurney and Qiang, Europhysics Letters, 80, December (2007)

78 Simple Example Assume a network with one O/D pair: w 1 =(1,2) with demand given by d w1 =10. The paths are: p 1 =a and p 2 =b. In the BPR link cost function, k=1 and β=4; t a0 =10 and t a0 =1. Assume that there are two sets of capacities: Capacity Set A, where u a =u b =50; Capacity Set B, where u a =50 and u b =10.
79
80 Example: Braess Network with BPR Functions Instead of using the original cost functions, we construct a set of BPR functions as below under which the Braess Paradox still occurs. The new demand is 110.
81 β= 1
82 β= 2
83 β= 3
84 β= 4
85 Some Theoretical Results a 1 2
86
87 What About Dynamic Networks?

88
89
) Nagurney, Parkes, and Daniele, Computational Management Science")
90 The Standard form of the EVI that we work with is: Theorem (Nagurney, Parkes, Daniele (2007)) Nagurney, Parkes, and Daniele, Computational Management Science (2007).
91 The Time-Dependent (Demand-Varying) Braess Paradox and Evolutionary Variational Inequalities
92 Recall the Braess Network where we add the link e. 2 c a 1 e 4 b d 3
93 The Solution of an Evolutionary (Time-Dependent) Variational Inequality for the Braess Network with Added Link (Path) Equilibrium Path Flow I II III Demand(t) = t Braess Network with Time-Dependent Demands Paths 1 and 2 Path 3
94 In Demand Regime I, only the new path is used. In Demand Regime II, the Addition of a New Link (Path) Makes Everyone Worse Off! In Demand Regime III, only the original paths are used. Cost of Used Paths I II III Network 1 Demand Network 2 Network 1 is the Original Braess Network - Network 2 has the added link.
95 The new link is NEVER used after a certain demand is reached even if the demand approaches infinity. Hence, in general, except for a limited range of demand, building the new link is a complete waste!
96 Extension of the Efficiency Measure to Dynamic Networks An Efficiency Measure for Dynamic Networks Modeled as Evolutionary Variational Inequalities with Applications to the Internet and Vulnerability Analysis, Nagurney and Qiang (2007).

97 Network Efficiency Measure for Dynamic Networks - Continuous Time The above measure is the average network performance over time of the dynamic network.

98 Network Efficiency Measure for Dynamic Networks - Discrete Time
 is the dynamic network efficiency after component g is")
99 Importance of a Network Component The importance of a network component g of network G with demand d over time horizon T is defined as follows: where ε(g-g,d,t) is the dynamic network efficiency after component g is removed.

100 Importance of Nodes and Links in the Dynamic Braess Network Using the N-Q Measure when T=10
101 Where Are We Now? An Integrated Electric Power Supply Chain and Fuel Market Network Framework: Theoretical Modeling with Empirical Analysis for New England, Liu and Nagurney (2007).
102 Empirical Case Study New England electric power market and fuel markets 82 generators who own and operate 573 power plants 5 types of fuels: natural gas, residual fuel oil, distillate fuel oil, jet fuel, and coal Ten regions (R=10): 1. Maine, 2. New Hampshire, 3. Vermont, 4. Connecticut(excluding Southwest Connecticut), 5. Southwest Connecticut(excluding Norwalk-Stamford area), 6. Norwalk-Stamford area, 7. Rhode Island, 8. Southeast Massachusetts, 9. West and Central Massachusetts, 10. Boston/Northeast Massachusetts Hourly demand/price data of July 2006 (24 31 = 744 scenarios) 6 blocks (L1 = 94 hours, and Lw = 130 hours; w = 2,..., 6)
103 The New England Electric Power Supply Chain Network with Fuel Suppliers
104 Predicted Prices vs. Actual Prices ($/Mwh)

105
106 Thank you! For more information, see The Virtual Center for Supernetworks