Draft Environmental Impact Report
|
|
|
- Ursula Harris
- 5 years ago
- Views:
Transcription
1 Pacific Pointe East Development Project Draft Environmental Impact Report SCH # April 2014
2 Draft Environmental Impact Report Pacific Pointe East Development Project Prepared by: Development Services 333 W. Ocean Boulevard, 5 th Floor Long Beach, California Contact: Mr. Craig Chalfant (562) Prepared with the assistance of: Rincon Consultants, Inc. 180 North Ashwood Avenue Ventura, California 93 (805) April 2014
3 This page intentionally left blank.
4 Pacific Pointe East Development Project EIR Table of Contents Pacific Pointe East Development Project EIR Table of Contents Page Executive Summary... ES Introduction 1.1 Environmental Impact Report Background Purpose and Legal Authority Scope and Content/Environmental Factors Potentially Affected Lead, Responsible and Trustee Agencies Environmental Review Process Project Description 2.1 Project Applicant Project Location Current Land Use and Regulatory Setting Project Characteristics Project Objectives Required Approvals Environmental Setting 3.1 Regional Setting Project Site Setting Cumulative Projects Setting Environmental Impact Analysis Aesthetics Air Quality Greenhouse Gas Emissions/Climate Change Noise Transportation and Traffic Other CEQA-Required Discussions Growth Inducement Irreversible Environmental Effects Alternatives No Project Reduced Intensity Alternative Alternative Site Alternative Environmentally Superior Alternative References and Report Preparers 7.1 References Report Preparers i
5 Pacific Pointe East Development Project EIR Table of Contents List of Figures Figure 1-1 CEQA Environmental Review Process Figure 2-1 Regional Location Figure 2-2 Aerial View of Project Site and Surrounding Uses Figure 2-3 Site Photographs Figure 2-4a Site Vicinity Photographs Figure 2-4b Site Vicinity Photographs Figure 2-5 Site Plan Figure Existing Industrial Development in the Project Vicinity Figure Building 9 Elevation Figure Building 10 Elevation Figure Building 11 Elevation Figure Long Beach Municipal Airport Noise Level Contours Figure Existing Weekday Volumes AM Figure Existing Weekday Volumes PM Figure Passenger Car Trip Distribution Figure Truck Trip Distribution Figure Project AM Peak Hour Trips Figure Project PM Peak Hour Trips Figure Existing Plus Project AM Peak Hour Traffic Volumes Figure Existing Plus Project PM Peak Hour Traffic Volumes Figure Project Access and Circulation Plan Figure Cumulative Projects AM Peak Hour Traffic Volumes Figure Cumulative Projects PM Peak Hour Traffic Volumes Figure Cumulative Plus Project AM Peak Hour Traffic Volumes Figure Cumulative Plus Project PM Peak Hour Traffic Volumes List of Tables Table ES-1 Table ES-2 Project Summary... ES-2 Summary of Environmental Impacts, Mitigation Measures and Residual Impacts... ES-3 Table 1-1 NOP Response Issues Table 2-1 Existing Site Characteristics Table 3-1 Planned and Pending Projects Table Current Federal and State Ambient Air Quality Standards Table Ambient Air Quality Data Table SCAQMD LSTs for Emissions in SRA Table Estimated Construction Maximum Daily Air Pollutant Emissions Table Long-Term Operational Emissions Table Estimated Construction Emissions of Greenhouse Gases Table Estimated Annual Area Source Greenhouse Gas Emissions Table Estimated Annual Energy-Related Greenhouse Gas Emissions Table Estimated Annual Solid Waste Greenhouse Gas Emissions Table Estimated Greenhouse Gas Emissions from Water Use Table Estimated Annual Mobile Emissions of Greenhouse Gases Table Combined Annual Emissions of Greenhouse Gases ii
6 Pacific Pointe East Development Project EIR Table of Contents Table Project Consistency with Applicable Climate Action Team Greenhouse Gas Emission Reduction Strategies Table Project Consistency with Applicable SCAG SCS Greenhouse Gas Emission Reduction Strategies Table Project Consistency with Applicable Long Beach Sustainable City Action Plan Goals Table Interior Noise Level Standards Table General Plan Noise Level Standards Table Existing Traffic-Generated Noise Table Noise Impact Criteria Table Construction Noise Levels at the Nearest Noise-Sensitive Receptor Table Pre-Project and Post-Project Traffic Noise Impacts Table Level of Service Definitions Table Existing (Weekday) Intersection Peak Hour Levels of Service Summary Table Project Trip Generation Forecast Table Existing Plus Project Peak Hour Intersection Capacity Analysis Table Project Driveway Capacity Analysis Table Cumulative Peak Hour Intersection Capacity Analysis Table 6-1 Comparison of Project Alternatives Buildout Characteristics Table 6-2 Comparison of Environmental Impacts of Alternatives Appendices Appendix A Appendix B Appendix C Initial Study, Notice of Preparation (NOP) and NOP Comment Letters CalEEMod Emissions Modeling Traffic Study iii
7 Pacific Pointe East Development Project EIR Table of Contents This page intentionally left blank. iv
8 Pacific Pointe East Development Project EIR Executive Summary EXECUTIVE SUMMARY This section summarizes the characteristics of the proposed project, and the environmental impacts, mitigation measures, and residual impacts associated with the proposed project. PROJECT SYNOPSIS Project Applicant DP3 Hangars, LLC Bardeen Avenue Irvine, California Phone: (949) Project Description This Environmental Impact Report (EIR) has been prepared to examine the potential environmental effects of the proposed Pacific Point East Development Project. The following is a summary of the full project description, which may be found in Section 2.0 Project Description. The proposed Pacific Pointe East development is located on an unaddressed, approximately 25- acre parcel at the southeast corner of Lakewood Boulevard and Conant Street near the Long Beach Airport, with a Los Angeles County Assessor s ID Number of As shown in Figure 3, the proposed project involves three new industrial buildings on a site that is currently developed with a paved surface parking lot. These buildings have an open floor plan and would be intended for light industrial, light manufacturing, warehouse, office, and/or research & development land uses. The three buildings would have a maximum height of about 41 feet and total floor area of 494,000 square feet, broken down as follows: Building 9 144,000 sq. ft. of building area on a 306,399 square foot (sq. ft.) site Building ,000 sq. ft. of building area on a 233,538 sq. ft. site Building ,000 sq. ft. of building area on a 541,098 sq. ft. site A total of 722 parking spaces are proposed, including 221 spaces for Building 9, 156 spaces for Building 10, and 345 spaces for Building 11. The project site is located in the Douglas Aircraft Planned Development District (PD-19), which allows a range of uses but limits total peak period (4-6 PM) vehicle trips to and from the district to 5,503. In addition, development within PD-19 must not have significant effects on neighboring residences, significant effects on visual resources, or significant safety and security effects. ES-1
9 Pacific Pointe East Development Project EIR Executive Summary Land Use Table ES-1 Project Summary Size (square feet) Quantity Industrial Buildings 494,000 3 buildings Parking Spaces n/a 722 spaces Implementation of the project would require the following discretionary approvals from the : Site Plan Review and Approval Consistent with City Ordinance ORD , the applicant is required to submit a Site Plan for Planning Commission approval. ALTERNATIVES Three alternatives to the proposed project were selected for consideration as follows: Alternative 1: No Project (no three new light industrial buildings with associated improvements) Alternative 2: Reduced Intensity Alternative 3: Alternate Site The Reduced Intensity Alternative would reduce all of the project s less than significant environmental effects, and is therefore considered environmentally superior overall. SUMMARY OF IMPACTS AND MITIGATION MEASURES Table ES-2 includes a brief description of the environmental issues relative to the proposed project, the identified environmental impacts, proposed mitigation measures, and residual impacts (the impact after application of mitigation, if any). Impacts are categorized by classes. Class I impacts are defined as significant, unavoidable adverse impacts which require a statement of overriding considerations to be issued per Section of the State CEQA Guidelines if the project is approved. Class II impacts are significant adverse impacts that can be feasibly mitigated to less than significant levels and which require findings to be made under Section of the State CEQA Guidelines. Class III impacts are considered less than significant impacts. ES-2
10 Pacific Pointe East Development Project EIR Executive Summary AESTHETICS Table ES-2 Summary of Environmental Impacts, Mitigation Measures, and Residual Impacts Impact Mitigation Measures Residual Impact Impact AES-1 The proposed project would involve replacing the existing surface parking lot with three industrial structures a maximum height of 41 feet. Because the project would not adversely affect any scenic views and would be visually compatible with the industrial character of the area, its impact would be Class III, less than significant. Impact AES-2. The proposed project would not conflict with adopted policies of the City of Long Beach related to aesthetics, and would therefore produce a Class III, less than significant, impact. AIR QUALITY Impact AQ-1. Onsite construction activity would generate air pollutant emissions, but construction-related emissions would not exceed SCAQMD thresholds for any criteria pollutant. Therefore, impacts would be Class III, less than significant. Impact AQ-2. Operation of the proposed facilities project would generate air pollutant emissions in the long-term. However, emissions would not exceed SCAQMD operational significance thresholds for any criteria pollutants. Therefore, operational air quality impacts would be Class III, less than significant. None required None required None required None required Less than significant Less than significant Less than significant Less than significant GREENHOUSE GAS EMISSIONS Impact GHG-1. Development that could potentially occur under the proposed project would generate additional GHG emissions beyond existing conditions. However, GHG emissions generated would not exceed proposed SCAQMD significance thresholds. Impacts would therefore be Class III, less than significant. Impact GHG-2. The proposed project would be consistent with the Climate Action Team GHG reduction strategies and the SCAG Sustainable Communities Strategy. Impacts related to consistency with None required None required Less than significant Less than significant ES-3
11 Pacific Pointe East Development Project EIR Executive Summary Table ES-2 Summary of Environmental Impacts, Mitigation Measures, and Residual Impacts Impact Mitigation Measures Residual Impact GHG plans and policies would therefore be Class III, less than significant. NOISE Impact N-1. Construction-related activities associated with the proposed project would intermittently generate high noise levels and groundborne vibration on and adjacent to the site. However, construction noise would be temporary and subject to restrictions established in the Municipal Code. Therefore, impacts would be Class III, less than significant. Impact N-2. Onsite operations would generate noise levels that may periodically be audible to existing land uses near and within the project area. However, operational noise is not expected to exceed City noise standards or thresholds. This is a Class III, less than significant impact. Impact N-3. Aircraft associated with nearby airports would periodically generate noise that would be audible at the project site. However, aircraft noise would not exceed City interior noise standards. This is a Class III, less than significant impact. TRAFFIC AND TRANSPORTATION Impact T-1. Implementation of the proposed project would increase traffic on the surrounding network, but would not cause any intersection to exceed the City s LOS standard or conflict with the County CMP. Impacts associated with the proposed project would be Class III, less than significant. Impact T-2. The proposed project does not include any hazardous design feature and would not result in inadequate emergency access. Impacts associated with the proposed project would be Class III, less than significant. None required None required None required None required None required Less than significant Less than significant Less than significant Less than significant Less than significant ES-4
12 Pacific Pointe East Development Project EIR Section 1.0 Introduction 1.0 INTRODUCTION This document is a Draft Environmental Impact Report (EIR) for the proposed Pacific Pointe East Development Project, located in the, County of Los Angeles. For the purposes of this analysis, the Pacific Pointe East Development Project refers to the development scenario proposed by DP3 Hangars, LLC, for the entire 25-acre site, as detailed in Section 2.0, Project Description. This section describes: (1) the purpose and legal authority of the EIR; (2) the general background of the project; (3) the scope and content of the EIR; (4) lead, responsible, and trustee agencies; (5) the environmental review process required under the California Environmental Quality Act (CEQA); and (6) areas of known public controversy. 1.1 ENVIRONMENTAL IMPACT REPORT BACKGROUND A Notice of Preparation (NOP) of an environmental impact report was prepared for the proposed project and distributed for agency and public review for the required 30-day review period on January 22, Five written responses to the NOP were received (including the State Clearinghouse letter confirming receipt of the NOP). The NOP is presented in Appendix A, along with the Initial Study that was prepared for the project and the NOP responses received. The intent of the NOP was to provide interested individuals, groups, public agencies and others a forum to provide input to the City regarding scope and focus of the EIR. Table 1-1 lists the issues relevant to the EIR that were brought up in the NOP written comments and the EIR sections where the issues are addressed. Table 1-1 NOP Response Issues Issue Caltrans traffic study requirements South Coast Air Quality Management District air quality analysis requirements Los Angeles County Sanitation District wastewater permit and requirements Los Angeles County Fire Department statutory responsibilities How Addressed Section 4.5, Transportation and Traffic Section 4.2, Air Quality Initial Study Initial Study 1.2 PURPOSE AND LEGAL AUTHORITY The proposed project requires the discretionary approval of the. Therefore, it is subject to the requirements of CEQA. In accordance with Section of the CEQA Guidelines, the purpose of this EIR is to serve as an informational document that:...will inform public agency decision-makers and the public generally of the significant environmental effects of a project, identify possible ways to minimize the significant effects, and describe reasonable alternatives to the project. 1-1
13 Pacific Pointe East Development Project EIR Section 1.0 Introduction This EIR has been prepared as a Project EIR pursuant to Section of the CEQA Guidelines. A Project EIR is appropriate for a specific development project. As stated in the CEQA Guidelines: This type of EIR should focus primarily on the changes in the environment that would result from the development project. The EIR shall examine all phases of the project, including planning, construction, and operation. This EIR is to serve as an informational document for the public and decision-makers. The process will culminate with a Planning Commission hearing to consider certification of the Final EIR and approval of the project, unless the Planning Commission s decision is appealed to the City Council, in which case the process would culminate with a City Council hearing to consider certification of the Final EIR and approval of the project. 1.3 SCOPE AND CONTENT/ENVIRONMENTAL FACTORS POTENTIALLY AFFECTED This EIR addresses the issues determined to be potentially significant by the. The issues addressed in this EIR include: Aesthetics Air Quality Greenhouse Gas Emissions Noise Transportation and Traffic This EIR addresses the issues referenced above and identifies the potentially significant environmental impacts, including site-specific and cumulative effects of the project, in accordance with the provisions set forth in the CEQA Guidelines. In addition, the EIR recommends feasible mitigation measures, where possible, that would reduce or eliminate adverse environmental effects. In preparing the EIR, use was made of pertinent City policies and guidelines, certified EIRs and adopted CEQA documents, and background documents prepared by the City. A full reference list is contained in Section 7.0, References and Report Preparers. The Alternatives Section of the EIR (Section 6.0) was prepared in accordance with Section of the CEQA Guidelines. The alternatives discussion evaluates the CEQA-required no project alternative and two alternative development scenarios for the site. It also identifies the environmentally superior alternative among the alternatives assessed. The level of detail contained throughout this EIR is consistent with the requirements of CEQA and applicable court decisions. The CEQA Guidelines provide the standard of adequacy on which this document is based. CEQA Guidelines Section states: An EIR should be prepared with a sufficient degree of analysis to provide decision-makers with information which enables them to make a decision which intelligently takes account of environmental consequences. An evaluation of the environmental effects of the 1-2
14 Pacific Pointe East Development Project EIR Section 1.0 Introduction proposed project need not be exhaustive, but the sufficiency of an EIR is to be reviewed in light of what is reasonably feasible. Disagreement among experts does not make an EIR inadequate, but the EIR should summarize the main points of disagreement among the experts. The courts have looked not for perfection, but for adequacy, completeness, and a good faith effort at full disclosure. 1.4 LEAD, RESPONSIBLE, AND TRUSTEE AGENCIES The CEQA Guidelines define lead, responsible and trustee agencies. The is the lead agency for the project because it holds principal responsibility for approving this EIR. A responsible agency refers to a public agency other than the lead agency that has discretionary approval over the project. There are no responsible agencies for the project. A trustee agency refers to a state agency having jurisdiction by law over natural resources affected by a project. There are no trustee agencies for the proposed project. 1.5 ENVIRONMENTAL REVIEW PROCESS The major steps in the environmental review process, as required under CEQA, are outlined below and illustrated on Figure 1-1. The steps are presented in sequential order. 1. Notice of Preparation (NOP). After deciding that an EIR is required, the lead agency must file an NOP soliciting input on the EIR scope to the State Clearinghouse, other concerned agencies, and parties previously requesting notice in writing (CEQA Guidelines Section 15082; Public Resources Code Section ). The NOP must be posted in the County Clerk s office for 30 days. The NOP may be accompanied by an Initial Study that identifies the issue areas for which the proposed project could create significant environmental impacts. 2. Draft Environmental Impact Report (DEIR) Prepared. The DEIR must contain: a) table of contents or index; b) summary; c) project description; d) environmental setting; e) discussion of significant impacts (direct, indirect, cumulative, growth-inducing and unavoidable impacts); f) a discussion of alternatives; g) mitigation measures; and, h) discussion of irreversible changes. 3. Notice of Completion and Notice of Availability. A lead agency must file a Notice of Completion with the State Clearinghouse when it completes a Draft EIR (CEQA Guidelines Section 15085) and prepare a Public Notice of Availability of a Draft EIR. The lead agency must file the Notice of Availability with the County Clerk s office for a 30 day posting period and send a copy of the Notice of Availability to anyone requesting it (CEQA Guidelines Section 15087). Additionally, public notice of DEIR availability must be given through at least one of the following procedures: a) publication in a newspaper of general circulation; b) posting on and off the project site; and c) direct mailing to owners and occupants of contiguous properties. The lead agency must solicit input from other agencies and the public, and respond in writing to all comments received (PRC Sections and 21153). The minimum public review period for a DEIR is 30 days. When a Draft EIR is sent to the State Clearinghouse for review, the public review period must be 45 days unless the Clearinghouse (Public Resources Code Section 21091) approves a shorter period. 1-3
15 Pacific Pointe East Development Project EIR Section 1.0 Introduction City prepares Initial Study City sends Notice of Preparation (NOP) to responsible agencies City solicits input from Agencies & Public on the content of the Draft EIR City prepares Draft EIR CityfilesNoticeofCompletionandgives public notice of availability of Draft EIR Public Review Period (45 day minimum) City solicits comment from Agencies & Public on the adequacy of the Draft EIR City prepares Final EIR, including responses to comments on the Draft EIR Responsible Agency decision-making bodies consider the Final EIR City prepares required CEQA findings City makes a decision on the project City files Notice of Determination with County Clerk Environmental Review Process Figure 1-1
16 Pacific Pointe East Development Project EIR Section 1.0 Introduction 4. Final EIR. A Final EIR (FEIR) must include: a) the Draft EIR; b) copies of comments received during public review; c) list of persons and entities commenting; and, d) responses to comments. 5. Certification of FEIR. Prior to making a decision on a proposed project, the lead agency must certify that: a) the FEIR has been completed in compliance with CEQA; b) the FEIR was presented to the decision-making body of the lead agency; and, c) the decision-making body reviewed and considered the information in the FElR prior to approving a project (CEQA Guidelines Section 15090). 6. Lead Agency Project Decision. A lead agency may: a) disapprove a project because of its significant environmental effects; b) require changes to a project to reduce or avoid significant environmental effects; or, c) approve a project despite its significant environmental effects, if the proper findings and statement of overriding considerations are adopted (CEQA Guidelines Sections and 15043). 7. Findings/Statement of Overriding Considerations. For each significant impact of the project identified in the EIR, the lead or responsible agency must find, based on substantial evidence, that either: a) the project has been changed to avoid or substantially reduce the magnitude of the impact; b) changes to the project are within another agency's jurisdiction and such changes have or should be adopted; or c) specific economic, social, or other considerations make the mitigation measures or project alternatives infeasible (CEQA Guidelines Section 15091). If an agency approves a project with unavoidable significant environmental effects, it must prepare a written Statement of Overriding Considerations that sets forth the specific social, economic, or other reasons supporting the agency's decision. 8. Mitigation Monitoring Reporting Program. When an agency makes findings on significant effects identified in the EIR, it must adopt a reporting or monitoring program for mitigation measures that were adopted or made conditions of project approval to mitigate significant effects. 9. Notice of Determination. An agency must file a Notice of Determination within five working days after deciding to approve a project for which an EIR is prepared (CEQA Guidelines Section 15094). A local agency must file the Notice with the County Clerk. The Notice must be posted for 30 days and sent to anyone previously requesting notice. Posting of the Notice starts a 30-day statute of limitations on CEQA legal challenges [Public Resources Code Section 21167(c)]. 1-5
17 Pacific Pointe East Development Project EIR Section 1.0 Introduction This page intentionally left blank. 1-6
18 Pacific Pointe East Development Project EIR Section 2.0 Project Description 2.0 PROJECT DESCRIPTION The proposed project would involve construction of three new industrial buildings on a site that is currently developed with a paved surface parking lot. The new buildings would have an open floor plan and would be intended for light industrial, light manufacturing, warehouse, office, and/or research & development land uses. They would have a maximum height of about 41 feet and total floor area of 494,000 square feet, broken down as follows: Building 9: 144,000 sq. ft. of building area on a 306,399 square foot (sq. ft.) site Building 10: 118,000 sq. ft. of building area on a 233,538 sq. ft. site Building 11: 232,000 sq. ft. of building area on a 541,098 sq. ft. site A total of 722 parking spaces are proposed, including 221 spaces for Building 9, 156 spaces for Building 10, and 345 spaces for Building 11.This section describes the project location, major characteristics of the site and the proposed development, project objectives, and approvals needed to implement the project. 2.1 PROJECT APPLICANT DP3 Hangars, LLC Bardeen Avenue Irvine, California Phone: (949) PROJECT LOCATION The proposed Pacific Pointe East development is located on an unaddressed, approximately 25- acre parcel at the southeast corner of Lakewood Boulevard and Conant Street near the Long Beach Airport in the, County of Los Angeles. The property is located in the Douglas Aircraft Planned Development District (PD-19). Conant Street runs along the northern boundary of the site, Lakewood Boulevard runs along the western boundary of the site, the Skylinks at Long Beach Golf Course borders the site to its south, and two office buildings border the site to its east. As shown on Figure 2-1 (Regional Location), the project site is located in northern central Long Beach, just northeast of the Long Beach Airport. The site is regionally accessible from Interstate 405 (the San Diego Freeway), and State Route 19 (Lakewood Boulevard). Figure 2-2 presents an aerial view of the project site and surrounding uses. Figure 2-3 provides street-level photographs of the site, and Figures 2-4(a) and 2-4(b) provide streetlevel photographs of nearby land uses. 2-1


19 Pacific Pointe East Development Project EIR Section 2.0 Project Description ^_ ±^_ Project Location Miles Imagery provided by ESRI and its licensors P A C I F I C OC E A N Regional Location Figure 2-1


20 Pacific Pointe East Development Project EIR Section 2.0 Project Description E Centralia St Lakewood Golf Course ST 19 E Harvey Way Bellflower Blvd Carson St Carson St Heartwell Park Cover St N Lakewood Blvd Faculty Ave E Conant St Stearnlee Ave Skylinks Golf Course J^ Long Beach Airport E Wardlow Rd ST 19 Clark Ave N Bellflower Blvd E Spring St Project Boundary ,600 Feet ± 405 E 28Th St Imagery provided by ESRI and its licensors Aerial View of Project Site and Surrounding Uses Figure 2-2


21 Pacific Pointe East Development Project EIR Section 2.0 Project Description Photo 1: Project site from eastern end looking west. Photo 2: Looking east down Conant Street from western end of project site. Site Photographs Figure 2-3


22 Pacific Pointe East Development Project EIR Section 2.0 Project Description Photo 1: Looking west towards airport-adjacent commercial development through the intersection of Conant Street and Lakewood Boulevard. Photo 2: DC Jets building. Site Vicinity Photographs Figure 2-4a

23 Pacific Pointe East Development Project EIR Section 2.0 Project Description Photo 3: Long Beach City College office. Photo 4: Long Beach City College Veteran s Memorial Stadium from eastern end of project site. Site Vicinity Photographs Figure 2-4b
24 Pacific Pointe East Development Project EIR Section 2.0 Project Description 2.3 CURRENT LAND USE AND REGULATORY SETTING Table 2-1 summarizes the existing characteristics of the project site, which are also described below. Assessor s Parcel Number Table 2-1 Existing Site Characteristics Site Size General Plan Land Use Designations 25 gross acres Mixed Use (LUD No. 7) Zoning Designations PD-19, Douglas Aircraft Planned Development District Current Use and Development Surrounding Land Use Designations Surrounding Zoning Designations Regional Access Local Access Surface parking lot North: Mixed Use (LUD 7), Institutional and School (LUD 10) East: Mixed Use (LUD 7) South: Open Space and Park (LUD 11) West: Harbor/Airport (LUD 12), Mixed Use (LUD 7) North: Douglas Aircraft Planned Development (PD-19), Institutional (I) East, Douglas Aircraft Planned Development (PD-19) South: Park (P) West: General Industrial (IG), Douglas Park South Planned Development (PD-32), Sub-Area 7 Interstate 405 (San Diego Freeway), and State Route 19 (Lakewood Boulevard) Conant Street, Lakewood Boulevard, Water: Long Beach Water Department Sewer: Long Beach Water Department Public Services Fire: Long Beach Fire Department Police: Police Department Current Land Use The project site is roughly rectangular, generally flat, and is approximately 25 acres in size. The site is currently developed with a surface parking lot which previously served the Long Beach Airport. Current zoning no longer allows the lot to be used for paid parking. The project site is within the City s Douglas Aircraft Planned Development District (PD-19). 2-7
25 Pacific Pointe East Development Project EIR Section 2.0 Project Description Surrounding Land Uses The project site is surrounded by a variety of land uses, including the following. The Skylinks at Long Beach Golf Course is located to the south of the site. Long Beach Airport is located to the southwest of the site, with airport buildings approximately 650 feet south of the site and airport runways approximately 450 feet southwest of the site. West of the project site, the land on either side of Conant Street west of Lakewood Boulevard is within the City s Douglas Park South Planned Development District (PD-32), and is partially developed with commercial, office, and light industrial buildings in an office park setting, with the remainder of this area being vacant lots that have not yet been developed. Directly north of the project site across Conant Street, the land west of Faculty Avenue is occupied by a former DC Jets factory currently owned by the applicant. East of Faculty Avenue, the land north of Conant Street across from the project site is occupied by surface parking lots on the campus of Long Beach City College. Office buildings associated with the College are located to the northeast and east of the project site on both sides of Conant Street. Rosie the Riveter Park and Interpretive Center is located immediately to the east of these buildings on the southeast corner of Conant Street and Clark Avenue Land Use Regulatory Overview The project site is located in the Douglas Aircraft Planned Development District (PD-19) and has a General Plan land use designation of Mixed Use (LUD No. 7). Properties within the PD-19 District are subject to City regulations governing development within the District, contained in City Ordinance No The proposed project would require design review to ensure that it complies with the requirements of the PD-19 district and other applicable land use regulations. The Initial Study (Appendix A) found that, upon completion of City review for compliance with the requirements of the PD-19 district, land use plan consistency impacts would be less than significant, and further analysis of this issue in an EIR is not warranted. However, relevant land use policies, regulations, guidelines, and standards, including those of the PD-19 District, are discussed in sections of the Initial Study and this EIR relevant to their respective issue areas, as applicable. 2.4 PROJECT CHARACTERISTICS Proposed Land Uses and Development The proposed project would involve construction of three new industrial buildings on the project site. The new buildings would have an open floor plan and would be intended for light industrial, light manufacturing, warehouse, office, and/or research & development land uses. Figure 2-5 shows the proposed site plan, including a summary of key statistics related to the proposed buildings and other proposed site characteristics, and. The three buildings would have a maximum height of about 41 feet and total floor area of 494,000 square feet. A total of 722 parking spaces are proposed, including 221 spaces for Building 9, 156 spaces for Building 10, and 345 spaces for Building
26 Pacific Pointe East Development Project EIR Section 2.0 Project Description SITE AREA Acres Acres SF 1,081,035 SF TOTAL BUILDING AREA 494,000 SF FLOOR AREA RATIO (FAR) 45.7% TOTAL PARKING 1/ STALLS TOTAL PARKING PROVIDED 722 STALLS PARKING RATIO / / Scale in Feet BUILDING DESCRIPTION BUILDING 9 BUILDING 10 BUILDING 11 TOTALS SITE AREA Acres SF 306, , ,098 1,081,035 FAR 47.0% 50.5% 42.9% 45.7% BUILDING AREA 1ST FLOOR - Industrial 129, , , ,000 2ND FLOOR - Office 15,000 15,000 20,000 50,000 TOTALS 144, , , ,000 PARKING 1/ PARKING 1.5/ PARKING PROVIDED PARKING RATIO Source: Pacific Pointe East, November 22, Site Plan Figure 2-5
27 Pacific Pointe East Development Project EIR Section 2.0 Project Description Vehicular access to the project site would be from Conant Street into four proposed on-site driveways. Sidewalks already exist along Conant Street in front of the project site, as well as along Lakewood Boulevard bordering the project site. Primary pedestrian access to the site would from these sidewalks into the project site at the proposed driveway locations on Conant Street. As shown on Figure 2-5, each proposed building would also be surrounded, except at the rear loading docks, by sidewalks for pedestrian access into the buildings Site Preparation and Construction The proposed project would involve demolition of the existing surface parking lot and construction of the proposed industrial buildings. No excavation or cut and fill would be required to prepare the site for construction, but minor grading may be required. Other site preparation activities would include utility and infrastructure improvements, paving, and landscaping. Construction is anticipated to begin in August 2014 and last approximately 12 months. 2.5 PROJECT OBJECTIVES The objectives of the proposed project are the following: Develop the project site with new industrial buildings in order to attract tenants in the light industrial, light manufacturing, warehouse, office, and/or research & development industries. Facilitate the construction of light industrial uses on the site in order to help develop the site in accordance with land uses called for under the PD-19, Douglas Aircraft Planned Development District. Utilize design elements that will project a high-quality professional image while focusing on sustainability and energy conservation. Provide employment opportunities. Promote business by attracting quality companies. Implement a project that will provide the latest design, materials, and operational methods to promote sustainability, energy, and water conservation and healthy workplaces. Enhance the City s tax base. 2.6 REQUIRED APPROVALS Implementation of the proposed Pacific Pointe East Development Project would require the following discretionary approval from the, which is the lead agency and the only public agency with discretionary approval over the project.: Site Plan Review and Approval Consistent with City Ordinance ORD , the applicant is required to submit a Site Plan for Planning Commission approval. 2-11
28 Pacific Pointe East Development Project EIR Section 2.0 Project Description This page intentionally left blank. 2-12
29 Pacific Pointe East Development Project EIR Section 3.0 Environmental Setting 3.1 REGIONAL SETTING 3.0 ENVIRONMENTAL SETTING The project site is located in the, in southern Los Angeles County, within the greater Los Angeles metropolitan area (refer to Figure 2-1, Regional Location, and Figure 2-2, Project Vicinity, both of which can be found in Section 2.0, Project Description). Long Beach is approximately 20 miles south of downtown Los Angeles and is located adjacent to the Pacific Ocean. The total area of the City is approximately 33,908 acres (53 square miles). Developed land comprises approximately 98.6% of Long Beach and about 473 acres, or 1.4%, of the City is undeveloped. Water-covered areas and miscellaneous land uses account for the remaining land. The Mediterranean climate of the region and coastal influence produce moderate temperatures year round, with rainfall concentrated in the winter months. The region is subject to various natural hazards, including earthquakes, tsunami and flooding. 3.2 PROJECT SITE SETTING The project site is located on a single, unaddressed, roughly rectangular, approximately 25-acre parcel at the southeast corner of Lakewood Boulevard and Conant Street immediately west of the Long Beach Airport. The property is located in the Douglas Aircraft Planned Development District (PD-19). The project site is currently developed with a surface parking lot, and has flat topography. Conant Street runs along the northern boundary of the site, Lakewood Boulevard runs along the western boundary of the site, the Skylinks at Long Beach Golf Course borders the site to its south, and two office buildings border the site to its east. Currently, vehicular and pedestrian access to the project site is available from Conant Street. Beyond the uses immediately bordering the project site mentioned above, prevailing uses in the vicinity of the project site are the following. The Long Beach Airport and commercial development west of Lakewood Boulevard and south of Carson Street are located to the west of the project site. To the north is the former DC Jets factory and Long Beach City College. To the east are the Rosie the Riveter Park and Interpretive Center and residential neighborhoods east of Clark Avenue. The Skylinks at Long Beach Gold Course stretches for about a mile to the south of the project site. Photos of the project site and surrounding uses are shown in Figure 2-3, Figure 2-4a, and Figure 2-4b. 3.3 CUMULATIVE PROJECTS SETTING CEQA defines cumulative impacts as two or more individual events that, when considered together, are considerable or will compound other environmental impacts. Cumulative impacts are the changes in the environment that result from the incremental impact of development of the proposed project and other nearby projects. For example, traffic impacts of two nearby projects may be insignificant when analyzed separately, but could have a significant impact when analyzed together. Cumulative impact analysis allows the EIR to provide a reasonable forecast of future environmental conditions and can more accurately gauge the effects of a series of projects. 3-1
30 Pacific Pointe East Development Project EIR Section 3.0 Environmental Setting Cumulative impacts are discussed within each of the specific impact analysis discussions in Section 4.0, Environmental Impact Analysis. Section of the CEQA Guidelines states that an adequate discussion of cumulative impacts should include either a list of past, present, and probable future projects producing related or cumulative impacts; or a summary of projections contained in an adopted local, regional or statewide plan, or related planning document, that describes or evaluates conditions contributing to the cumulative effect. The cumulative analysis in this EIR uses the following list of planned and pending projects in the general area, including parts of neighboring jurisdictions, obtained from the Planning Departments of the City of Long Beach and the City of Lakewood in February The projects on this list consist of various forms of commercial development, either in the form of new construction or renovation of existing space, totaling 1,236,619 square feet (sf) of development. 1,064,615 sf, or 86%, of this development is accounted for by the proposed renovation of existing buildings included in the Mercedes Benz West Coast Campus project, which is located across Conant Street from the project site. Table 3-1 Planned and Pending Projects Related Project Address Jurisdiction Description/Size Building 8 at Pacific Pointe South Urbana Medical Office Development Mercedes Benz West Coast Campus 3865 Lakewood Boulevard Long Beach 3824 Schaufele Avenue Long Beach 3860 Lakewood Boulevard Long Beach 58,645 SF of industrial/warehouse space 91,560 SF of medical office space within two (2) buildings Renovation of 1,064,615 SF of existing warehouse space to accommodate: Vehicle Preparation Center (VPC) 45,745 SF /100 staff Learning and Performance Center (LPC) 48,140 SF/ 40 staff Regional Office (Western Region) 50 staff within 8,358 SF Classic Car Center 30 staff City of Lakewood Chuck E. Cheese 5151 Lakewood Boulevard Lakewood 2,000 SF expansion Applebee s 4935 Graywood Avenue Lakewood 5,757 SF restaurant Gymnasium 4007 Paramount Boulevard, #109 Lakewood 4,488 SF gymnasium YMCA 5835 Carson Street Lakewood 9,554 SF gymnasium Total 1,236,619 SF Source: Planning Department, February 2014 City of Lakewood Planning Department, February 2014 SF = Square-Feet 3-2
31 Pacific Pointe East Development Project EIR Section 4.0 Environmental Impact Analysis 4.0 ENVIRONMENTAL IMPACT ANALYSIS This section discusses the possible environmental effects of the proposed project for the specific issue areas that were identified through the Initial Study and NOP process as having the potential to experience significant impacts. Significant effect is defined by the State CEQA Guidelines as a substantial, or potentially substantial, adverse change in any of the physical conditions within the area affected by the project including land, air, water, minerals, flora, fauna, ambient noise, and objects of historic or aesthetic significance. An economic or social change by itself shall not be considered a significant effect on the environment, but may be considered in determining whether the physical change is significant. The assessment of each issue area begins with a discussion of the setting relevant to that issue area. Following the setting is a discussion of the project s impacts relative to the issue area. Within the impact analysis, the first subsection identifies the methodologies used and the significance thresholds, which are those criteria adopted by the City, other agencies, universally recognized, or developed specifically for this analysis to determine whether potential impacts are significant. The next subsection describes each impact of the proposed project, mitigation measures for significant impacts, and the level of significance after mitigation. Each impact under consideration for an issue area is separately listed in bold text, with the discussion of the impact and its significance following. Each bolded impact listing also contains a statement of the significance determination for the environmental impact as follows: Class I, Significant and Unavoidable: An impact that cannot be reduced to below the threshold level given reasonably available and feasible mitigation measures. Such an impact requires a Statement of Overriding Considerations to be issued if the project is approved. Class II, Significant but Mitigable: An impact that can be reduced to below the threshold level given reasonably available and feasible mitigation measures. Such an impact requires findings to be made. Class III, Not Significant: An impact that may be adverse, but does not exceed the threshold levels and does not require mitigation measures. However, mitigation measures that could further lessen the environmental effect may be suggested if readily available and easily achievable. Class IV, Beneficial: An impact that would reduce existing environmental problems or hazards. Following each environmental impact discussion is a listing of recommended mitigation measures (if required) and the residual effects or level of significance remaining after the implementation of the measures. In those cases where the mitigation measure for an impact could have a significant environmental impact in another issue area, this impact is discussed as a residual effect. The impact analysis concludes with a discussion of cumulative effects, which evaluates the impacts associated with the proposed project in conjunction with other future development in the area. 4-1
32 Pacific Pointe East Development Project EIR Section 4.0 Environmental Impact Analysis This page intentionally left blank. 4-2
33 Pacific Pointe East Development Project EIR Section 4.1 Aesthetics 4.1 AESTHETICS This section addresses potential impacts related to aesthetics, including changes in public views and visual character, and consistency with adopted urban design policies Setting a. Visual Character of the Project Site Vicinity. The project site is located in northern central Long Beach, approximately 4.5 miles north of the Pacific Ocean. The project site is not located along a designated scenic corridor. The property is located in the Douglas Aircraft Planned Development District (PD-19). Conant Street runs along the northern boundary of the site, Lakewood Boulevard runs along the western boundary of the site, the Skylinks at Long Beach Golf Course borders the site to its south, and two office buildings border the site to the east. Figure 2-2 in Section 2.0, Project Description, presents an aerial view of the project site and surrounding uses. Figure 2-3 in Section 2.0 provides street-level photographs of the site, and figures 2-4(a) and 2-4(b) provide street-level photographs of nearby land uses. Figure documents surrounding industrial development. The project site is surrounded by a variety of land uses, including the following. The Skylinks at Long Beach Golf Course is located to the south of the site. The golf course is bordered by trees and other vegetation that up to approximately 20 feet high, which screens views into the golf course from the project site, and from Lakewood Boulevard and Clark Avenue. Long Beach Airport is located to the southwest of the site, with airport buildings approximately 650 feet south of the site and airport runways approximately 450 feet southwest of the site. Views of this area are available from the project site and from Lakewood Boulevard. These views consist primarily of runways, with airport facilities visible in the distance (approximately 3/4 mile west of Lakewood Boulevard). Due to their distance from the project site, these buildings are barely visible from the project site. However, from this distance, they appear as low-rise, utilitarian structures. Airport related, 20 to 30 foot high hangar-like buildings are located on the east side of the airport, along the west side of Lakewood Boulevard, but are not visible from the project site because of landscaping on the north side of the Skylinks at Long Beach Golf Course. West of the project site, the land on either side of Conant Street west of Lakewood Boulevard is within the City s Douglas Park South Planned Development District (PD-32), and is partially developed with commercial, office, and light industrial buildings in an office park setting, with the remainder of this area being vacant lots that have not yet been developed. Structures in this area are approximately 30 feet high and feature landscaped exterior areas including parking lots, and a contemporary commercial architectural style featuring neutral colors such as grays and whites, large prominent windows, and decorative architectural elements such as awnings. Directly north of the project site across Conant Street, the land west of Faculty Avenue is occupied by a former DC Jets factory currently owned by the Boeing Corporation. This building is approximately 40 feet in height and is a large, white, rectangular, hangar-type structure. East of Faculty Avenue, the land north of Conant Street across from the project site is occupied by surface parking lots on the campus of Long Beach City College. Office buildings associated with 4.1-1
34 Pacific Pointe East Development Project EIR Section 4.1 Aesthetics the college are located to the northeast and east of the project site on both sides of Conant Street. Buildings in this area are approximately 30 feet high and feature a contemporary commercial style, with simple forms, neutral colors such as white and gray, and a limited number of windows featuring dark tinting. Rosie the Riveter Park and Interpretive Center is located immediately to the east of these buildings on the southeast corner of Conant Street and Clark Avenue. b. Visual Character of the Project Site. The project site is currently occupied by a paved surface parking lot with security lighting surrounded by a low chain link fence. No existing structures are present within the project site. The site is topographically flat, and does not contain any notable trees or other landscape features. As can be seen in the photos of the project site in Figure 2-3 in Section 2.0, the site s visual quality is low, due to the fact that the entire site consists of a paved surface parking lot. c. Regulatory Setting. Citywide policies on scenic vistas focus on protecting views of the City s natural resources as well as views along significant streets and boulevards. The Scenic Routes Element, adopted in 1975, proposed five scenic route systems within the City. The Scenic Routes Element was adopted by the Long Beach City Council in The purpose of the Scenic Routes Element is to protect and enhance the scenic resources of the, by establishing a system of scenic routes along existing roadways that traverse areas of scenic beauty and interest. There are no scenic routes in the immediate project site vicinity. The closest Scenic Route is Ocean Boulevard, which is located approximately 4.3 miles to the south of the project site. The project site is not within the viewshed of Ocean Boulevard, which therefore would not be impacted by this project. Neighborhood aesthetics and character are addressed in several City policies, especially those contained in the Urban Design Analysis, Conclusions and Policy Directions Section of the Land Use Element and several in the Conservation and Scenic Routes Elements. These issues are further addressed in the City s Zoning Ordinance through a range of development standards that are applied by zoning district. The project site is located within the Douglas Aircraft Planned Development District (PD-19). This district is subject to specific standards adopted by the City that apply to all development within the district. The ordinance establishing PD-19 provides standards for building heights, setbacks, accessory structures, signs, landscaping, screening, architecture, and parking. All development projects in the PD-19 district are also subject to design review prior to approval. Policies and design standards from the City s General Plan related to aesthetics that apply to the proposed project are discussed below. This section primarily focuses on those requirements most applicable to the design of the proposed project for the purpose of assessing whether any inconsistency with these standards creates a significant impact on the City s visual resources. The project s consistency with the City s Zoning Ordinance is discussed in the Initial Study (Appendix A). The ultimate determination of whether the proposed project is consistent with the General Plan, Zoning Ordinance, and PD-19 district standards resides exclusively with the decision-making bodies (Site Plan Review Committee, Planning Commission, and City Council)


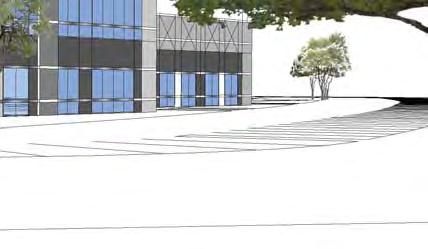
35 Pacific Pointe East Development Project EIR Section 4.1 Aesthetics Existing Industrial Development in the Project Vicinity Figure 4.1-1
36 Pacific Pointe East Development Project EIR Section 4.1 Aesthetics The General Plan policies most applicable to the proposed project are listed below. Land Use Element Neighborhood Emphasis: Long Beach recognizes a strong neighborhood to be the essential building block of a City-wide quality living environment and will assist and support the efforts of residents to maintain and strengthen their neighborhoods (p.18). Facilities Maintenance: Long Beach will maintain its physical facilities and public rights-of-way at a high level of functional and aesthetic quality, manifesting the pride of the citizens in their City and ensuring that future generations need not bear the burden of deferred maintenance (p. 18). Conservation Element To create and maintain a productive harmony between man and his environment through conservation of natural resources and protection of significant areas having environmental and aesthetic value (p.8) Impact Analysis a. Methodology and Significance Thresholds. The assessment of aesthetic impacts involves qualitative analysis that is inherently subjective in nature. Different viewers react to viewsheds and aesthetic conditions differently. This evaluation measures the proposed project against existing visual conditions, analyzing the nature of the anticipated change. The project site was observed and photographically documented (see Figure 2-3), as was the surrounding area (see Figure 4.1-1), to assist in the analysis. An impact is considered significant if development facilitated by the proposed project would result in one or more of the following conditions: Have a substantial adverse effect on a scenic vista Substantially degrade the existing visual character or quality of the site and its surroundings The Initial Study prepared for the proposed project determined that project implementation would result in less than significant impacts related to the following thresholds: Substantially damage scenic resources, including, but not limited to, trees, rock outcroppings, and historic buildings within a state scenic highway. Create a new source of substantial light or glare which would adversely affect day or nighttime views in the area. Consequently, these issues are not analyzed further in this section. The Initial Study analysis is provided in Appendix A
37 Pacific Pointe East Development Project EIR Section 4.1 Aesthetics b. Project Impacts and Mitigation Measures. Impact AES-1 The proposed project would involve replacing the existing surface parking lot with three industrial structures a maximum height of 41 feet. Because the project would would not adversely affect any scenic views and would be visually compatible with the industrial character of the area, its impact would be Class III, less than significant. The project site is located in an urban area in north central Long Beach. Surrounding development consists primarily of two- to three-story structures associated with surrounding industrial development, the Long Beach Airport, and the nearby Long Beach City College. The Skylinks at Long Beach Golf Course borders the site to its south. As discussed in the Setting, the project site is located in a topographically flat coastal plain; thus, few scenic vistas are available in the project site vicinity. Views of Signal Hill, located approximately two miles to the southwest, and of the Palos Verdes peninsula, located approximately ten miles to the west, are available from the site, from Conant Street north of the site, and from Lakewood Boulevard to the west of the site, although the Palos Verdes peninsula barely protrudes above the horizon. These are the only scenic views available in the project area. The following discussion evaluates project effects on available views from the surrounding streets (Clark Avenue, Lakewood Boulevard, and Conant Street) and from the Skylinks at the Long Beach Golf Course. Clark Avenue is located approximately 580 feet east of the project site. Existing commercial buildings approximately 30 feet high are located on Clark Avenue. These structures obscure views to the west from Clark Avenue, and project development therefore would not affect scenic views for this location. Lakewood Boulevard is located on the project site s western boundary. West-facing views of Signal Hill and the Palos Verdes peninsula from Lakewood Boulevard would not be obstructed by the proposed structures and project development therefore would not affect scenic views from this location The Skylinks at Long Beach Golf Course is located south of the project site. The golf course is surrounded by trees and other landscaping up to 20 feet in height, which affects the availability of views. However, some views of Signal Hill and the Palos Verdes peninsula would be available from this location. Project development to the north of the golf course would not affect these west-facing views, and project development therefore would not affect scenic views for this location. Conant Street is located on the project site s northern boundary. Looking south from Conant Street, the crest of Signal Hill is visible over the top of the golf course landscaping, which reaches up to 20 feet in height. The Palos Verdes peninsula is visible looking west from Conant Street, but barely protrudes above the horizon. As viewers travel west along Conant Street, these views are partially obstructed by terminals and other airport structures, although the flat runway areas allow for some consistent views of the Palos Verdes peninsula. The construction of industrial buildings a maximum of 41 feet high would eliminate south-facing views from 4.1-5
38 Pacific Pointe East Development Project EIR Section 4.1 Aesthetics Conant Street. However, since these views are distant, partial, and intermittent, and since the project site is not located in or near a designated scenic corridor, project impacts would be less than significant. Development of the proposed project would change the visual condition of the site through construction of the proposed industrial buildings. The project site plan is shown in Figure 2-5 in Section 2.0, Project Description. Figures through show exterior elevations for the three proposed industrial buildings. Project structures would be a maximum of 41 feet in height. The project site is located in a highly industrialized area and the proposed structures are similar in height and scale to existing industrial structures in the project vicinity, which range from 30 to 40 feet high. As shown in Figure 4.1-1, surrounding industrial development is of varied age and architectural style, and development of the proposed project structures would consistent with the aesthetic values of the area. The proposed project includes a landscaping plan that provides for the planning of 368 new trees on the project site. These trees would provide new visual interest to the project site, which is currently an asphalt parking lot that lacks landscaping. Project development would not substantially degrade the existing visual character in the area. In summary, although the project would alter the visual character of the project site, this change in visual character would not be significantly adverse and the project would not substantially damage a scenic resource. Mitigation Measures. None required. Significance After Mitigation. With required approval through the Site Plan Review approval process, impacts would be less than significant without mitigation. Impact AES-2 The proposed project would not conflict with adopted policies of the related to aesthetics, and would therefore produce a Class III, less than significant, impact. The various regulations and policies relating to aesthetics that would apply to the proposed project are listed in Section 4.1.1c, Regulatory Setting. These include policies from the Land Use Element and Conservation Element of the City s Beach General Plan. The project s consistency with applicable provisions of the City s Zoning Ordinance was already analyzed in the Initial Study (Appendix A), which found that the project would have a less than significant impact in this regard. The project would also be subject to the design requirement of the PD-19 District in which the site is located. Review of the policies from the Land Use and Conservation Elements reveals that these policies are meant to maintain and strengthen neighborhoods; maintain and enhance the City s public facilities (including public rights-of-way) and protect areas of high aesthetic value. Impact AES- 1 found that the project would have a less than significant impact on the visual character of the site and its surroundings, and the project would therefore not conflict with any of the policies relating to visual character and overall aesthetic quality. The project also would not have a negative impact on any City facilities, including public rights-of-way. The project would comply with all applicable design standards, in the establishing ordinance for PD-19. The proposed building setbacks (approximately 35 feet) exceed PD-19 requirements (10 feet), and 4.1-6


39 Pacific Pointe East Development Project EIR Section 4.1 Aesthetics Building 9 Elevation Source: DeRevere & Associates, August 2013 Figure 4.1-2


40 Pacific Pointe East Development Project EIR Section 4.1 Aesthetics Building 10 Elevation Source: DeRevere & Associates, August 2013 Figure 4.1-3


41 Pacific Pointe East Development Project EIR Section 4.1 Aesthetics Building 11 Elevation Source: DeRevere & Associates, August 2013 Figure 4.1-4
42 Pacific Pointe East Development Project EIR Section 4.1 Aesthetics the project site plan includes architectural features intended to improve the appearance of the industrial structures to offsite viewers (see Figures through 4.1-3) and a landscaping plan that would provide for 368 new trees within the project site. In summary, for the reasons discussed above, the changes to the project site and its surroundings that would be produced by the proposed project would not be inconsistent with applicable policies of the City s General Plan relating to aesthetics. Mitigation Measures. None required. Significance After Mitigation. Impacts would be less than significant without mitigation. c. Cumulative Impacts. Future projects in Long Beach will be required to adhere to specific development standards in the City s Zoning Ordinance and General Plan designed to protect and enhance the area s aesthetic and visual resources. Additionally, there are no planned or pending projects within any viewshed from which the project site can be seen. Though cumulative development may, over time, alter the visual character of north central Long Beach to a somewhat denser urban environment, the project s contribution to the overall visual effect of cumulative development in the area would be less than significant
43 Pacific Pointe East Development Project EIR Section 4.1 Aesthetics This page intentionally left blank
44 Pacific Pointe East Development Project EIR Section 4.2 Air Quality 4.2 AIR QUALITY This section analyzes the proposed project s temporary and long-term impacts to local and regional air quality. Greenhouse gas emissions are discussed in Section 4.3, Greenhouse Gas Emissions. This section uses data generated using the California Air Emissions Estimator Model (CalEEMod), which can be found in Appendix B Setting The project site is located in the, which is part of the South Coast Air Basin (Basin) and is under the jurisdiction of SCAQMD. a. Climate and Meteorology. Air quality in the Basin is affected by various emission sources (mobile and industry, etc.) as well as atmospheric conditions such as wind speed, wind direction, temperature, and rainfall, etc. The combination of topography, low mixing height, abundant sunshine, and emissions from the second largest urban area in the United States give the Basin the worst air pollution problem in the nation. The majority of annual rainfall in the Basin occurs between November and April. Summer rainfall is minimal and is generally limited to scattered thunder showers in coastal regions and slightly heavier showers in the eastern portion of the Basin and along the coastal side of the mountains. The Long Beach WSCMO Station climatological station monitored precipitation from April 1958 to March Average monthly rainfall measured in Long Beach during that period varied from 2.90 inches in February to 0.42 inch or less between May and October, with an annual total of inches. Patterns in monthly and yearly rainfall totals are unpredictable due to fluctuations in the weather. The Basin experiences a persistent temperature inversion (increasing temperature with increasing altitude) as a result of the Pacific high. This inversion limits the vertical dispersion of air contaminants, holding them relatively near the ground. As the sun warms the ground and the lower air layer, the temperature of the lower air layer approaches the temperature of the base of the inversion (upper) layer until the inversion layer finally breaks, allowing vertical mixing with the lower layer. This phenomenon is observed in midafternoon to late afternoon on hot summer days, when the smog appears to clear up suddenly. Winter inversions frequently break by midmorning. The combination of stagnant wind conditions and low inversions produces the greatest pollutant concentrations. On days of no inversion or high wind speeds, ambient air pollutant concentrations are lowest. During periods of low inversions and low wind speeds, air pollutants generated in urbanized areas are transported predominantly onshore into Riverside and San Bernardino counties. In the winter, the greatest pollution problem is accumulation of CO and nitrogen oxides (NOX) due to extremely low inversions and air stagnation during the night and early morning hours. In the summer, the longer daylight hours and the brighter sunshine combine to cause a reaction between hydrocarbons and NOX to form photochemical smog
45 Pacific Pointe East Development Project EIR Section 4.2 Air Quality b. Air Pollution Regulation. The California Air Resources Board (CARB) coordinates and oversees both State and federal air pollution control programs in California. The CARB oversees activities of local air quality management agencies and maintains air quality monitoring stations throughout the State in conjunction with the Environmental Protection Agency (EPA) and local air districts. The CARB has divided the State into 15 air basins based on meteorological and topographical factors of air pollution. Data collected at these stations are used by the CARB and EPA to classify air basins as attainment, nonattainment, nonattainmenttransitional, or unclassified, based on air quality data for the most recent three calendar years compared with the Ambient Air Quality Standards (AAQS). Nonattainment areas are imposed with additional restrictions as required by the EPA. The air quality data are also used to monitor progress in attaining air quality standards. Table lists the AAQS for criteria pollutants in the Basin. Table Current Federal and State Ambient Air Quality Standards Pollutant Federal Standard California Standard Ozone Carbon Monoxide Nitrogen Dioxide Sulfur Dioxide ppm (8-hr avg) 9.0 ppm (8-hr avg) 35.0 ppm (1-hr avg) ppm (annual avg) 0.14 ppm (24-hr avg) ppm (1-hr avg) 0.09 ppm (1-hr avg) 0.07 ppm (8-hr avg) 9.0 ppm (8-hr avg) 20.0 ppm (1-hr avg) 0.18 ppm (1-hr avg) ppm (annual avg) 0.04 ppm (24-hr avg) 0.25 ppm (1-hr avg) Lead 1.5 g/m 3 (3-month avg) 1.5 g/m 3 (30-day avg) Particulate Matter (PM 10) 150 g/m 3 (24-hr avg) 20 g/m 3 (annual avg) 50 g/m 3 (24-hr avg) Particulate Matter (PM 2.5) 15 g/m 3 (annual avg) 35 g/m 3 (24-hr avg) 12 g/m 3 (annual avg) ppm= parts per million g/m 3 = micrograms per cubic meter Source: California Air Resources Board, Ozone. O 3 (smog) is formed by photochemical reactions between oxides of nitrogen and reactive organic gases rather than being directly emitted. Ozone is a pungent, colorless gas typical of Southern California smog. Elevated ozone concentrations result in reduced lung function, particularly during vigorous physical activity. This health problem is particularly acute in sensitive receptors such as the sick, the elderly, and young children. Ozone levels peak during summer and early fall. The entire Basin is designated as a nonattainment area for the State 1-hour and 8-hour ozone standards. The EPA has officially designated the status for the Basin regarding the 8-hour ozone standard as Extreme, which means the Basin has until 2024 to attain the federal 8-hour O 3 standard. Carbon Monoxide. CO is formed by the incomplete combustion of fossil fuels, almost entirely from automobiles. It is a colorless odorless gas that can cause dizziness, fatigue, and impairment to central nervous system functions. The entire Basin is in attainment for the State 4.2-2
46 Pacific Pointe East Development Project EIR Section 4.2 Air Quality standards for CO. The Basin is designated as an Attainment/Maintenance area under the federal CO standards. Nitrogen Oxides. Nitrogen dioxide (NO 2), a reddish-brown gas, and nitric oxide (NO), a colorless odorless gas, are formed from fuel combustion under high temperature or pressure. These compounds are referred to as nitrogen oxides, or NOX. NOX is a primary component of the photochemical smog reaction. It also contributes to other pollution problems, including a high concentration of fine particulate matter, poor visibility, and acid deposition (i.e., acid rain). NO 2 decreases lung function and may reduce resistance to infection. The entire Basin is designated as nonattainment for the State NO 2 standard and as an Attainment/Maintenance area under the federal NO 2 standard. Sulfur Dioxide. Sulfur dioxide (SO 2) is a colorless irritating gas formed primarily from incomplete combustion of fuels containing sulfur. Industrial facilities also contribute to gaseous SO 2 levels. SO 2 irritates the respiratory tract, can injure lung tissue when combined with fine particulate matter, and reduces visibility and the level of sunlight. The entire Basin is in attainment for both federal and State SO 2 standards. Lead. Lead is found in old paints and coatings, plumbing, and a variety of other materials. Once in the blood stream, lead can cause damage to the brain, nervous system, and other body systems. Children are highly susceptible to the effects of lead. The Los Angeles County portion of the Basin was redesignated as nonattainment for the State and federal standards for lead in Particulate Matter. Particulate matter is the term used for a mixture of solid particles and liquid droplets found in the air. Coarse particles (particulate matter less than 10 microns in diameter [PM 10]), derive from a variety of sources, including windblown dust and grinding operations. Fuel combustion and resultant exhaust from power plants and diesel buses and trucks are primarily responsible for fine particle (PM 2.5) levels. Fine particles can also be formed in the atmosphere through chemical reactions. PM 10 can accumulate in the respiratory system and aggravate health problems such as asthma. The EPA s scientific review concluded that, which penetrates deeply into the lungs, is more likely than to contribute to the health effects listed in a number of recently published community epidemiological studies at concentrations that extend well below those allowed by the current standards. These health effects include premature death; increased hospital admissions and emergency room visits (primarily the elderly and individuals with cardiopulmonary disease); increased respiratory symptoms and disease (children and individuals with cardiopulmonary disease such as asthma); decreased lung functions (particularly in children and individuals with asthma); and alterations in lung tissue and structure and in respiratory tract defense mechanisms. The Basin is a nonattainment area for the State PM 10 and PM 2.5 standards and a nonattainment area for the federal PM 2.5 standards. The Basin was redesignated as attainment/maintenance for the federal PM 10 standard in Reactive Organic Compounds. Reactive organic compounds (ROCs; also known as ROGs and volatile organic compounds [VOCs]) are formed from combustion of fuels and evaporation of organic solvents. ROCs are not defined criteria pollutants but are a prime component of the photochemical smog reaction. Consequently, ROCs accumulate in the 4.2-3
47 Pacific Pointe East Development Project EIR Section 4.2 Air Quality atmosphere more quickly during the winter when sunlight is limited and photochemical reactions are slower. Sulfates. Sulfates occur in combination with metal and/or hydrogen ions. In California, emissions of sulfur compounds occur primarily from the combustion of petroleum-derived fuels (e.g., gasoline and diesel fuel) that contain sulfur. This sulfur is oxidized to SO 2 during the combustion process and subsequently converted to sulfate compounds in the atmosphere. The conversion of SO 2 to sulfates takes place comparatively rapidly and completely in urban areas of California due to regional meteorological features. The entire Basin is in attainment for the State standard for sulfates. Hydrogen Sulfide. Hydrogen sulfide (H 2S) is a colorless gas with the odor of rotten eggs. It is formed during bacterial decomposition of sulfur-containing organic substances. Also, it can be present in sewer gas and some natural gas and can be emitted as the result of geothermal energy exploitation. In 1984, a CARB committee concluded that the ambient standard for H2S is adequate to protect public health and to significantly reduce odor annoyance. The entire Basin is unclassified for the State standard for H2S. Visibility-Reducing Particles. Visibility-reducing particles consist of suspended particulate matter, which is a complex mixture of tiny particles that consists of dry solid fragments, solid cores with liquid coatings, and small droplets of liquid. These particles vary greatly in shape, size, and chemical composition, and can be made up of many different materials such as metals, soot, soil, dust, and salt. The statewide standard is intended to limit the frequency and severity of visibility impairment due to regional haze. The entire Basin is unclassified for the State standard for visibility-reducing particles. Federal Regulations/Standards. Pursuant to the federal Clean Air Act (CAA) of 1970, the EPA established national ambient air quality standards (NAAQS). The NAAQS were established for six major pollutants termed criteria pollutants. Criteria pollutants are defined as those pollutants for which the federal and State governments have established AAQS, or criteria, for outdoor concentrations in order to protect public health. The NAAQS are shown in Table Data collected at permanent monitoring stations are used by the EPA to classify regions as attainment or nonattainment, depending on whether the regions met the requirements stated in the primary NAAQS. Nonattainment areas are imposed with additional restrictions as required by the EPA. The EPA has designated the Southern California Association of Governments (SCAG) as the Metropolitan Planning Organization (MPO) responsible for ensuring compliance with the requirements of the CAA for the Basin. The EPA established new national air quality standards for ground-level ozone and fine particulate matter in On May 14, 1999, the Court of Appeals for the District of Columbia Circuit issued a decision ruling that the CAA, as applied in setting the new public health standards for ozone and particulate matter, was unconstitutional as an improper delegation of legislative authority to the EPA. On February 27, 2001, the U.S. Supreme Court upheld the way 4.2-4
48 Pacific Pointe East Development Project EIR Section 4.2 Air Quality the government sets air quality standards under the CAA. The Court unanimously rejected industry arguments that the EPA must consider financial costs as well as health benefits in writing standards. The justices also rejected arguments that the EPA took too much lawmaking power from Congress when it set tougher standards for ozone and soot in Nevertheless, the court dismissed the EPA s policy for implementing new ozone rules, saying that the agency ignored a section of the law that restricts its authority to enforce such rules. In April 2, the EPA was cleared by the White House Office of Management and Budget (OMB) to implement the 8-hour ground-level ozone standard. The EPA issued the proposed rule implementing the 8-hour ozone standard in April 2. The EPA completed final 8-hour nonattainment status on April 15, The EPA revoked the 1-hour ozone standard on June 15, 2005, and lowered the 8-hour O3 standard from 0.08 parts per million (ppm) to ppm on April 1, The EPA issued the final implementation rule in fall The EPA lowered the 24-hour standard from 65 to 35 micrograms per cubic meter (µg/m3) and revoked the annual standard on December 17, The EPA issued final designations for the hour standard on December 12, State Regulations/Standards. In 1967, the California Legislature passed the Mulford- Carrell Act, which combined two Department of Health bureaus: the Bureau of Air Sanitation and the Motor Vehicle Pollution Control Board, in order to establish CARB. Since its formation, CARB has worked with the public, the business sector, and local governments to find solutions to California s air pollution problems. The CARB identified particulate emissions from diesel-fueled engines (diesel particulate matter [DPM]) as toxic air contaminants (TACs) in August Following the identification process, CARB was required by law to determine whether there is a need for further control. In September 2000, the CARB adopted the Diesel Risk Reduction Plan (Diesel RRP), which recommends many control measures to reduce the risks associated with DPM and to achieve the goal of 85 percent DPM reduction by California Green Building Code. California Green Buildings Standards Code (Cal Green Code) (California Code of Regulations [CCR], Title 24, Part 11) was adopted by the California Building Standards Commission in 2010 and became effective in January The Code applies to all new constructed residential, nonresidential, commercial, mixed-use, and Stateowned facilities, as well as schools and hospitals. Cal Green Code is comprised of Mandatory Residential and Nonresidential Measures and more stringent Voluntary Measures (TIERs I and II). Mandatory Measures are required to be implemented on all new construction projects and consist of a wide array of green measures concerning project site design, water use reduction, improvement of indoor air quality, and conservation of materials and resources. The Cal Green Building Code refers to Title 24, Part 6 compliance with respect to energy efficiency; however, it encourages 15 percent energy use reduction over that required in Part 6. Voluntary Measures are optional, more stringent measures may be used by jurisdictions that strive to enhance their commitment towards green and sustainable design and achievement of Assembly Bill (AB) 32 goals. Under TIERs I and II, all new construction projects are required to reduce energy consumption by 15 percent and 30 percent, respectively, below the baseline required under the 4.2-5
49 Pacific Pointe East Development Project EIR Section 4.2 Air Quality California Energy Commission (CEC), as well as implement more stringent green measures than those required by mandatory code. Local Regulations and Policies. There are a number of local regulations and policies related to air quality, as described below. Regional Air Quality Planning Framework. The 1976 Lewis Air Quality Management Act established the SCAQMD and other air districts throughout the State. The federal CAA Amendments of 1977 required that each state adopt an implementation plan outlining pollution control measures to attain the federal standards in nonattainment areas of the state. The CARB is responsible for incorporating air quality management plans for local air basins into a State Implementation Plan (SIP) for EPA approval. Significant authority for air quality control within the local air basins has been given to local air districts that regulate stationary source emissions and develop local nonattainment plans. Regional Air Quality Management Plan. The SCAQMD and the SCAG are responsible for formulating and implementing the Air Quality Management Plan (AQMP) for the Basin. Every 3 years, the SCAQMD prepares a new AQMP, updating the previous plan and having a 20-year horizon. The Final 2012 AQMP was adopted by the SCAQMD on December 7, 2012, and forwarded it to the CARB for review in February The 2012 AQMP includes the new and changing federal requirements, implementation of new technology measures, and the continued development of economically sound, flexible compliance approaches. General Plan. The Air Quality Element (1996) of the Long Beach General Plan includes goals and polices related to air quality. The following goals and policies are applicable to the proposed Project: Goal 6: Minimize particulate emissions from the construction and operation of roads and buildings, from mobile sources, and from the transportation, handling and storage materials. Policy 6.1: Control Dust. Further reduce particulate emissions from roads, parking lots, construction sites, unpaved alleys, and port operations and related uses. Goal 7: Reduce emissions through reduced energy consumption. Policy 7.1: Energy Conservation. Reduce energy consumption through conservation improvements and requirements. c. Current Air Quality. Both the State of California and the federal government have established health-based AAQS for the criteria air pollutants described previously. As previously discussed, areas that meet AAQSs are classified as attainment areas, while areas that do not meet these standards are classified as nonattainment areas. Local Air Quality. The SCAQMD, together with the CARB, maintains ambient air quality monitoring stations in the Basin. The air quality monitoring station closest to the site is the North Long Beach station, and its air quality trends are representative of the ambient air quality in the project area. The pollutants monitored are CO, O 3, NO 2, and SO 2. The closest station to the project site that monitors PM 10 and PM 2.5 is the Long Beach Pacific Coast Highway 4.2-6
50 Pacific Pointe East Development Project EIR Section 4.2 Air Quality station. Table summarizes the ambient air quality levels measured at these stations between 2010 and Table Ambient Air Quality Data Pollutant Ozone, ppm - Worst Hour Number of days of State exceedances (>0.09 ppm) Carbon Monoxide, ppm - Worst 8 Hours Number of days of State/Federal exceedances (>9.0 ppm) Nitrogen Dioxide, ppm - Worst Hour Number of days of State exceedances (>0.18 ppm) Sulfur Dioxide, ppm Worst Hour Number of days of State exceedances (>0.04 ppm) Particulate Matter <10 microns, g/m 3 Worst 24 Hours ¹ Number of samples of State exceedances (>50 g/m 3 ) Number of samples of Federal exceedances (>150 g/m 3 ) Particulate Matter <2.5 microns, g/m 3 Worst 24 Hours¹ Number of samples of Federal exceedances (>35 g/m 3 ) Source: CARB, Annual Air Quality Data Summaries available at SO 2, NO 2, and CO levels did not exceed state or federal standards from 2010 to O 3 exceeded State standards one time over this period. PM 2.5 levels exceeded federal standards eight times over this period,and PM 10 levels exceeded state standards three times over this period but remained within federal standards Impact Analysis a. Methodology and Significance Thresholds. Methodology. The air quality analysis conforms to the methodologies recommended in the SCAQMD s CEQA Air Quality Handbook (1993). The handbook includes thresholds for emissions associated with both construction and operation of proposed projects. The SCAQMD s current guidelines, included in its CEQA Air Quality Handbook, were adhered to in the assessment of potential short- and long-term air quality impacts of the proposed Project. However, the air quality models identified in the CEQA Air Quality Handbook are outdated; therefore, CalEEMod Version was used to quantify the project-related mobile 4.2-7
51 Pacific Pointe East Development Project EIR Section 4.2 Air Quality and stationary source emissions. Both temporary construction emissions and long-term operation emissions were calculated using CalEEMod. Operational emissions were estimated using information provided in the traffic study contained in Appendix C. Both construction and long-term emissions were analyzed based on the regional thresholds established by the SCAQMD and published in the CEQA Air Quality Handbook. Regional Thresholds. To determine whether a proposed project would have a significant impact to air quality, Appendix G of the CEQA Guidelines questions whether a project would: a) Conflict with or obstruct implementation of the applicable air quality plan; b) Violate any air quality standard or contribute substantially to an existing or projected air quality violation; c) Result in a cumulatively considerable net increase of any criteria pollutant for which the project region is in non-attainment under an applicable federal or state ambient air quality standard (including releasing emissions that exceed quantitative thresholds for ozone precursors); d) Expose sensitive receptors to substantial pollutant concentrations; or e) Create objectionable odors affecting a substantial number of people. As discussed in the Initial Study prepared for the proposed project (see Appendix A), project development would not cause population growth exceeding forecasts used to prepare the Basin Air Quality Management Plan, and therefore the project would not conflict with or obstruct the implementation of that plan. The Initial Study also concluded that onsite development would not generate objectionable odors that would affect a substantial number of people. No heavy industrial, agricultural or other uses typically associated with objectionable odors are proposed. Therefore, it is unlikely that the proposed project would generate objectionable odors affecting a substantial number of people. Consequently, the thresholds related to conflict with air quality plans and objectionable odors are not discussed below. The SCAQMD has developed specific numeric thresholds that apply to projects within the Basin. The SCAQMD currently recommends that impacts associated with projects with construction-related mass daily emissions that exceed any of the following emissions thresholds should be considered significant: 75 pounds per day of ROG 100 pounds per day of NO x 550 pounds per day of CO 150 pounds per day of SO x 150 pounds per day of PM pounds per day of PM 2.5 The SCAQMD has also established the following significance thresholds for project operations within the Basin: 4.2-8
52 Pacific Pointe East Development Project EIR Section 4.2 Air Quality 55 pounds per day of ROG 55 pounds per day of NO X 550 pounds per day of CO 150 pounds per day of SO X 150 pounds per day of PM pounds per day of PM 2.5 Localized Significance Thresholds. In addition to the above thresholds, the SCAQMD has developed Localized Significance Thresholds (LSTs) in response to the Governing Board s Environmental Justice Enhancement Initiative (1-4), which was prepared to update the CEQA Air Quality Handbook. LSTs were devised in response to concern regarding exposure of individuals to criteria pollutants in local communities. LSTs represent the maximum emissions from a project that will not cause or contribute to an air quality exceedance of the most stringent applicable federal or state ambient air quality standard at the nearest sensitive receptor, taking into consideration ambient concentrations in each source receptor area (SRA), project size, distance to the sensitive receptor, etc. However, LSTs only apply to emissions within a fixed stationary location, including idling emissions during both project construction and operation. LSTs have been developed for NO x, CO, PM 10 and PM 2.5. LSTs are not applicable to mobile sources such as cars on a roadway (Final Localized Significance Threshold Methodology, SCAQMD, June 2). As such, LSTs for operational emissions do not apply to onsite development as the majority of emissions would be generated by cars on the roadways. LSTs have been developed for emissions within areas up to five acres in size, with air pollutant modeling recommended for activity within larger areas. The SCAQMD provides lookup tables for project sites that measure one, two, or five acres. The project area measures approximately 25 acres and is located in Source Receptor Area 4 (SRA-4). For the purposes of this EIR, it is assumed that construction activity at the project site would generally occur within a five-acre area at any one time. The applicable LSTs for construction on a five acre site in SRA-4 are shown in Table According to the SCAQMD s publication, Final Localized Significant (LST) Thresholds Methodology, the use of LSTs is voluntary, to be implemented at the discretion of local agencies. Table SCAQMD LSTs for Emissions in SRA-4 Pollutant Allowable emissions as a function of receptor distance in meters from a five-acre site (lbs/day) Gradual conversion of NO x to NO CO 1,530 1,982 2,613 4,184 10,198 PM 10 (construction) PM 10 (operation) PM 2.5 (construction) PM 2.5 (operation) Source: SCAQMD
53 Pacific Pointe East Development Project EIR Section 4.2 Air Quality CO Hotspots Thresholds. The significance of localized project impacts under CEQA depends on whether ambient CO levels in the vicinity of the project are above or below state and federal CO standards. If ambient levels are below the standards, a project is considered to have a significant impact if project emissions result in an exceedance of one or more of these standards. If ambient levels already exceed a state or federal standard, project emissions are considered significant if they increase 1-hour CO concentrations by 1.0 ppm or more or 8-hour CO concentrations by 0.45 ppm or more. The following are applicable local emission concentration standards for CO: California State 1-hour CO standard of 20.0 ppm California State 8-hour CO standard of 9.0 ppm As shown in Table above, CO concentrations in the Basin do not exceed federal or state standards for CO. Therefore, a CO hotspots analysis would not be required for the proposed project. b. Project Impacts and Mitigation Measures. Impact AQ-1 Onsite construction activity would generate air pollutant emissions, but construction-related emissions would not exceed SCAQMD thresholds for any criteria pollutant. Therefore, impacts would be Class III, less than significant. Construction emissions estimates were generated for onsite development using the CalEEMod model (Version ). The model considers six construction phases: 1) demolition; 2) site preparation; 3) grading; 4) building construction; 5) architectural coating; and, 6) paving. Construction equipment would include tractors, loaders, backhoes, cranes, forklifts, dozers, pavers, air compressors, and saws (See Appendix A for the construction equipment mixes). Table shows estimated daily emissions during demolition, site preparation, grading, building, architectural coating, and paving. As shown in Table 4.2-4, construction emissions would not exceed any SCAQMD regional thresholds. The LST thresholds only apply to those emissions generated by onsite construction activities, such as emissions from onsite grading, and do not apply to offsite mobile emissions. The LST thresholds for sensitive receptors 200 meters from the project site were used to illustrate the closest receptors, which are located approximately 730 feet (222 meters) to the east of the project site. As indicated in Table 4.2-4, emissions generated by temporary construction activities would be below LST thresholds for NOx, CO, PM 10 and PM 2.5. Therefore, impacts related to construction emissions would be less than significant. Mitigation Measures. Mitigation would not be required since impacts would be less than significant. Significance After Mitigation. Impacts would be less than significant without mitigation
54 Pacific Pointe East Development Project EIR Section 4.2 Air Quality Table Estimated Construction Maximum Daily Air Pollutant Emissions (lbs/day) Emissions (lbs/day) ROG NO X CO SO 2 PM 10 PM 2.5 Demolition Site Preparation Grading Building Construction Architectural Coating Paving Maximum lbs/day e SCAQMD Thresholds Threshold Exceeded? No No No No No No Local Significance Thresholds f (LSTs) n/a 141 4,184 n/a Threshold Exceeded? n/a No No n/a No No Source: SCAQMD LST Spreadsheet for a 5-acre site and CalEEMod; see Appendix B for calculations. e Maximum daily emissions based on highest in any construction period. f LSTs are for a five-acre project in SRA-4 within a distance of 200 meters from the site boundary Impact AQ-2 Operation of the proposed project would generate air pollutant emissions in the long-term. However, emissions would not exceed SCAQMD operational significance thresholds for any criteria pollutants. Therefore, operational air quality impacts would be Class III, less than significant. Long-term air pollutant emission impacts are those associated with stationary sources and mobile sources involving any project-related changes. The proposed project would result in an increase in both stationary and mobile source emissions. Stationary source emissions would come from additional natural gas consumption for onsite buildings and electricity for the lighting in the buildings and at the parking area. Mobile source emissions would come from project-related vehicle trips. Project-related vehicle trips are largely dependent on the number of employees working at the project site. The net increase in long-term operational emissions associated with the proposed project, calculated using CalEEMod, are shown in Table The net increase of all criteria pollutants would be less than the corresponding SCAQMD daily emission thresholds. Therefore, projectrelated long-term impacts to regional air quality would not be significant
55 Pacific Pointe East Development Project EIR Section 4.2 Air Quality Table Long-Term Operational Emissions (lbs/day) Emission Source ROG NO X CO SO 2 PM 10 PM 2.5 Area Energy Mobile Total Project Emissions SCAQMD Thresholds Threshold Exceeded? No No No No No No Source: see Appendix B for CalEEMod calculations; Mitigation Measures. Mitigation would not be required since impacts would be less than significant. Significance After Mitigation. Impacts would be less than significant without mitigation. c. Cumulative Impacts. SCAQMD s approach to determining cumulative air quality impacts for criteria air pollutants is to first determine whether or not the proposed project would result in a significant project-level impact to regional air quality based on SCAQMD significance thresholds. If the project does not exceed SCAQMD thresholds, then the lead agency needs to consider the additive effects of related projects only if the proposed project is part of an ongoing regulatory program or is contemplated in a Program EIR, and the related projects are located within an approximately one mile of the proposed project site. If there are related projects within the vicinity (one-mile radius) of the project site, that are part of an ongoing regulatory program or are contemplated in a Program EIR, then the additive effect of the related projects should be considered. As discussed in Section 3.3, Cumulative Projects Setting, seven related projects are located within a two-mile radius of the project site. Each related project would generate emissions during construction and operation. Neither the proposed project nor the related projects are part of an ongoing regulatory program or are contemplated in a Program EIR. The SCAQMD therefore recommends that project-specific air quality impacts be used to determine the potential cumulative impacts to regional air quality. As discussed under Impact AQ-2, the proposed project would result in an increase in daily operational emissions; however, emissions would not exceed the SCAQMD thresholds
56 Pacific Pointe East Development Project EIR Section 4.2 Air Quality Implementation of the proposed project would not result in the addition of criteria pollutants during operation of the project that would contribute to cumulative impacts in conjunction with related projects in the region. Because the proposed project would not generate emissions that exceed the SCAQMD s operational thresholds and the project is consistent with the AQMP (as discussed in the Initial Study prepared for the project and included in Appendix A of this EIR), operation of the project would not make a cumulatively considerable contribution with regard to criteria pollutants. Therefore, the project s contribution to cumulative regional long term air quality impacts would not be cumulatively considerable. As discussed under Impact AQ-1, construction-generated emissions would not exceed SCAQMD significance thresholds for ROG, NOx, CO, SO 2, PM 10 and PM 2.5. Therefore, the project s contribution to temporary cumulative regional air quality impacts would not be cumulatively considerable
57 Pacific Pointe East Development Project EIR Section 4.2 Air Quality This page intentionally left blank
58 Pacific Pointe East Development Project EIR Section 4.3 Greenhouse Gas Emissions/Climate Change Setting 4.3 GREENHOUSE GAS EMISSIONS/CLIMATE CHANGE a. Climate Change and Greenhouse Gases. Climate change is the observed increase in the average temperature of the Earth s atmosphere and oceans along with other substantial changes in climate (such as wind patterns, precipitation, and storms) over an extended period of time. The term climate change is often used interchangeably with the term global warming, but climate change is preferred to global warming because it helps convey that there are other changes in addition to rising temperatures. The baseline against which these changes are measured originates in historical records identifying temperature changes that have occurred in the past, such as during previous ice ages. The global climate is continuously changing, as evidenced by repeated episodes of substantial warming and cooling documented in the geologic record. The rate of change has typically been incremental, with warming or cooling trends occurring over the course of thousands of years. The past 10,000 years have been marked by a period of incremental warming, as glaciers have steadily retreated across the globe. However, scientists have observed acceleration in the rate of warming during the past 150 years. Per the United Nations Intergovernmental Panel on Climate Change (IPCC, 2013), the understanding of anthropogenic warming and cooling influences on climate has led to a high confidence (95% or greater chance) that the global average net effect of human activities has been the dominant cause of warming since the mid-20 th century(ipcc, 2013). Gases that absorb and re-emit infrared radiation in the atmosphere are called greenhouse gases (GHGs). GHGs are present in the atmosphere naturally, are released by natural sources, or are formed from secondary reactions taking place in the atmosphere. The gases that are widely seen as the principal contributors to human-induced climate change include carbon dioxide (CO 2), methane (CH 4), nitrous oxides (N 2O), fluorinated gases such as hydrofluorocarbons (HFCs) and perfluorocarbons (PFCs), and sulfur hexafluoride (SF 6). Water vapor is excluded from the list of GHGs because it is short-lived in the atmosphere and its atmospheric concentrations are largely determined by natural processes, such as oceanic evaporation. GHGs are emitted by both natural processes and human activities. Of these gases, CO 2 and CH 4 are emitted in the greatest quantities from human activities. Emissions of CO 2 are largely byproducts of fossil fuel combustion, whereas CH 4 results from off-gassing associated with agricultural practices and landfills. Observations of CO 2 concentrations, globally-averaged temperature, and sea level rise are generally well within the range of the extent of the earlier IPCC projections. The recently observed increases in CH 4 and N 2O concentrations are smaller than those assumed in the scenarios in the previous assessments. Each IPCC assessment has used new projections of future climate change that have become more detailed as the models have become more advanced. Man-made GHGs, many of which have greater heat-absorption potential than CO 2, include fluorinated gases and sulfur hexafluoride (SF 6) (California Environmental Protection Agency [CalEPA], 2006). Different types of GHGs have varying global warming potentials (GWPs). The GWP of a GHG is the potential of a gas or aerosol to trap heat in the atmosphere over a specified timescale (generally, 100 years). Because GHGs absorb different amounts of heat, a common reference gas (CO 2) is used to relate the amount of heat absorbed to the amount of the gas 4.3-1
59 Pacific Pointe East Development Project EIR Section 4.3 Greenhouse Gas Emissions/Climate Change emissions, referred to as carbon dioxide equivalent (CO 2E), and is the amount of a GHG emitted multiplied by its GWP. Carbon dioxide has a 100-year GWP of one. By contrast, methane CH 4 has a GWP of 25, meaning its global warming effect is 25 times greater than carbon dioxide on a molecule per molecule basis (IPCC, 2006). The accumulation of GHGs in the atmosphere regulates the earth s temperature. Without the natural heat trapping effect of GHG, Earth s surface would be about 34 C cooler (CalEPA, 2006). However, it is believed that emissions from human activities, particularly the consumption of fossil fuels for electricity production and transportation, have elevated the concentration of these gases in the atmosphere beyond the level of naturally occurring concentrations. The following discusses the primary GHGs of concern. Carbon Dioxide. The global carbon cycle is made up of large carbon flows and reservoirs. Billions of tons of carbon in the form of CO 2 are absorbed by oceans and living biomass (i.e., sinks) and are emitted to the atmosphere annually through natural processes (i.e., sources). When in equilibrium, carbon fluxes among these various reservoirs are roughly balanced (United States Environmental Protection Agency [U.S. EPA], April 2012). CO 2 was the first GHG demonstrated to be increasing in atmospheric concentration, with the first conclusive measurements being made in the last half of the 20 th century. Concentrations of CO 2 in the atmosphere have risen approximately 40% since the industrial revolution. The global atmospheric concentration of CO 2 has increased from a pre-industrial value of about 280 parts per million (ppm) to 391 ppm in 2011 (IPCC, 2007; Oceanic and Atmospheric Association [NOAA], 2010). The average annual CO 2 concentration growth rate was larger between 1995 and 2005 (average: 1.9 ppm per year) than it has been since the beginning of continuous direct atmospheric measurements ( average: 1.4 ppm per year), although there is year-to-year variability in growth rates (NOAA, 2010). Currently, CO 2 represents an estimated 82.8% of total GHG emissions (Department of Energy [DOE] Energy Information Administration [EIA], August 2010). The largest source of CO 2, and of overall GHG emissions, is fossil fuel combustion. Methane. Methane (CH 4) is an effective absorber of radiation, though its atmospheric concentration is less than that of CO 2 and its lifetime in the atmosphere is limited to 10 to 12 years. It has a global warming potential approximately 25 times that of CO 2. Over the last 250 years, the concentration of CH 4 in the atmosphere has increased by 148 percent (IPCC, 2007), although emissions have declined from 1990 levels. Anthropogenic sources of CH 4 include enteric fermentation associated with domestic livestock, landfills, natural gas and petroleum systems, agricultural activities, coal mining, wastewater treatment, stationary and mobile combustion, and certain industrial processes (U.S. EPA, April 2012). Nitrous Oxide. Concentrations of nitrous oxide (N 2O) began to rise at the beginning of the industrial revolution and continue to increase at a relatively uniform growth rate (NOAA, 2010). N 2O is produced by microbial processes in soil and water, including those reactions that occur in fertilizers that contain nitrogen, fossil fuel combustion, and other chemical processes. Use of these fertilizers has increased over the last century. Agricultural soil management and mobile source fossil fuel combustion are the major sources of N 2O emissions. The GWP of nitrous oxide is approximately 298 times that of CO 2 (IPCC, 2007)
60 Pacific Pointe East Development Project EIR Section 4.3 Greenhouse Gas Emissions/Climate Change Fluorinated Gases (HFCS, PFCS and SF 6). Fluorinated gases, such as hydrofluorocarbons (HFCs), perfluorocarbons (PFCs), and sulfurhexafluoride (SF 6), are powerful GHGs that are emitted from a variety of industrial processes. Fluorinated gases are used as substitutes for ozonedepleting substances such as chlorofluorocarbons (CFCs), hydrochlorofluorocarbons (HCFCs), and halons, which have been regulated since the mid-1980s because of their ozone-destroying potential and are phased out under the Montreal Protocol (1987) and Clean Air Act Amendments of Electrical transmission and distribution systems account for most SF 6 emissions, while PFC emissions result from semiconductor manufacturing and as a by-product of primary aluminum production. Fluorinated gases are typically emitted in smaller quantities than CO 2, CH 4, and N 2O, but these compounds have much higher GWPs. SF 6 is the most potent GHG the IPCC has evaluated. Greenhouse Gas Emissions Inventory. Worldwide anthropogenic emissions of GHGs were approximately 40,000 million metric tons (MMT) CO 2E in 2004, including ongoing emissions from industrial and agricultural sources, but excluding emissions from land use changes (i.e., deforestation, biomass decay) (IPCC, 2007). CO 2 emissions from fossil fuel use accounts for 56.6 percent of the total emissions of 49,000 MMT CO 2E (includes land use changes) and CO 2 emissions from all sources account for 76.7 percent of the total CO 2E emitted. Methane emissions account for 14.3 percent of GHGs and N 2O emissions account for 7.9 percent (IPCC, 2007). Total U.S. GHG emissions were 6,821.8 MMT CO 2E in 2009 (U.S. EPA, April 2012). Total U.S. emissions have increased by 10.5 percent since 1990; emissions rose by 3.2 percent from 2009 to 2010 (U.S. EPA, April 2012). This increase was primarily due to (1) an increase in economic output resulting in an increase in energy consumption across all sectors; and (2) much warmer summer conditions resulting in an increase in electricity demand for air conditioning. Since 1990, U.S. emissions have increased at an average annual rate of 0.5 percent. In 2010, the transportation and industrial end-use sectors accounted for 32 percent and 26 percent of CO 2 emissions from fossil fuel combustion, respectively. Meanwhile, the residential and commercial end-use sectors accounted for 22 percent and 19 percent of CO 2 emissions from fossil fuel combustion, respectively (U.S. EPA, April 2012). Based upon the California Air Resources Board (ARB) California Greenhouse Gas Inventory for (CARB, October 2011), California produced 448 MMT CO 2E in The major source of GHG in California is transportation, contributing 38 percent of the state s total GHG emissions. Industrial activity is the second largest source, contributing 21 percent of the state s GHG emissions (CARB, October 2013). California emissions are due in part to its large size and large population compared to other states. However, a factor that reduces California s per capita fuel use and GHG emissions, as compared to other states, is its relatively mild climate. The CARB has projected statewide unregulated GHG emissions for the year 2020 will be 507 MMT CO 2E (ARB, August 2013). These projections represent the emissions that would be expected to occur in the absence of any GHG reduction actions. Potential Effects of Climate Change. Globally, climate change has the potential to affect numerous environmental resources through potential impacts related to future air temperatures and precipitation patterns. Scientific modeling predicts that continued GHG emissions at or above current rates would induce more extreme climate changes during the 21 st century than were observed during the 20 th century. Long-term trends have found that each of the past three 4.3-3
61 Pacific Pointe East Development Project EIR Section 4.3 Greenhouse Gas Emissions/Climate Change decades has been warmer than all the previous decades in the instrumental record, and the decade from 2000 through 2010 has been the warmest. The global combined land and ocean temperature data show an increase of about 0.89 C (0.69 C 1.08 C) over the period and about 0.72 C (0.49 C 0.89 C) over the period when described by a linear trend. Several independently analyzed data records of global and regional Land-Surface Air Temperature (LSAT) obtained from station observations are in agreement that LSAT as well as sea surface tempteratures have increased. In addition to these findings, there are identifiable signs that global warming is currently taking place, including substantial ice loss in the Arctic over the past two decades (IPCC, 2013). According to the CalEPA s 2010 Climate Action Team Biennial Report, potential impacts of climate change in California may include loss in snow pack, sea level rise, more extreme heat days per year, more high ozone days, more large forest fires, and more drought years (CalEPA, April 2010). While there is growing scientific consensus about the possible effects of climate change at a global and potentially statewide level, current scientific modeling tools are unable to predict what local impacts may occur with a similar degree of accuracy. In general, regional and local predictions are made based on downscaling statewide models (CalEPA, April 2010). Below is a summary of some of the potential effects that could be experienced in California as a result of climate change. Sea Level Rise. According to The Impacts of Sea-Level Rise on the California Coast, prepared by the California Climate Change Center (CCCC) (May 2009), climate change has the potential to induce substantial sea level rise in the coming century. The rising sea level increases the likelihood and risk of flooding. Sea levels are rising faster now than in the previous two millennia, and the rise is expected to accelerate, even with robust GHG emission control measures. The most recent IPCC report (2013) predicts a mean sea level rise of inches by This prediction is more than 50% higher than earlier projections of 7-23 inches, when comparing the same emissions scenarios and time periods. The previous IPCC report (2007) identified a sea level rise on the California coast over the past century of approximately eight inches. Based on the results of various global climate change models, sea level rise is expected to continue. The California Climate Adaptation Strategy (December 2009) estimates a sea level rise of up to 55 inches by the end of this century. Air Quality. Higher temperatures, which are conducive to air pollution formation, could worsen air quality in California. Climate change may increase the concentration of ground-level ozone, but the magnitude of the effect, and therefore its indirect effects, are uncertain. If higher temperatures are accompanied by drier conditions, the potential for large wildfires could increase, which, in turn, would further worsen air quality. However, if higher temperatures are accompanied by wetter, rather than drier conditions, the rains would tend to temporarily clear the air of particulate pollution and reduce the incidence of large wildfires, thereby ameliorating the pollution associated with wildfires. Additionally, severe heat accompanied by drier conditions and poor air quality could increase the number of heat-related deaths, illnesses, and asthma attacks throughout the state (California Energy Commission [CEC], March, 2009). Water Supply. Analysis of paleoclimatic data (such as tree-ring reconstructions of stream flow and precipitation) indicates a history of naturally and widely varying hydrologic conditions in California and the west, including a pattern of recurring and extended droughts
62 Pacific Pointe East Development Project EIR Section 4.3 Greenhouse Gas Emissions/Climate Change Uncertainty remains with respect to the overall impact of climate change on future water supplies in California. However, the average early spring snowpack in the Sierra Nevada decreased by about 10 percent during the last century, a loss of 1.5 million acre-feet of snowpack storage. During the same period, sea level rose eight inches along California s coast. California s temperature has risen 1 F, mostly at night and during the winter, with higher elevations experiencing the highest increase. Many Southern California cities have experienced their lowest recorded annual precipitation twice within the past decade. In a span of only two years, Los Angeles experienced both its driest and wettest years on record (California Department of Water Resources [DWR], 2008; CCCC, May 2009). This uncertainty complicates the analysis of future water demand, especially where the relationship between climate change and its potential effect on water demand is not well understood. The Sierra snowpack provides the majority of California's water supply by accumulating snow during the state s wet winters and releasing it slowly during the state s dry springs and summers. Based upon historical data and modeling DWR projects that the Sierra snowpack will experience a 25 to 40 percent reduction from its historic average by Climate change is also anticipated to bring warmer storms that result in less snowfall at lower elevations, reducing the total snowpack (DWR, 2008). Hydrology. As discussed above, climate change could potentially affect: the amount of snowfall, rainfall, and snow pack; the intensity and frequency of storms; flood hydrographs (flash floods, rain or snow events, coincidental high tide and high runoff events); sea level rise and coastal flooding; coastal erosion; and the potential for salt water intrusion. The rate of increase of global mean sea levels over the decade, as observed by satellites, ocean buoys and land gauges, was approximately 3.2 mm per year, which is double the observed 20 th century trend of 1.6 mm per year (World Meteorological Organization [WMO],2013). As a result, sea levels averaged over the last decade were about 8 inches higher than those of 1880 (WMO, 2013). Sea level rise may be a product of climate change through two main processes: expansion of sea water as the oceans warm and melting of ice over land. A rise in sea levels could result in coastal flooding and erosion and could jeopardize California s water supply due to salt water intrusion. Increased CO 2 emissions can cause oceans to acidify due to the carbonic acid it forms. Increased storm intensity and frequency could affect the ability of flood-control facilities, including levees, to handle storm events. Agriculture. California has a $30 billion annual agricultural industry that produces half of the country s fruits and vegetables. Higher CO 2 levels can stimulate plant production and increase plant water-use efficiency. However, if temperatures rise and drier conditions prevail, water demand could increase; crop-yield could be threatened by a less reliable water supply; and greater air pollution could render plants more susceptible to pest and disease outbreaks. In addition, temperature increases could change the time of year certain crops, such as wine grapes, bloom or ripen, and thereby affect their quality (CCCC, 2006). Ecosystems and Wildlife. Climate change and the potential resulting changes in weather patterns could have ecological effects on a global and local scale. Increasing concentrations of GHGs are likely to accelerate the rate of climate change. Scientists project that the average global surface temperature could rise by F ( C) in the next 50 years, and F ( C) in the next century, with substantial regional variation. Soil moisture is likely to 4.3-5
63 Pacific Pointe East Development Project EIR Section 4.3 Greenhouse Gas Emissions/Climate Change decline in many regions, and intense rainstorms are likely to become more frequent. Rising temperatures could have four major impacts on plants and animals: (1) timing of ecological events; (2) geographic range; (3) species composition within communities; and (4) ecosystem processes, such as carbon cycling and storage (Parmesan, 2004; Parmesan, C. and H. Galbraith, 2004). b. Regulatory Setting. The following regulations address both climate change and GHG emissions. International Regulations. The United States is, and has been, a participant in the United Nations Framework Convention on Climate Change (UNFCCC) since it was produced in The UNFCCC is an international environmental treaty with the objective of, stabilization of GHG concentrations in the atmosphere at a level that would prevent dangerous anthropogenic interference with the climate system. This is generally understood to be achieved by stabilizing global GHG concentrations between 350 and 400 ppm, in order to limit the global average temperature increases between 2 and 2.4 C above pre-industrial levels (IPCC, 2007). The UNFCC itself does not set limits on GHG emissions for individual countries or enforcement mechanisms. Instead, the treaty provides for updates, called protocols, that would identify mandatory emissions limits. Five years later, the UNFCC brought nations together again to draft the Kyoto Protocol (1997). The Kyoto Protocol established commitments for industrialized nations to reduce their collective emissions of six GHGs (CO 2, CH 4, N 2O, SF 6, HFCs, and PFCs) to 5.2 percent below 1990 levels by The United States is a signatory of the Kyoto Protocol, but Congress has not ratified it and the United States has not bound itself to the Protocol s commitments (UNFCCC, 2007). The first commitment period of the Kyoto Protocol ended in Governments, including 38 industrialized countries, agreed to a second commitment period of the Kyoto Protocol beginning January 1, 2013 and ending either on December 31, 2017 or December 31, 2020, to be decided by the Ad Hoc Working Group on Further Commitments for Annex I Parties under the Kyoto Protocol at its seventeenth session (UNFCCC, November 2011). In Durban (17 th session of the Conference of the Parties in Durban, South Africa, December 2011), governments decided to adopt a universal legal agreement on climate change as soon as possible, but not later than Work will begin on this immediately under a new group called the Ad Hoc Working Group on the Durban Platform for Enhanced Action. Progress was also made regarding the creation of a Green Climate Fund (GCF) for which a management framework was adopted (UNFCCC, December 2011; United Nations, September 2012). Federal Regulations. The United States is currently using a voluntary and incentivebased approach toward emissions reductions in lieu of the Kyoto Protocol s mandatory framework. The Climate Change Technology Program (CCTP) is a multi-agency research and development coordination effort (led by the Secretaries of Energy and Commerce) that is charged with carrying out the President s National Climate Change Technology Initiative (U.S. EPA, December 2007). However, the voluntary approach to address climate change and GHG emissions may be changing. The United States Supreme Court in Massachusetts et al. v. Environmental Protection Agency et al. ([2007] 549 U.S ) held that the U.S. EPA has the authority to regulate motor-vehicle GHG emissions under the federal Clean Air Act
64 Pacific Pointe East Development Project EIR Section 4.3 Greenhouse Gas Emissions/Climate Change The U.S. EPA issued a Final Rule for mandatory reporting of GHG emissions in October This Final Rule applies to fossil fuel suppliers, industrial gas suppliers, direct GHG emitters, and manufacturers of heavy-duty and off-road vehicles and vehicle engines, and requires annual reporting of emissions. The first annual reports for these sources were due in March On May 13, 2010, the U.S. EPA issued a Final Rule that took effect on January 2, 2011, setting a threshold of 75,000 metric tons (MT) CO 2E per year for GHG emissions. New and existing industrial facilities that meet or exceed that threshold will require a permit after that date. On November 10, 2010, the U.S. EPA published the PSD and Title V Permitting Guidance for Greenhouse Gases. The U.S. EPA s guidance document is directed at state agencies responsible for air pollution permits under the Federal Clean Air Act to help them understand how to implement GHG reduction requirements while mitigating costs for industry. It is expected that most states will use the U.S. EPA s new guidelines when processing new air pollution permits for power plants, oil refineries, cement manufacturing, and other large pollution point sources. On January 2, 2011, the U.S. EPA implemented the first phase of the Tailoring Rule for GHG emissions Title V Permitting. Under the first phase of the Tailoring Rule, all new sources of emissions are subject to GHG Title V permitting if they are otherwise subject to Title V for another air pollutant and they emit at least 75,000 MT CO 2E per year. Under Phase 1, no sources were required to obtain a Title V permit solely due to GHG emissions. Phase 2 of the Tailoring Rule went into effect July 1, At that time new sources were subject to GHG Title V permitting if the source emits 100,000 MT CO 2E per year, or they are otherwise subject to Title V permitting for another pollutant and emit at least 75,000 MT CO 2E per year. On July 3, 2012 the U.S. EPA issued the final rule that retains the GHG permitting thresholds that were established in Phases 1 and 2 of the GHG Tailoring Rule. These emission thresholds determine when Clean Air Act permits under the New Source Review Prevention of Significant Deterioration (PSD) and Title V Operating Permit programs are required for new and existing industrial facilities. California Regulations. California Air Resources Board (CARB) is responsible for the coordination and oversight of State and local air pollution control programs in California. Various statewide and local initiatives to reduce California s contribution to GHG emissions have raised awareness about climate change and its potential for severe long-term adverse environmental, social, and economic effects. Assembly Bill (AB) 1493 (2002), referred to as Pavley, requires CARB to develop and adopt regulations to achieve the maximum feasible and cost-effective reduction of GHG emissions from motor vehicles. On June 30, 2009, U.S. EPA granted the waiver of Clean Air Act preemption to California for its greenhouse gas emission standards for motor vehicles beginning with the 2009 model year. Pavley I took effect for model years starting in 2009 to 2016 and Pavley II, which is now referred to as LEV (Low Emission Vehicle) III GHG will cover 2017 to Fleet average emission standards would reach 22 percent reduction by 2012 and 30 percent by The Advanced Clean Cars program coordinates the goals of the Low Emissions Vehicles (LEV), Zero Emissions Vehicles (ZEV), and Clean Fuels Outlet programs and would provide major reductions in GHG emissions. By 2025, when the rules would be fully 4.3-7
65 Pacific Pointe East Development Project EIR Section 4.3 Greenhouse Gas Emissions/Climate Change implemented, new automobiles would emit 34% fewer GHGs. Statewide CO 2E emissions would be reduced by 3% by 2020 and by 12% by The reduction increases to 27% in 2035 and even further to a 33% reduction in 2050 (CARB, 2013). In 2005, former Governor Schwarzenegger issued Executive Order (EO) S-3-05, establishing statewide GHG emissions reduction targets. EO S-3-05 provides that by 2010, emissions shall be reduced to 2000 levels; by 2020, emissions shall be reduced to 1990 levels; and by 2050, emissions shall be reduced to 80 percent of 1990 levels (CalEPA, 2006). In response to EO S-3-05, CalEPA created the Climate Action Team (CAT), which in March 2006 published the Climate Action Team Report (the 2006 CAT Report ) (CalEPA, 2006). The 2006 CAT Report identified a recommended list of strategies that the state could pursue to reduce GHG emissions. These are strategies that could be implemented by various state agencies to ensure that the emission reduction targets in EO S-3-05 are met and can be met with existing authority of the state agencies. The strategies include the reduction of passenger and light duty truck emissions, the reduction of idling times for diesel trucks, an overhaul of shipping technology/infrastructure, increased use of alternative fuels, increased recycling, and landfill methane capture, etc. California s major initiative for reducing GHG emissions is outlined in Assembly Bill 32 (AB 32), the California Global Warming Solutions Act of 2006, signed into law in AB 32 codifies the statewide goal of reducing GHG emissions to 1990 levels by 2020 (essentially a 15% reduction below 2005 emission levels; the same requirement as under S-3-05), and requires CARB to prepare a Scoping Plan that outlines the main State strategies for reducing GHGs to meet the 2020 deadline. In addition, AB 32 requires CARB to adopt regulations to require reporting and verification of statewide GHG emissions. After completing a comprehensive review and update process, CARB approved a 1990 statewide GHG level and 2020 limit of 427 MMT CO 2E. The Scoping Plan was approved by CARB on December 11, 2008, and includes measures to address GHG emission reduction strategies related to energy efficiency, water use, and recycling and solid waste, among other measures. The Scoping Plan includes a range of GHG reduction actions that may include direct regulations, alternative compliance mechanisms, monetary and non-monetary incentives, voluntary actions, and market-based mechanisms. In early 2013, CARB initiated activities to update the AB 32 Scoping Plan. The 2013 Scoping Plan update will define CARB s climate change priorities and lay the groundwork to reach post-2020 goals set forth in EO S The update will highlight California s progress toward meeting the near-term 2020 GHG emission reduction goals defined in the original Scoping Plan (2008). It will also evaluate how to align the State's longer-term GHG reduction strategies with other State policy priorities, such as for water, waste, natural resources, clean energy and transportation, and land use (CARB, 2013). EO S was enacted on January 18, The order mandates that a Low Carbon Fuel Standard ( LCFS ) for transportation fuels be established for California to reduce the carbon intensity of California s transportation fuels by at least 10 percent by
66 Pacific Pointe East Development Project EIR Section 4.3 Greenhouse Gas Emissions/Climate Change Senate Bill (SB) 97, signed in August 2007, acknowledges that climate change is an environmental issue that requires analysis in California Environmental Quality Act (CEQA) documents. In March 2010, the California Resources Agency (Resources Agency) adopted amendments to the State CEQA Guidelines for the feasible mitigation of GHG emissions or the effects of GHG emissions. The adopted guidelines give lead agencies the discretion to set quantitative or qualitative thresholds for the assessment and mitigation of GHGs and climate change impacts. CARB Resolution establishes 25,000 MT of GHG emissions as the threshold for identifying the largest stationary emission sources in California for purposes of requiring the annual reporting of emissions. This threshold is just over percent of California s total inventory of GHG emissions for Senate Bill (SB) 375, signed in August 2008, enhances the state s ability to reach AB 32 goals by directing CARB to develop regional GHG emission reduction targets to be achieved from vehicles for 2020 and In addition, SB 375 directs each of the state s 18 major Metropolitan Planning Organizations (MPO) to prepare a sustainable communities strategy (SCS) that contains a growth strategy to meet these emission targets for inclusion in the Regional Transportation Plan (RTP). On September 23, 2010, CARB adopted final regional targets for reducing GHG emissions from 2005 levels by 2020 and The Southern California Association of Governments (SCAG) was assigned targets of an 8 percent reduction in GHGs from transportation sources by 2020 and a 13 percent reduction in GHGs from transportation sources by In the SCAG region, SB 375 also provides the option for the coordinated development of subregional plans by the subregional councils of governments and the county transportation commissions to meet SB 375 requirements. In April 2011, Governor Brown signed SB 2X requiring California to generate 33 percent of its electricity from renewable energy by For more information on the Senate and Assembly Bills, Executive Orders, and reports discussed above, and to view reports and research referenced above, please refer to the following websites: and California Environmental Quality Act. Pursuant to the requirements of SB 97, the Resources Agency has adopted amendments to the State CEQA Guidelines for the feasible mitigation of GHG emissions or the effects of GHG emissions. As noted previously, the adopted CEQA Guidelines provide general regulatory guidance on the analysis and mitigation of GHG emissions in CEQA documents, while giving lead agencies the discretion to set quantitative or qualitative thresholds for the assessment and mitigation of GHGs and climate change impacts. To date, the Bay Area Air Quality Management District (BAAQMD), the South Coast Air Quality Management District (SCAQMD), the San Luis Obispo Air Pollution Control District (SLOAPCD), and the San Joaquin Air Pollution Control District (SJVAPCD) have adopted quantitative significance thresholds for GHGs. On March 5, 2012 the Alameda County Superior Court issued a judgment finding that the BAAQMD had failed to comply with CEQA when it adopted the thresholds contained in the BAAQMD s 2010 CEQA Guidelines. The BAAQMD was ordered to set aside the thresholds and is no longer recommending that these thresholds be used as a general measure of a project s significant air quality impacts. In August 2013, the First 4.3-9
67 Pacific Pointe East Development Project EIR Section 4.3 Greenhouse Gas Emissions/Climate Change District Court of Appeal overturned the trial court and held that the thresholds of significance adopted by the BAAQMD were not subject to CEQA review. The California Supreme Court has agreed to hear an appeal of this case. The case is currently being briefed and the matter is still pending. Thus, BAAQMD will not issue a further recommendation until this litigation is complete Impact Analysis a. Methodology and Significance Thresholds. Pursuant to the requirements of SB 97, the Resources Agency adopted amendments to the State CEQA Guidelines for the feasible mitigation of GHG emissions or the effects of GHG emissions in March These guidelines are used in evaluating the cumulative significance of GHG emissions from the proposed project. According to the adopted CEQA Guidelines, impacts related to GHG emissions from the proposed project would be significant if the project would: Generate greenhouse gas emissions, either directly or indirectly, that may have a significant impact on the environment; and/or Conflict with an applicable plan, policy or regulation adopted for the purpose of reducing the emissions of greenhouse gases. The vast majority of individual projects do not generate sufficient GHG emissions to create a project-specific impact through a direct influence to climate change; therefore, the issue of climate change typically involves an analysis of whether a project s contribution towards an impact is cumulatively considerable. Cumulatively considerable means that the incremental effects of an individual project are significant when viewed in connection with the effects of past projects, other current projects, and probable future projects (CEQA Guidelines, Section 15355). For industrial projects the South Coast Air Quality Management District has established a threshold of 10,000 metric tons CO 2E/year (SCAQMD. 2011). Therefore, the proposed project s contribution to cumulative impacts related to GHG emissions and climate change would be cumulatively considerable if the project would produce in excess of 10,000 metric tons CO 2E/year. Study Methodology. Calculations of CO 2, CH 4, and N 2O emissions are provided to identify the magnitude of potential project effects. The analysis focuses on CO 2, CH 4, and N 2O because these make up 98.9 percent of all GHG emissions by volume (IPCC, 2007) and are the GHG emissions that the project would emit in the largest quantities. Fluorinated gases, such as HFCs, PFCs, and SF 6, were also considered for the analysis. However, the potential for future occupants of the proposed industrial structures is unknown at this time, and to forecast emissions of fluorinated gases would be necessarily speculative. Emissions of all GHGs are converted into their equivalent weight in CO 2 (CO 2E). Minimal amounts of other main GHGs (such as chlorofluorocarbons [CFCs]) would be emitted; however, these other GHG emissions would not substantially add to the calculated CO 2E amounts. Calculations are based on the methodologies discussed in the California Air Pollution Control Officers Association (CAPCOA) CEQA and Climate Change white paper (January 2008) and included the use of the California Climate Action Registry (CCAR) General Reporting Protocol (January 2009)
68 Pacific Pointe East Development Project EIR Section 4.3 Greenhouse Gas Emissions/Climate Change On-Site Operational Emissions. Operational emissions from energy use (electricity and natural gas use) for the project were estimated using the California Emissions Estimator Model (CalEEMod) 2011 Version software program (see Appendix 4.2 for calculations). The default values on which the CalEEMod software program are based include the CEC-sponsored California Commercial End Use Survey (CEUS) and Residential Appliance Saturation Survey (RASS) studies. CalEEMod provides operational emissions of CO 2, N 2O and CH 4. This methodology is considered reasonable and reliable for use, as it has been subjected to peer review by numerous public and private stakeholders, and in particular by the CEC. It is also recommended by CAPCOA (January 2008). Emissions associated with area sources, including consumer products, landscape maintenance, and architectural coating were calculated in CalEEMod and utilize standard emission rates from CARB, U.S. EPA, and district supplied emission factor values (CalEEMod User Guide, 2013). Emissions from waste generation were also calculated in CalEEMod and are based on the IPCC s methods for quantifying GHG emissions from solid waste using the degradable organic content of waste (CalEEMod User Guide, 2013). Waste disposal rates by land use and overall composition of municipal solid waste in California was primarily based on data provided by the California Department of Resources Recycling and Recovery (CalRecycle). Emissions from water and wastewater usage calculated in CalEEMod were based on the default electricity intensity from the CEC s 2006 Refining Estimates of Water-Related Energy Use in California using the average values for Northern and Southern California. Direct Emissions from Mobile Combustion. Emissions of CO 2 and CH 4 from transportation sources for the proposed project were quantified using the CalEEMod software model. Because the CalEEMod software program does not calculate N 2O emissions from mobile sources, N 2O emissions were quantified using the California Climate Action Registry General Reporting Protocol (January 2009) direct emissions factors for mobile combustion (see Appendix X for calculations). The estimate of total daily trips associated with the proposed project was based on the standard Institute of Transportation Engineers (ITE) vehicle trip rates and was calculated and extrapolated to derive total annual mileage in CalEEMod. Emission rates for N 2O emissions were based on the vehicle mix output generated by CalEEMod and the emission factors found in the California Climate Action Registry General Reporting Protocol. A limitation of the quantitative analysis of emissions from mobile combustion is that emission models, such as CalEEMod, evaluate aggregate emissions, meaning that all vehicle trips and related emissions assigned to a project are assumed to be new trips and emissions generated by the project itself. Such models do not demonstrate, with respect to a regional air quality impact, what proportion of these emissions are actually new emissions, specifically attributable to the project in question. For most projects, the main contributor to regional air quality emissions is from motor vehicles; however, the quantity of vehicle trips appropriately characterized as new is usually uncertain as traffic associated with a project may be relocated trips from other locales. In other words, vehicle trips associated with the project may include trips relocated from other existing locations. Therefore, because the proportion of new versus relocated trips is unknown, the VMT estimate generated by CalEEMod is used as a conservative, worst-case estimate
69 Pacific Pointe East Development Project EIR Section 4.3 Greenhouse Gas Emissions/Climate Change Construction Emissions. Although construction activity is addressed in this analysis, CAPCOA does not discuss whether any of the suggested threshold approaches (as discussed below in GHG Cumulative Significance) adequately address impacts from temporary construction activity. As stated in the CEQA and Climate Change white paper, more study is needed to make this assessment or to develop separate thresholds for construction activity (CAPCOA, 2008). Nevertheless, air districts such as the SCAQMD (2011) have recommended amortizing construction-related emissions over a 30-year period in conjunction with the proposed project s operational emissions. Construction of the proposed project would generate temporary GHG emissions primarily due to the operation of construction equipment and truck trips. Site preparation and grading typically generate the greatest amount of emissions due to the use of grading equipment and soil hauling. The CalEEMod software program was used to estimate emissions associated with the construction period, based on parameters such as the duration of construction activity, area of disturbance, and anticipated equipment use during construction. Complete results from CalEEMod and assumptions can be viewed in Appendix B. b. Project Impacts and Mitigation Measures. Impact GHG-1 Development that could potentially occur under the proposed project would generate additional GHG emissions beyond existing conditions. However, GHG emissions generated would not exceed proposed SCAQMD significance thresholds. Impacts would therefore be Class III, less than significant. As stated above, GHG emissions for potential buildout of the proposed project site were calculated using CalEEMod based on the project s construction schedule and the type of development proposed. The following summarizes the project s overall GHG emissions (see Appendix 4.2 for full CalEEMod worksheets). Construction Emissions. The project applicant s construction plan indicates that construction would occur in phases over approximately one year. Based on the CalEEMod results, construction activity facilitated by the proposed project would generate an estimated 1,348 metric tons of CO 2E (as shown in Table 4.3-1). Amortized over a 30-year period (the assumed life of the project), construction facilitated by the project would generate an estimated metric tons of CO 2E per year. Operational Indirect and Stationary Direct Emissions. Area Source Emissions. CalEEMod was used to calculate direct sources of air emissions located at the project site. This includes consumer product use, architectural coatings, and landscape maintenance equipment. CalEEMod results determined that area source emissions associated with the proposed project would result from landscaping maintenance activities. As shown in Table 4.3-2, landscaping associated with the project would generate approximately metric tons CO 2E per year
70 Pacific Pointe East Development Project EIR Section 4.3 Greenhouse Gas Emissions/Climate Change Table Estimated Construction Emissions of Greenhouse Gases Emission Source Emissions (metric tons) Annual Emissions CO 2E Carbon Dioxide (CO 2) 1 1, , metric tons Methane (CH 4) metric tons Nitrous Oxide (N 2O) metric tons Total 1,348 metric tons Amortized over 30 years metric tons per year See Appendix B for calculations and for GHG emission factor assumptions. Table Estimated Annual Area Source Greenhouse Gas Emissions Emission Source Landscaping Total Annual Emissions CO 2E metric tons metric tons See Appendix B for calculations and for GHG emission factor assumptions. Energy Use. Operation of the proposed new buildings would consume both electricity and natural gas. The generation of electricity through combustion of fossil fuels typically yields CO 2, and to a smaller extent, N 2O and CH 4. As discussed above, annual electricity and natural gas emissions can be calculated using default values from the CEC sponsored CEUS and RASS studies which are built into the CalEEMod model. As shown in Table 4.3-3, electricity consumption associated with the project would generate approximately 1,710 metric tons CO 2E per year. Natural gas use would generate approximately 499 metric tons CO 2E per year. Thus, overall energy use at the project site would generate approximately 2,209 metric tons CO 2E per year. Table Estimated Annual Energy-Related Greenhouse Gas Emissions Emission Source Electricity Natural Gas Total Annual Emissions CO 2E 1,710 metric tons 499 metric tons 2,209 metric tons See Appendix B for calculations and for GHG emission factor assumptions
71 Pacific Pointe East Development Project EIR Section 4.3 Greenhouse Gas Emissions/Climate Change Solid Waste Emissions. It is anticipated that the development facilitated by the proposed project would generate approximately 613 tons of solid waste per year according to the CalEEMod output. As shown in Table 4.3-4, based on this estimate, this aspect of the project would generate approximately 279 metric tons of CO 2E per year. Table Estimated Annual Solid Waste Greenhouse Gas Emissions Emission Source Annual Emissions CO 2E Solid Waste 279 metric tons See Appendix B for calculations and for GHG emission factor assumptions. Water Use Emissions. It is anticipated that the project would use approximately 114 million gallons of water per year, based on CalEEMod water demand assumptions. Based on the amount of electricity generated in order to supply this amount of water, as shown in Table 4.3-5, this aspect of the project would generate approximately 569 metric tons of CO 2E per year. Table Estimated Greenhouse Gas Emissions from Water Use Emission Source Water Use Annual Emissions CO 2E 569 metric tons See Appendix B for calculations and for GHG emission factor assumptions. Transportation Emissions. Mobile source GHG emissions were estimated using the project s traffic study prepared by LLG (March 2014) and by the total vehicle miles traveled (VMT) estimated in CalEEMod. Based on the CalEEMod estimate, the proposed project would generate approximately 11,515,989 annual VMT. Table shows the estimated mobile emissions of GHGs for the project based on the estimated annual VMT. As noted above, the CalEEMod model does not calculate N2O emissions related to mobile sources. As such, N2O emissions were calculated based on the project s VMT using calculation methods provided by the California Climate Action Registry General Reporting Protocol (January 2009). As shown in Table 4.3-6, the project would result in approximately 5,075 metric tons of CO 2E associated with mobile emissions
72 Pacific Pointe East Development Project EIR Section 4.3 Greenhouse Gas Emissions/Climate Change Table Estimated Annual Mobile Emissions of Greenhouse Gases Emission Source Mobile Emissions (CO 2 & CH 4) 1 Mobile Emissions (N 2O) 2 Total Annual Emissions CO 2E 5,047 metric tons 0 metric tons 5,047 metric tons 1 See Appendix B for calculations in CalEEMod Model output from Air Quality Analysis Combined Construction, Stationary and Mobile Source Emissions. Table combines the construction, operational and mobile GHG emissions associated with onsite development for the proposed project. Construction emissions associated with construction activity (approximately 432 metric tons CO 2E) are amortized over 30 years (the anticipated life of the project). For the proposed project, the combined annual emissions would total approximately 8,148 metric tons CO 2E/year. This total represents less than percent of California s total 2004 emissions of 492 million metric tons. These emission projections indicate that the majority of the project s GHG emissions are associated with vehicular travel (85 percent). However, as noted above, mobile emissions are in part a redirection of existing travel to other locations, and so are to some extent already a part of the total California GHG emissions. Neither the SCAQMD or the have adopted formal GHG emissions thresholds that apply to land use projects and no GHG emissions reduction plan have been adopted in Long Beach. Therefore, the proposed project is evaluated based on the SCAQMD s recommended/preferred option threshold for mixed land use types of 10,000 metric tons CO 2E per year (SCAQMD, Proposed Tier 3 Quantitative Thresholds Option 1, September 2010). Table Combined Annual Emissions of Greenhouse Gases Emission Source Construction Operational Area Energy Solid Waste Water Mobile Total Annual Emissions CO 2E metric tons metric tons 2,209 metric tons 279 metric tons 569 metric tons 5,047 metric tons 8,148 metric tons Sources: See Appendix B for calculations and for GHG emission factor assumptions
73 Pacific Pointe East Development Project EIR Section 4.3 Greenhouse Gas Emissions/Climate Change Implementation of the proposed project would generate GHG emissions beyond existing conditions. However, because the total amount of GHG emissions would be lower than the threshold of 10,000 metric tons per year, impacts from GHG emissions would be less than significant. Mitigation Measures. The proposed project would result in less than 10,000 metric tons CO 2E per year; therefore, no mitigation is necessary. Significance after Mitigation. Impacts would be less than significant without mitigation. Impact GHG-2 The proposed project would be consistent with the Climate Action Team GHG reduction strategies and the SCAG Sustainable Communities Strategy. Impacts related to consistency with GHG plans and policies would therefore be Class III, less than significant. The proposed project would be generally consistent with applicable regulations or plans addressing greenhouse gas reductions. As indicated above, the CAT published the Climate Action Team Report to Governor Schwarzenegger and the Legislature (the 2006 CAT Report ) in March The CAT Report identifies a recommended list of strategies that the State could pursue to reduce climate change greenhouse gas emissions. The CAT strategies are recommended to reduce GHG emissions at a statewide level to meet the goals of the Executive Order S These are strategies that could be implemented by various State agencies to ensure that the Governor s targets are met and can be met with existing authority of the State agencies. The adopted a Sustainable City Action Plan in This plan contains goals intended to support sustainable development within the City. Implementation of this plan would contribute to a reduction in the City s overall GHG emissions. Tables through illustrate that the proposed project would be consistent with the GHG reduction strategies set forth by the 2006 CAT Report and the SCAG SCS. Therefore, additional mitigation measures would not be required. The SCAG SCS contains a number of strategies that relate to the operations of SCAG and regional land use planning. Since such strategies lie beyond the scope of individual development projects, only those strategies applicable to the proposed project are addressed
74 Pacific Pointe East Development Project EIR Section 4.3 Greenhouse Gas Emissions/Climate Change Table Project Consistency with Applicable Climate Action Team Greenhouse Gas Emission Reduction Strategies Strategy Project Consistency California Air Resources Board Vehicle Climate Change Standards AB 1493 (Pavley) required the state to develop and adopt regulations that achieve the maximum feasible and cost-effective reduction of climate change emissions emitted by passenger vehicles and light duty trucks. Regulations were adopted by the CARB in September Diesel Anti-Idling The CARB adopted a measure to limit diesel-fueled commercial motor vehicle idling in July Hydrofluorocarbon Reduction 1) Ban retail sale of HFC in small cans. 2) Require that only low GWP refrigerants be used in new vehicular systems. 3) Adopt specifications for new commercial refrigeration. 4) Add refrigerant leak-tightness to the pass criteria for vehicular inspection and maintenance programs. 5) Enforce federal ban on releasing HFCs. Alternative Fuels: Biodiesel Blends ARB would develop regulations to require the use of 1 to 4% biodiesel displacement of California diesel fuel. Alternative Fuels: Ethanol Increased use of E-85 fuel. Heavy-Duty Vehicle Emission Reduction Measures Increased efficiency in the design of heavy duty vehicles and an education program for the heavy duty vehicle sector. Achieve 50% Statewide Recycling Goal Achieving the State s 50% waste diversion mandate as established by the Integrated Waste Management Act of 1989, (AB 939, Sher, Chapter 1095, Statutes of 1989), will reduce climate change emissions associated with energy intensive material extraction and production as well as methane emission from landfills. A diversion rate of 48% has been achieved on a statewide basis. Therefore, a 2% additional reduction is needed. Consistent The vehicles that travel to and from the project site on public roadways would be in compliance with CARB vehicle standards that are in effect at the time of vehicle purchase. Consistent Current State law restricts diesel truck idling to five minutes or less. Diesel trucks operating from and making deliveries to the project site are subject to this state-wide law. Construction vehicles are also subject to this regulation. Consistent This strategy applies to consumer products. All applicable products would be required to comply with the regulations that are in effect at the time of manufacture. Consistent The diesel vehicles such as construction vehicles that travel to and from the project site on public roadways could utilize this fuel once it is commercially available. Consistent Employees working at the project site could choose to purchase flex-fuel vehicles and utilize this fuel, which is currently available at locations in Norwalk, approximately 8 miles northeast of the project site. Consistent The heavy-duty vehicles for construction activities that travel to and from the project site on public roadways would be subject to all applicable CARB efficiency standards that are in effect at the time of vehicle manufacture. Consistent According to data provided by CalRecycle, the City of Long Beach met its target disposal rates for both per resident and per employee metrics. Based on data for 2011 (the most recent year for which approved data is available), the City s per resident disposal rate was 3.8 pounds per day (ppd), half of the City s 7.6 ppd target and the City s per employee disposal rate was 11.8 ppd, less than half of the 25.1 ppd target. The City has implemented more than 40 programs designed to sustain these disposal rates
75 Pacific Pointe East Development Project EIR Section 4.3 Greenhouse Gas Emissions/Climate Change Table Project Consistency with Applicable Climate Action Team Greenhouse Gas Emission Reduction Strategies Strategy Project Consistency Zero Waste High Recycling Efforts to exceed the 50% goal would allow for additional reductions in climate change emissions. Consistent As described above it is anticipated that the proposed project would participate in waste diversion programs. The project would also be subject to all applicable State and City requirements for solid waste reduction as they change in the future. Department of Forestry Urban Forestry A new statewide goal of planting 5 million trees in urban areas by 2020 would be achieved through the expansion of local urban forestry programs. Consistent Landscaping for new structures would result in additional planted trees throughout the project site. Department of Water Resources Water Use Efficiency Approximately 19% of all electricity, 30% of all natural gas, and 88 million gallons of diesel are used to convey, treat, distribute and use water and wastewater. Increasing the efficiency of water transport and reducing water use would reduce greenhouse gas emissions. Consistent The new proposed structures would be required to be consistent with CalGreen standards. As such, the proposed project would be equipped with low-flow plumbing fixtures, reducing water use. Energy Commission (CEC) Building Energy Efficiency Standards in Place and in Progress Public Resources Code authorizes the CEC to adopt and periodically update its building energy efficiency standards (that apply to newly constructed buildings and additions to and alterations to existing buildings). Appliance Energy Efficiency Standards in Place and in Progress Public Resources Code authorizes the Energy Commission to adopt and periodically update its appliance energy efficiency standards (that apply to devices and equipment using energy that are sold or offered for sale in California). Fuel-Efficient Replacement Tires & Inflation Programs State legislation established a statewide program to encourage the production and use of more efficient tires. Municipal Utility Energy Efficiency Programs/Demand Response Includes energy efficiency programs, renewable portfolio standard, combined heat and power, and transitioning away from carbon-intensive generation. Consistent The proposed project would need to comply with the standards of Title 24 that are in effect at the time of development. The project would be equipped with equipment (e.g. HVAC systems), lighting fixtures, and lighting that meets Title 24 requirements. Consistent Under State law, appliances that are purchased for the project - both pre- and post-development would be consistent with energy efficiency standards that are in effect at the time of manufacture. Consistent Employees working at the project site could purchase tires for their vehicles that comply with state programs for increased fuel efficiency. Not applicable, but project development would not preclude the implementation of this strategy by municipal utility providers
76 Pacific Pointe East Development Project EIR Section 4.3 Greenhouse Gas Emissions/Climate Change Table Project Consistency with Applicable Climate Action Team Greenhouse Gas Emission Reduction Strategies Strategy Municipal Utility Renewable Portfolio Standard California s Renewable Portfolio Standard (RPS), established in 2002, requires that all load serving entities achieve a goal of 20% of retail electricity sales from renewable energy sources by 2017, within certain cost constraints. Municipal Utility Combined Heat and Power Cost effective reduction from fossil fuel consumption in the commercial and industrial sector through the application of on-site power production to meet both heat and electricity loads. Alternative Fuels: Non-Petroleum Fuels Increasing the use of non-petroleum fuels in California s transportation sector, as recommended as recommended in the CEC s 2 and 2005 Integrated Energy Policy Reports. Green Buildings Initiative Green Building Executive Order, S (CA 2004), sets a goal of reducing energy use in public and private buildings by 20% by the year 2015, as compared with 2 levels. The Executive Order and related action plan spell out specific actions state agencies are to take with state-owned and -leased buildings. The order and plan also discuss various strategies and incentives to encourage private building owners and operators to achieve the 20% target. Project Consistency Not applicable, but the project would not preclude the implementation of this strategy by Southern California Edison. Not applicable since this strategy addresses incentives that could be provided by utility providers such as Southern California Edison and The Gas Company. Consistent Employees working at the project site could choose to purchase flex-fuel vehicles and utilize this fuel, which is currently available at locations in Norwalk, approximately 8 miles northeast of the project site. Consistent As discussed previously, the project would be required to be constructed in compliance with the standards of Title 24 that are in effect at the time of development. The 2013 Title 24 standards, which will take effect on July 1, 2014, improve nonresidential energy efficiency by 30 percent compared to the current 2008 standards. Business, Transportation and Housing Smart Land Use and Intelligent Transportation Systems (ITS) Smart land use strategies encourage jobs/housing proximity, promote transit-oriented development, and encourage high-density residential/commercial development along transit corridors. Consistent The proposed project would provide employment opportunities near existing residential and educational uses. The project site is accessible via existing bus transit facilities. For example, Long Beach Transit bus route 111 has a stop at Conant Street and Lakewood Boulevard. ITS is the application of advanced technology systems and management strategies to improve operational efficiency of transportation systems and movement of people, goods and services. The Governor is finalizing a comprehensive 10-year strategic growth plan with the intent of developing ways to promote, through state investments, incentives and technical assistance, land use, and technology strategies that provide for a prosperous economy, social equity and a quality environment. Smart land use, demand management, ITS, and value pricing are critical elements in this plan for improving mobility and transportation efficiency. Specific strategies include: promoting jobs/housing proximity
77 Pacific Pointe East Development Project EIR Section 4.3 Greenhouse Gas Emissions/Climate Change Table Project Consistency with Applicable Climate Action Team Greenhouse Gas Emission Reduction Strategies Strategy Project Consistency and transit-oriented development; encouraging high density residential/commercial development along transit/rail corridor; valuing and congestion pricing; implementing intelligent transportation systems, traveler information/traffic control, incident management; accelerating the development of broadband infrastructure; and comprehensive, integrated, multimodal/intermodal transportation planning. Public Utilities Commission (PUC) Accelerated Renewable Portfolio Standard The Governor has set a goal of achieving 33% renewable in the State s resource mix by The joint PUC/Energy Commission September 2005 Energy Action Plan II (EAP II) adopts the 33% goal. California Solar Initiative The solar initiative includes installation of 1 million solar roofs or an equivalent 3,000 MW by 2017 on homes and businesses, increased use of solar thermal systems to offset the increasing demand for natural gas, use of advanced metering in solar applications, and creation of a funding source that can provide rebates over 10 years through a declining incentive schedule. Not applicable, but project development would not preclude the implementation of this strategy by energy providers. Consistent The proposed project does not include solar power generation. However, the project does not preclude the installation of photovoltaic systems in the future. Table Project Consistency with Applicable SCAG SCS Greenhouse Gas Emission Reduction Strategies Strategy Project Consistency Land Use Actions and Strategies Encourage the use of range-limited battery electric and other alternative fueled vehicles through policies and programs, such as, but not limited to, neighborhood oriented development, complete streets, and Electric (and other alternative fuel) Vehicle Supply Equipment in public parking lots. Support projects, programs, policies and regulations that encourage the development of complete communities, which includes a diversity of housing choices and educational opportunities, jobs for a variety of skills and education, recreation and culture, and a full-range of shopping, entertainment and services all within a relatively short distance. Consistent Employees working at the project site could choose to purchase flex-fuel vehicles and utilize this fuel, which is currently available at locations in Norwalk, approximately 8 miles northeast of the project site. Consistent The proposed project is located in a highly urbanized area and in close proximity to existing residential and educational development. Existing public transit facilities are located near the project site. The proposed project would be consistent with efforts to provide employment opportunities near residential areas, and with programs intended to support the use of alternative transit modes, including non-auto (e.g., walking, bicycles) and public transportation
78 Pacific Pointe East Development Project EIR Section 4.3 Greenhouse Gas Emissions/Climate Change Table Project Consistency with Applicable SCAG SCS Greenhouse Gas Emission Reduction Strategies Strategy Project Consistency Transportation Network Actions and Strategies Expand the use of transit modes in our subregions such as BRT, rail, limited-stop service, and point-to-point express services utilizing the HOV and HOT lane networks. Encourage transit providers to increase frequency and span of service in TOD/HQTA and along targeted corridors where cost-effective and where there is latent demand for transit usage. Prioritize transportation investments to support compact infill development that includes a mix of land uses, housing options, and open/park space, where appropriate, to maximize the benefits for existing communities, especially vulnerable populations, and to minimize any negative impacts. Explore and implement innovative strategies and projects that enhance mobility and air quality, including those that increase the walkability of communities and accessibility to transit via non-auto modes, including walking, bicycling, and neighborhood electric vehicles (NEVs) or other alternative fueled vehicles. Collaborate with local jurisdictions to plan and develop residential and employment development around current and planned transit stations and neighborhood commercial centers. Develop first-mile/last-mile strategies on a local level to provide an incentive for making trips by transit, bicycling, walking, or neighborhood electric vehicle or other ZEV options. Consistent The proposed project is located in a highly urbanized area and in close proximity to existing public transit facilities. The proposed project would be consistent with efforts to support the use of alternative transit modes, including non-auto (e.g., walking, bicycles) and public transportation. Consistent The proposed project is located in a highly urbanized area and in close proximity to existing public transit facilities. The proposed project would be consistent with efforts to support the use of public transportation. Consistent The proposed project is located in an area surrounded by existing development, and would add employment-generating uses. As such, the project would be infill development and would provide jobs in an area with an existing residential population. Consistent The proposed project is located in a highly urbanized area and in close proximity to existing residential and educational development. Existing public transit facilities are located near the project site. The proposed project would be consistent with efforts to provide employment opportunities near residential areas, and with programs intended to support the use of alternative transit modes, including non-auto (e.g., walking, bicycles) and public transportation. Consistent The proposed project is located in a highly urbanized area and in close proximity to existing public transit facilities. The proposed project would be consistent with efforts to support the use of public transportation. Consistent The proposed project is located in a highly urbanized area and in close proximity to existing residential and educational development. Existing public transit facilities are located near the project site. The proposed project would be consistent with efforts to provide employment opportunities near residential areas, and with programs intended to support the use of alternative transit modes, including non-auto (e.g., walking, bicycles) and public transportation. Transportation Demand Management Actions and Strategies Support work-based programs that encourage emission reduction strategies and incentivize active transportation commuting or ride-share modes. Consistent Occupants of the project site could implement ridesharing or other commuting programs intended to reduce emissions from motor vehicles
79 Pacific Pointe East Development Project EIR Section 4.3 Greenhouse Gas Emissions/Climate Change Table Project Consistency with Applicable SCAG SCS Greenhouse Gas Emission Reduction Strategies Strategy Encourage the development of telecommuting programs by employers through review and revision of policies that may discourage alternative work options. Consistent Project Consistency Occupants of the project site could implement telecommuting programs as appropriate. Clean Vehicle Technology Actions and Strategies Develop a Regional PEV Readiness Plan with a focus on charge port infrastructure plans to support and promote the introduction of electric and other alternative fuel vehicles in Southern California. Not applicable, but project development would not preclude the implementation of this strategy. Table Project Consistency with Applicable Long Beach Sustainable City Action Plan Goals Goal Project Consistency Buildings and Neighborhoods At least 5 million square feet of privately developed LEED certified (or equivalent) green buildings by 2020 Plant at least 10,000 trees in Long Beach by 2020 Consistent The proposed project is not currently designed to qualify for LEED certification. However, the project includes sustainability features that would be compatible with the general aims of LEED certification, such as being infill development, being located near public transit stops, and providing bicycle racks. The proposed project would not conflict with the implementation of this goal. Consistent 50% of Long Beach residents work in Long Beach by 2020 Consistent Energy Landscaping for new structures would result in additional planted trees throughout the project site. The proposed project would provide employment opportunities for City residents. Reduce community electricity use by 15% by 2020 Reduce community natural gas use by 10 % by 2020 Consistent The proposed project would comply with the most recent Title 24 energy efficiency requirements, which would
80 Pacific Pointe East Development Project EIR Section 4.3 Greenhouse Gas Emissions/Climate Change Table Project Consistency with Applicable Long Beach Sustainable City Action Plan Goals Goal Project Consistency increase energy efficiency. The 2013 Title 24 standards, which will take effect on July 1, 2014, improve nonresidential energy efficiency by 30 percent compared to the current 2008 standards Facilitate the development of at least 8 Megawatts of solar energy within the community (private rooftops) by Consistent Current project designs do not include, but do not preclude, the installation of photovoltaic electricity generation systems on project roofs. However, the proposed project would not impair the implementation of this goal. Transportation Increase public transit ridership by 25% by 2016 Increase bike ridership from 1% to 10% by 2016 Annual reduction in average pounds of solid waste generated per person per day Consistent The proposed project is infill development in an area served by existing public transit lines and within 0.25 mile of existing transit stops. The project site is located within 0.25 mile of existing residential development, and would provide bicycle racks to support bicycle commuting. Consistent According to data provided by CalRecycle, the City of Long Beach met its target disposal rates for both per resident and per employee metrics. Based on data for 2011 (the most recent year for which approved data is available), the City s per resident disposal rate was 3.8 pounds per day (ppd), half of the City s 7.6 ppd target and the City s per employee disposal rate was 11.8 ppd, less than half of the 25.1 ppd target. The City has implemented more than 40 programs designed to sustain these disposal rates. The proposed project would comply with City programs intended to continue solid waste diversion. As indicated in tables through 4.3-9, the proposed project would be consistent with CAT strategies, SCAG S SCS GHG emission reduction strategies, and the Long Beach Sustainable City Action Plan Goals. Therefore, the proposed project would be consistent with the objectives
81 Pacific Pointe East Development Project EIR Section 4.3 Greenhouse Gas Emissions/Climate Change of AB 32, SB 97, and SB 375, and its contribution to cumulative GHG emissions and climate change would not be significant. Mitigation Measures. As specified above, the proposed project would be consistent with the 2006 CAT Report and the SCAG SCS; therefore, no mitigation is necessary. Significance after Mitigation. Impacts would be less than significant without mitigation. c. Cumulative Impacts. As discussed in Section 3.0, Environmental Setting, cumulative development in Long Beach, including development facilitated by the proposed project, would add dwelling units and non-residential development that would generate GHGs from vehicle trips and other sources. Analyses of GHGs are cumulative in nature, as they affect the accumulation of greenhouse gases in the atmosphere. Projects falling below the impact thresholds discussed above are therefore considered to have a less than significant impact, both individually and cumulatively. As indicated in Impact GHG-1, GHG emissions associated with the proposed project would be less than significant, and the project s contribution to cumulative impacts are therefore also cumulatively less than significant
82 Pacific Pointe East Development Project EIR Section 4.4 Noise 4.4 NOISE This section addresses the impact of the noise generated by the proposed project on nearby noise-sensitive land uses, as well as the effect of current and future noise levels on the proposed project land uses Setting a. Overview of Sound Measurement. Noise level (or volume) is generally measured in decibels (db) using the A-weighted sound pressure level (dba). The A-weighting scale is an adjustment to the actual sound power levels to be consistent with that of human hearing response, which is most sensitive to frequencies around 4,000 Hertz (about the highest note on a piano) and less sensitive to low frequencies (below 100 Hertz). The sound pressure level is measured on a logarithmic scale with the 0 db level based on the lowest detectable sound pressure level that people can perceive (an audible sound that is not zero sound pressure level). Based on the logarithmic scale, a doubling of sound energy is equivalent to an increase of 3 db, and a sound that is 10 db less than the ambient sound level has no effect on ambient noise. Because of the nature of the human ear, a sound must be about 10 db greater than the reference sound to be judged as twice as loud. In general, a 3 db change in community noise levels is noticeable, while 1-2 db changes generally are not perceived. Quiet suburban areas typically have noise levels in the range of dba, while those along arterial streets are in the dba range. Normal conversational levels are in the dba range, and ambient noise levels greater than 65 dba can interrupt conversations. Noise levels typically attenuate (or drop off) at a rate of 6 dba per doubling of distance from point sources such as industrial machinery. Noise from lightly traveled roads typically attenuates at a rate of about 4.5 dba per doubling of distance. Noise from heavily traveled roads typically attenuates at about 3 dba per doubling of distance. In addition to the actual instantaneous measurement of sound levels, the duration of sound is important since sounds that occur over a long period of time are more likely to be an annoyance or cause direct physical damage or environmental stress. One of the most frequently used noise metrics that considers both duration and sound power level is the equivalent noise level (Leq). The Leq is defined as the single steady A-weighted level that is equivalent to the same amount of energy as that contained in the actual fluctuating levels over a period of time (essentially, the average noise level). Typically, Leq is summed over a one-hour period. The actual time period in which noise occurs is also important since noise that occurs at night tends to be more disturbing than that which occurs during the daytime. Two commonly used noise metrics the Day-Night average level (Ldn) and the Community Noise Equivalent Level (CNEL) - recognize this fact by weighting hourly Leqs over a 24-hour period. The Ldn is a 24- hour average noise level that adds 10 db to actual nighttime (10 PM to 7 AM) noise levels to account for the greater sensitivity to noise during that time period. The CNEL is identical to the Ldn, except it also adds a 5 db penalty for noise occurring during the evening (7 PM to 10 PM)
83 Pacific Pointe East Development Project EIR Section 4.4 Noise b. Sensitive Receptors. Noise exposure goals for various types of land uses reflect the varying noise sensitivities associated with those uses. Residences, hospitals, schools, guest lodging, and libraries are most sensitive to noise intrusion and therefore have more stringent noise exposure targets than manufacturing or agricultural uses that are not subject to effects such as sleep disturbance. Noise sensitive land uses near the project area include residential neighborhoods approximately 730 feet east of the project site s eastern boundary across Clark Avenue, and the Long Beach City College campus located north of the project site. While college facilities are located immediately east of the project site, they are administrative facilities where classes are not conducted. The nearest classroom buildings are located approximately 1,800 feet north of the project site. Therefore, the residential neighborhood located east of the project site is the nearest sensitive receptor for purposes of noise analysis. c. Regulatory Setting. Chapter 8.80 of the Long Beach Municipal Code provides regulations regarding noise levels in the City. Section sets exterior noise level limits for districts identified in the municipal code. The project site is located in District 1, and the following exterior noise level standards would therefore apply to the project site: Daytime (7:00 AM 10:00 PM): 50 dba Nighttime (10:00 PM 7:00 AM) 45 dba Section states that the noise standards provided in Section shall be applied as follows: No person shall operate or cause to be operated any source of sound at any location within the incorporated limits of the City or allow the creation of any noise on property owned, leased, occupied, or otherwise controlled by such person, which causes the noise level when measured from any other property, either incorporated or unincorporated, to exceed: 1) The noise standard for that land use district as specified in Table A in Section for a cumulative period of more than thirty (30) minutes in any hour; or 2) The noise standard plus five (5) decibels for a cumulative period of more than fifteen (15) minutes in any hour; or 3) The noise standard plus ten (10) decibels for a cumulative period of more than five (5) minutes in any hour; or 4) The noise standard plus fifteen (15) decibels for a cumulative period of more than one (1) minute in any hour; or 5) The noise standard plus twenty (20) decibels or the maximum measured ambient, for any period of time. Section of the Long Beach Municipal Code sets interior noise levels for specific types of development, as shown in Table
84 Pacific Pointe East Development Project EIR Section 4.4 Noise Table Interior Noise Level Standards Land Use Time Interval Allowable Noise Level (dba) Residential School Hospital, designated quiet zones, and noise sensitive zones 10:00 PM 7:00 AM 35 7:00 AM 10:00 PM 45 10:00 PM 7:00 AM 45 7:00 AM 10:00 PM 45 10:00 PM 7:00 AM 40 7:00 AM 10:00 PM 40 Source: Long Beach Municipal Code Sec Section of the Long Beach Municipal Code sets restrictions on construction activities as follows: No person shall operate or permit the operation of any tools or equipment used for construction, alteration, repair, remodeling, drilling, demolition or any other related building activity which produce loud or unusual noise which annoys or disturbs a reasonable person of normal sensitivity between the hours of 7:00 PM and 7:00 AM the following day on weekdays, except for emergency work authorized by the Building Official. No person shall operate or permit the operation of any tools or equipment used for construction, alteration, repair, remodeling, drilling, demolition or any other related building activity which produce loud or unusual noise which annoys or disturbs a reasonable person of normal sensitivity between the hours of 7:00 PM on Friday and 9:00 AM on Saturday and after 6:00 PM on Saturday, except for emergency work authorized by the Building Official. No person shall operate or permit the operation of any tools or equipment used for construction, alteration, repair, remodeling, drilling, demolition or any other related building activity at any time on Sunday, except for emergency work authorized by the Building Official or except for work authorized by permit issued by the Noise Control Officer. The Long Beach Municipal Code (n) requires that air conditioning equipment generate noise levels of no more than 55 dba at any point on a neighboring property line. This standard would apply to all air conditioning and refrigerating equipment. The Long Beach General Plan Noise Element provides outdoor and indoor noise standards for different types of land uses, as summarized in Table
85 Pacific Pointe East Development Project EIR Section 4.4 Noise Table General Plan Noise Level Standards Land Use Outdoor Peak L10 L50 Indoor (Ldn) Residential (7:00 AM 10:00 PM) Residential (10:00 PM 7:00 AM) Commercial (any time) Industrial (any time) Source: Long Beach General Plan Noise Element. Section (g) of the Long Beach Municipal Code regulates vibration as follows: Operating or permitting the operation of any device that creates vibration which is above the vibration perception threshold of an individual at or beyond the property boundary of the source if on private property or at one hundred fifty feet (150') (forty-six (46) meters) from the source if on a public space or public right-of-way. For the purposes of this subsection, "vibration perception threshold" means the minimum ground or structureborne vibrational motion necessary to cause a normal person to be aware of the vibration by such directed means as, but not limited to, sensation by touch or visual observation of moving objects. The perception threshold shall be presumed to be.001 g's in the frequency range 0 30 hertz and. g's in the frequency range between thirty and one hundred hertz. d. Existing Noise Sources. The most common sources of noise in the project site vicinity are transportation sources, including aircraft noise and traffic on surrounding roads. Motor vehicle noise is of concern because it is characterized by a high number of individual events, which often create sustained noise levels. Ambient noise levels would be expected to be highest during the daytime and rush hour unless congestion slows speeds substantially. Existing noise sources within the project site consist of motor vehicles using the project site for airport parking. Long Beach Municipal Airport is located approximately 500 feet southwest of the project site. The most recent evaluation of airport noise was prepared as part of the Long Beach Airport Terminal Area Improvement Project EIR, which was circulated in 2005 and adopted in 2006 (, 2005). As shown in Figure 4.4-1, the project site is located outside of the airport s 60 dba noise contour. The traffic study for the project analyzed five road segments (see Appendix C) and provided the average daily trip (ADT) rate of each roadway segment. Using the ADT data, existing trafficgenerated noise levels along these segments was estimated using the Federal Highway Administration (FHWA)Traffic Noise Model (TNM). Table shows existing trafficgenerated noise levels along each of the five segments. Noise levels range from 63.1 dba to 4.4-4
86 Pacific Pointe East Development Project EIR Section 4.4 Noise 73.8 dba. The highest modeled noise level were identified for Lakewood Boulevard, which is a heavily traveled north-south arterial that provides access to I-405 to the south and SR-91 to the north. All of the modeled noise levels shown in Table currently exceed the City s District 1 daytime and nighttime exterior noise levels of 50 dba and 45 dba, respectively. Table Existing Traffic-Generated Noise Roadway Segment Existing Noise Level (dba) CNEL Lakewood Boulevard north of Conant Street 73.4 Faculty Avenue north of Conant Street 64.8 Conant Street west of Faculty Avenue 66.3 Conant Street east of Faculty Avenue 63.1 Lakewood Boulevard south of Conant Street 73.8 Estimates of noise generated by traffic at 50 feet from the roadway centerline. Refer to Appendix 4.4 for these estimates. Calculated using the Federal Highway Administration Traffic Noise Model Impact Analysis a. Methodology and Thresholds of Significance. Noise levels associated with existing and future traffic along area roadways were calculated using the FHWA TNM model based on data provided in the traffic report prepared for the prosed project (LLG, 2014). Construction noise was estimated based on noise level estimates from the US Environmental Protection Agency document Noise from Construction Equipment and Operations, Building Equipment, and Home Appliances. An impact is considered significant if it can be reasonably argued that the project would result in: Exposure of persons to or generation of noise levels in excess of standards established in the local general plan or noise ordinance, or applicable standards of other agencies; Exposure of persons to or generation of excessive groundborne vibration or groundborne noise levels; A substantial permanent increase in ambient noise levels above levels existing without the project; A substantial temporary or periodic increase in ambient noise levels in the project vicinity above levels existing without the project; For a project located within an airport land use plan or, where such a plan has not been adopted, within two miles of a public airport or public use airport, expose people residing or working in the project area to excessive noise levels For a project within the vicinity of a private airstrip, expose people residing or working in the project area to excessive noise 4.4-5

87 Pacific Pointe East Development Project EIR Section 4.4 Noise Lakewood Carson Street Cherry Avenue Clark Avenue Long Beach Willow Street 405 Signal Hill Lakewood Blvd. Source: Mestre Greve Associates, 2005 Long Beach Municipal Airport Noise Level Contours Figure 4.4-1
88 Pacific Pointe East Development Project EIR Section 4.4 Noise As discussed in the Initial Study (Appendix A), the project site is not located in the vicinity of a private airstrip. This impact would be less than significant and is not further discussed in this section. The EIR analyzes potential impacts from temporary (i.e., construction-related) noise increases, including potential vibration impacts, under Impact N-1, and permanent operational noise increases under impact N-2. Potential impacts related to noise at the Long Beach Municipal Airport are discussed under impact N-3. Impacts related to operational on-site activities and traffic noise would be considered significant if project-related activities create noise exceeding the noise standards as shown in Table Construction noise is considered significant if it would occur during hours when construction activity is prohibited under the Long Beach Municipal Code (see Regulatory Setting above). Existing off-site development would primarily be affected by potential increased noise associated with increased traffic volumes attributable to the project at various study roadway segments. Impacts to existing development are considered significant if project-generated traffic results in exposure of sensitive receptors to unacceptable noise levels. Federal recommendations were used to determine whether increases in roadway noise would be considered significant where existing noise levels already exceed City thresholds. The level of significance changes with increasing noise exposure, such that smaller changes in ambient noise levels result in significant impacts at higher existing noise levels. Table shows the significance thresholds for increases in traffic related noise levels caused either by the project alone or by cumulative development. Table Noise Impact Criteria Ldn or Leq in dba Existing Noise Level Allowable Noise Increase Source: Federal Transit Administration, Transit Noise and Vibration Impact Assessment,
89 Pacific Pointe East Development Project EIR Section 4.4 Noise b. Project Impacts and Mitigation Measures. Impact N-1 Construction-related activities associated with the proposed project would intermittently generate high noise levels and groundborne vibration on and adjacent to the site. However, construction noise would be temporary and subject to restrictions established in the Municipal Code. Therefore, impacts would be Class III, less than significant. Nearby noise-sensitive land uses, including the existing residential neighborhoods to the east of the project site and offices to the north of the site could be exposed to temporary construction noise and groundborne vibrations during development of the proposed project. Construction noise levels for each phase of project construction were modeled using typical construction equipment noise levels provided by the US EPA. These noise levels were then adjusted based on the distance between the project site and the nearest sensitive receptor, which is located approximately 730 feet east of the project site. Table presents the modeled noise levels for each construction phase at the nearest noise-sensitive receptor. Table Construction Noise Levels at the Nearest Noise- Sensitive Receptor Construction Phase Noise Level (dba Leq) at 730 feet Without Barrier With Barrier Demolition Site Preparation Grading Building Construction Paving Architectural Coating Source: EPA, Noise From Construction Equipment and Operations, The modeled noise levels shown in Table for noise occurring 730 feet from the nearest sensitive receptor would occur during construction activity at the project site s eastern boundary. As discussed above in the Setting, administrative buildings associated with Long Beach City College are located to the east of the project site. These buildings are approximately 30 feet high, and, along with mature trees in Rosie the Riveter park, would serve as a barrier between construction noise occurring at the project site and the nearest sensitive receptor. Table shows that with these barriers noise levels at the nearest sensitive receptor would be below the City s 50 dba exterior noise level standard. Construction noise impacts would therefore be less than significant. Vibration from construction activities could also have an impact on nearby noise-sensitive land uses. The primary sources of man-made vibration are blasting, grading, pavement breaking and demolition. The source of the highest vibration would be vibratory rollers used during paving 4.4-8
90 Pacific Pointe East Development Project EIR Section 4.4 Noise of the project site. Rollers typically cause vibration of 0.21 in/sec (0.007 g) measured at 25 feet (US Department of Transportation, 1995). As discussed above, the sensitive receptor nearest to the project site is located approximately 730 feet to the east. Like noise, vibration attenuates over distance (US Department of Transportation, 1995). Based on the distance between the project site and the nearest sensitive receptor, vibration at this location would be in/sec (0.00 g), which would be well below the City s g standard for vibration. Impacts related to vibration would therefore be less than significant. Mitigation Measures. As impacts would be less than significant, no mitigation is required. Significance After Mitigation. Impacts would be less than significant without mitigation. Impact N-2 Onsite operations would generate noise levels that may periodically be audible to existing land uses near and within the project area. However, operational noise is not expected to exceed City noise standards or thresholds. This is a Class III, less than significant impact. Noise levels would increase as a result of ongoing activities associated with the proposed industrial structures. Noise generated by loading docks, mechanical equipment (such as heating, ventilation and air conditioning (HVAC) units), deliveries, trash hauling activities, and general parking lots would be expected. Increased traffic on roads surrounding the project site would also increase noise. Much of the noise generated by industrial activities would also be intermittent in nature and therefore would likely not exceed City standards. For example, noise associated with parking lots generally includes engine starts, car door closing, horns, and alarms. Although these noise sources may create temporary annoyances, they are not expected to exceed City standards. In addition, the majority of noise would be generated during the daytime when residential and commercial uses are most active and least sensitive to noise. As discussed in the Setting, the nearest sensitive receptors (residences to the east across Clark Avenue) are located approximately 730 feet east of the project site. Noise sources from the proposed industrial uses would consist of vehicular noise in the proposed parking lots, and rooftop HVAC equipment. Compliance with municipal code requirements (discussed above in the Setting) would ensure that HVAC and refrigeration equipment associated with the proposed industrial uses does not exceed City exterior noise level standards at the nearest sensitive receptor. Vehicular noise is addressed below. The majority of operational noise resulting from the project would occur in indoor areas and is therefore not expected to affect offsite sensitive receptors. Therefore, project operation would not result in noise levels that exceed City standards at these sensitive receptors, and impacts related to operational noise would thus be less than significant. Development of the proposed project would increase the number of vehicle trips to and from the site, which would increase traffic noise on area roadways within the vicinity of the project site. Estimated average daily traffic (ADT) values from the traffic study were used to model the 4.4-9
91 Pacific Pointe East Development Project EIR Section 4.4 Noise change in noise levels resulting from increased traffic on five roadway segments within the vicinity of the proposed project site. Table shows exterior noise level increases that would result from project-related traffic increases. Existing plus project traffic volumes would increase exterior noise levels on three of the five analyzed roadway segments: Lakewood Boulevard north of Conant Street, and on Conant Street both east and west of Faculty Avenue. Projectrelated noise increases would be as high as 0.5 dba, which is less than the significance thresholds that apply along each studied road segment. Therefore, impacts from project-related traffic noise increases would therefore be considered less than significant. Roadway Lakewood Boulevard north of Conant Street Faculty Avenue north of Conant Street Conant Street west of Faculty Avenue Conant Street east of Faculty Avenue Lakewood Boulevard south of Conant Street Existing Table Pre-Project and Post-Project Traffic Noise Impacts Projected Noise Level (dba CNEL) Existing Plus Project Cumulative Growth Plus Project Change In Noise Level (dba CNEL) Project Only Cumulative Growth Plus Project Threshold No No No No No Estimates of noise generated by traffic from roadway centerline at 50 feet. Refer to Appendix B for these estimates. Significant Note: As shown in Table 4.4-4, an increase of 2 db would be considered significant when existing ambient noise is between db, and an increase of 1 db would be significant when existing ambient noise is 65 db or greater. This threshold is used to determine audible noise increases when existing conditions already exceed City noise thresholds. Mitigation Measures. As impacts would be less than significant, no mitigation is required. Significance After Mitigation. Impacts would be less than significant without mitigation. Impact N-3 Aircraft associated with nearby airports would periodically generate noise that would be audible at the project site. However, aircraft noise would not exceed City interior noise standards. This is a Class III, less than significant impact. The project site is located approximately 500 northeast of the Long Beach Municipal Airport. As shown in Figure 4.4-1, the project site is located outside of the airport s 60 dba noise contour. This would be consistent with the proposed industrial use of the project site (see table 4.4-2). Employees at the project site would likely spend most of the working day indoors, and thus an workers would not be exposed to excessive noise. While the Long Beach Municipal Code does not provide interior noise level standards for industrial development, interior noise levels of up to 45 dba are allowable for sensitive uses such as schools and residences. Standard construction
92 Pacific Pointe East Development Project EIR Section 4.4 Noise techniques typically reduce indoor noise levels by 20 dba below the exterior noise level. Since the project site is located outside of the airport s 60 dba noise contour, interior noise levels from airport noise would be below 40 dba. Employees working at the project site would therefore not be exposed to noise levels that exceed City standards for indoor noise. Impacts would be less than significant. Mitigation Measures. No mitigation is required. Significance After Mitigation. Impacts would be less than significant without mitigation. c. Cumulative Impacts. Cumulative development in the project area would result in the development of several nearby parcels. The operational noise generation of cumulative projects is not known, but is expected to be similar to existing development in the project area. Each cumulative project would be required to analyze the potential for operational noise impacts under CEQA. As shown in Table 4.4-6, cumulative impacts along the analyzed roadways would contribute to further exceedance of the exterior noise standard over time. Cumulative traffic noise increases along the analyzed road segments would range from 0.2 dba to 0.9 dba CNEL, which would not exceed applicable thresholds for significant impacts. All future development would be required to comply with the City s noise and vibration standards, which restrict the level of noise and vibration that can be generated near a property according to its designated use. Cumulative impacts would be less than significant
93 Pacific Pointe East Development Project EIR Section 4.4 Noise This page intentionally left blank
94 Pacific Pointe East Development Project EIR Section 4.5 Transportation and Traffic 4.5 TRANSPORTATION AND TRAFFIC This section analyzes the potential for the proposed project to cause significant impacts to the existing traffic and transportation facilities in the. The analysis in this section is based on the Traffic Impact Analysis (TIA) prepared for the proposed project by Linscott, Law, and Greenspan, Engineers, in March The full TIA is provided in Appendix C Setting a. Existing Street Network. Regional access to the project site is provided by the I-405 Freeway located south of the project. Other key roadways in the local area network include Lakewood Boulevard, Faculty Avenue, Clark Avenue, Carson Street, Conant Street, and Wardlow Road. The following discussion provides a brief synopsis of these key area streets. The descriptions are based on an inventory of existing roadway conditions. Lakewood Boulevard is primarily an eight-lane, divided roadway that borders the project site on the west. Lakewood Boulevard is oriented in the north-south direction. North of Conant Street, Lakewood Boulevard is a six-lane, divided roadway. The posted speed limit along Lakewood Boulevard is 45 miles per hour (mph). Parking is not permitted on either side of the roadway within the vicinity of the project. The key study intersections of Lakewood Boulevard at Carson Street, Conant Street and Donald Douglas Drive/Wardlow Road are controlled by traffic signals. Faculty Avenue is a two-lane, undivided roadway oriented in the north-south direction. The posted speed limit along Faculty Avenue is 30 mph. Parking is not permitted on either side of the roadway within the vicinity of the project, but angled parking is available along a cul-de-sac located at the northern end of Faculty Avenue. The key study intersection of Faculty Avenue at Conant Street is controlled by an all-way stop. Clark Avenue is primarily a four-lane, divided roadway located east of the project site. Clark Avenue is oriented in the north-south direction. South of Conant Street, Clark Avenue is a fivelane, divided roadway, with three lanes in the southbound direction and two lanes in the northbound direction. The posted speed limit along Clark Avenue is 40 mph. North of Conant Street, parking is permitted on the east side and restricted on the west side. South of Conant Street, parking is not permitted on either side of the roadway. The key study intersections of Clark Avenue at Carson Street and Conant Street are controlled by traffic signals. Carson Street is primarily a five-lane, divided roadway located north of the project site. Carson Street is oriented in the east-west direction, with three lanes in the westbound direction and two lanes in the eastbound direction. West of Lakewood Boulevard and east of Clark Avenue, Carson Street is a six-lane, divided roadway. The posted speed limit along Carson Street is 40 mph. Parking is permitted on both sides of the roadway within the vicinity of the project. Conant Street is a four-lane, divided roadway that borders the project site on the north. Conant Street is oriented in the east-west direction. West of Faculty Avenue, parking is not permitted 4.5-1
95 Pacific Pointe East Development Project EIR Section 4.5 Transportation and Traffic on either side of the roadway. East of Faculty Avenue, parking is permitted on the south side and restricted on the north side. Wardlow Road is a four-lane, divided roadway located south of the project site. Wardlow Road is oriented in the east-west direction. The posted speed limit along Wardlow Road is 35 mph. Parking is permitted on both sides of the roadway within the vicinity of the project. b. Existing Public Transit. The Long Beach Transit (LBT) provides public transit services in the vicinity of the project site. A brief description of the transit services is as follows: LBT Route 93: Route 93 extends from Alondra Boulevard and Woodruff Avenue to Fifth Street Station. Route 93 traverses the study area on Carson Street and Clark Avenue, and operates throughout the day, Monday through Friday. During the weekday AM peak hour, Route 93 provides headways of 3 buses in the eastbound direction and 2 buses in the westbound direction. During the weekday PM peak hour, Route 93 provides headways of 2 buses in the eastbound direction and 3 buses in the westbound direction. LBT Routes 101 and 103: The routes extend from Santa Fe Avenue and Willow Street to Norwalk Boulevard and Carson Street. The route traverses the study area on Carson Street, Lakewood Boulevard, and Clark Avenue, and operates throughout the day, Monday through Friday. During the weekday AM and PM peak hours, in the eastbound/westbound directions, Routes 101 and 103 provide headways of 2 buses in each direction. LBT Routes 111 and 112: The route extends from the Downtown Long Beach Station to Lakewood Regional Medical Center. These routes traverse the study area on Carson Street, Lakewood Boulevard, and Clark Avenue, and operate throughout the day, Monday through Sunday. During the weekday AM peak hour, Route 111 provides headways of 2 buses in both the northbound and southbound directions. During the weekday PM peak hour, Route 111 provides headways of 2 buses in the northbound direction and 1 bus in the southbound direction. During the weekday AM peak hour, Route 112 provides a headway of 2 buses in the southbound direction. During the weekday PM peak hour, Route 112 provides a headway of 1 bus in the southbound direction. Route 112 does not provide any buses in the northbound direction during the AM or PM peak hours. LBT Route 176: The route extends from the Lakewood Mall to San Gabriel and Pacific Coast Highway. The route traverses the study area on Carson Street and Lakewood Boulevard, and operates throughout the day, Monday through Friday. During the weekday AM and PM peak hours, in the northbound/southbound directions, Route 176 provides headways of 2 buses in each direction. c. Existing Traffic Conditions. In conformance with and LA County CMP requirements, existing AM and PM peak hour operating conditions for the key signalized study intersections were evaluated using the Intersection Capacity Utilization (ICU) method. The ICU technique is intended for signalized intersection analysis and estimates the volume to capacity (V/C) relationship for an intersection based on the individual V/C ratios for key conflicting traffic movements. The ICU numerical value represents the percent signal (green) time, and thus capacity, required by existing and/or future traffic. It should be noted that the 4.5-2
96 Pacific Pointe East Development Project EIR Section 4.5 Transportation and Traffic ICU methodology assumes uniform traffic distribution per intersection approach lane and optimal signal timing. Per LA County CMP requirements, the ICU calculations use a lane capacity of 1,600 vehicles per hour (vph) for left-turn, through, and right-turn lanes, and dual left turn capacity of 2,880 vph. A clearance interval is also added to each Level of Service calculation. Per requirements, clearance intervals are based on the number of phases in the intersection and whether the left turning movements are all fully protected or whether some of them are permitted with other left-turn movements being protected. The ICU value translates to a Level of Service (LOS) estimate, which is a relative measure of the intersection performance. The six qualitative categories of Level of Service have been defined along with the corresponding ICU value range and are shown in Table The ICU value is the sum of the critical volume to capacity ratios at an intersection; it is not intended to be indicative of the LOS of each of the individual turning movements. Level of Service ICU Value Table Level of Service Definitions HCM Delay Value (sec/veh) A <0.600 <10 B C D E F >1.000 >50 Description EXCELLENT. No vehicle waits longer than one red light, and no approach phase is fully used. VERY GOOD. An occasional approach phase is fully utilized; many drivers begin to feel somewhat restricted within groups of vehicles. GOOD. Occasionally drivers may have to wait through more than one red light; backups may develop behind turning vehicles. FAIR. Delays may be substantial during portions of the rush hours, but enough lower volume periods occur to permit clearing of developing lines, preventing excessive backups. POOR. Represents the most vehicles intersection approaches can accommodate; may be long lines of waiting vehicles through several signal cycles. FAILURE. Backups from nearby locations or on cross streets may restrict or prevent movement of vehicles out of the intersection approaches. Potentially very long delays with continuously increasing queue lengths. Highway Capacity Manual (HCM) Method of Analysis (Unsignalized Intersections). The 2000 HCM unsignalized methodology for stop-controlled intersections was utilized for the analysis of the unsignalized intersections. This methodology estimates the average control delay for each of the subject movements and determines the level of service for each movement. For all-way stop controlled intersections, the overall average control delay measured in seconds per vehicle, and level of service is then calculated for the entire intersection. For one-way and twoway stop controlled (minor street stop-controlled) intersections, this methodology estimates the worst side street delay, measured in seconds per vehicle and determines the level of service for that approach
97 Pacific Pointe East Development Project EIR Section 4.5 Transportation and Traffic The HCM control delay value translates to a Level of Service (LOS) estimate, which is a relative measure of the intersection performance. The six qualitative categories of Level of Service have been defined along with the corresponding HCM control delay value range, as shown in Table Level of Service Criteria. According to the, LOS D is the minimum acceptable condition that should be maintained during the peak commute hours, or the current LOS if the existing LOS is worse than LOS D (i.e. LOS E of F). Existing Daily Roadway Segment Volumes. Manual vehicular turning movement counts were conducted at the six key study locations during the weekday morning and evening peak commuter periods to determine the existing AM peak hour and PM peak hour traffic volumes. Traffic counts at the six key study intersections were conducted in February 2014 by Transportation Studies, Inc. Figures and depict the existing weekday AM and PM peak hour traffic volumes at the six key study intersections, respectively. Figure also presents the existing average daily traffic volumes for the roadway segments in the vicinity of the proposed project. Existing Level of Service Results. Table summarizes the existing weekday peak hour service level calculations for the six key study intersections based on existing traffic volumes and current street geometrics. Review of Table indicates that one of the six study intersections currently operates at an unacceptable level of service during the PM peak hour. The intersection of Clark Avenue at Carson Street currently operates at unacceptable LOS E during the PM peak hour. The remaining five key study intersections currently operate at acceptable levels of service during the AM and PM peak hours. d. Regulatory Setting. Congestion Management Program (CMP). In Los Angeles County (County), the CMP uses ICU intersection analysis methodology to analyze its operations. In June 1990, the passage of the Proposition 111 gas tax increase required urbanized areas in the State with a population of 50,000 or more to adopt a CMP. The Los Angeles County Metropolitan Transportation Authority (Metro) is the Congestion Management Agency (CMA) for the County. Metro has been charged with the development, monitoring, and biennial updating of Los Angeles County s CMP. The Los Angeles County CMP is intended to address the impact of local growth on the regional transportation system. The CMP Highway System includes specific roadways, including State highways, and CMP arterial monitoring locations/intersections. The CMP is also the vehicle for proposing transportation projects that are eligible to compete for the State gas tax funds. General Plan. It is the stated goal of the City to maintain or improve the current ability to move people and goods to and from activity centers while reinforcing the quality of life in their neighborhoods. This goal is supported by the objectives to: (1) maintain traffic and transportation LOS at LOS D, (2) accommodate reasonable, balanced growth, and (3) maintain or enhance our quality of life
98 Pacific Pointe East Development Project EIR Section 4.5 Transportation and Traffic Table Existing (Weekday) Intersection Peak Hour Levels of Service Summary Key Intersection 1. Lakewood Boulevard at Carson Street 2. Lakewood Boulevard at Conant Street 3. Lakewood Boulevard at Donald Douglas Drive/Warlow Road 4. Faculty Avenue at Conant Street 5. Clark Avenue at Carson Street 6. Clark Avenue at Carson Street Control Type 8-phase signal 6-phase signal 8-phase signal All-way stop 8-phase signal 2-phase signal Time Period AM PM AM PM AM PM AM PM AM PM AM PM Delay (s/v) s/v 8.7 s/v Source: LLG Engineers, 2014; see Appendix 4.5 for full TIA report. Notes: s/v = seconds per vehicle LOS = Level of Service = Phase Bold Delay/LOS values indicate unacceptable service levels based on LOS criteria identified in this report. PD-19 District. The proposed project is located in the Douglas Aircraft Planned Development District (PD-19), which allows new development intensity within this District to equal no more than 5,503 vehicle trips to and from the District in the peak period between 4 and 6PM. Long Beach Municipal Code. Chapter 21.41, Off-Street Parking and Loading requirements, of the Long Beach Municipal Code (LBMC) provides parking requirements for development projects within the City. Since the proposed project involves development of new commercial uses within the City, which will require adequate parking, the proposed project is subject to the requirements of Chapter of the LBMC Impact Analysis a. Methodology and Significance Thresholds. Each of the six key study intersections within the study area was analyzed to determine the delay and corresponding Levels of Service. Project Traffic Generation. Traffic generation is expressed in vehicle trip ends, defined as one-way vehicular movements, either entering or exiting the generating land use. Generation equations and/or rates used in the traffic forecasting procedure are found in the Ninth Edition of Trip Generation, published by the Institute of Transportation Engineers (ITE). Table summarizes the trip generation rates used in forecasting the vehicular trips generated by the proposed project and presents the forecast daily and peak hour project traffic volumes for a "typical" weekday. As shown in the upper portion of this table, the trip generation potential for the proposed project was forecast using ITE Land Use Code 140: LOS B C A B B B B A C E A A 4.5-5
99 Pacific Pointe East Development Project EIR Section 4.5 Transportation and Traffic Source: LLG, 2014 Existing Weekday Volumes AM Peak Hour Figure 4.5-1
100 Pacific Pointe East Development Project EIR Section 4.5 Transportation and Traffic Source: LLG, 2014 Existing Weekday Volumes PM Peak Hour Figure 4.5-2
101 Pacific Pointe East Development Project EIR Section 4.5 Transportation and Traffic Manufacturing average trip rates and ITE Land Use 150: Warehousing average trip rates. Specifically, ITE Land Use Code 140: Manufacturing average trip rates were utilized to estimate the trip generation potential for Buildings 9 and 10 and ITE Land Use Code 150: Warehousing average trip rates were utilized to estimate the trip generation potential for Building 11. To provide a conservative assessment, no adjustment to the project s trip generation forecast has been applied in this analysis to account for the Transportation Demand Management (TDM) Program required of project by the City. As shown in the upper portion of Table (i.e. below the trip generation rates), the proposed project is forecast to generate 1,827 daily trips, with 261 trips (205 inbound, 56 outbound) produced in the AM peak hour and 266 trips (87 inbound, 179 outbound) produced in the PM peak hour on a typical weekday. To account for the truck trip potential of the proposed project, truck traffic was forecast using the following daily, AM peak hour and PM peak hour truck percentages for manufacturing uses and warehouse uses based on information contained within the San Bernardino/Riverside County Warehouse/Distribution Center Vehicle Trip Generation Study (January 2005). A passenger car equivalent (PCE) of 2.5 was applied to each truck trip generation estimate. Manufacturing Truck Percentages = Daily: 12%, AM: 14% and PM: 9% Warehousing Truck Percentages = Daily: 16%, AM: 19% and PM: 12% Table shows that Building 9 is forecast to generate 649 daily PCE trips with 128 PCE trips forecast during the AM peak hour and 119 PCE trips forecast during the PM peak hour. Building 10 is forecast to generate 532 daily PCE trips with 105 PCE trips forecast during the AM peak hour and 99 PCE trips forecast during the PM peak hour. Building 11 is forecast to generate 1,024 daily PCE trips with 90 PCE trips forecast during the AM peak hour and 89 PCE trips forecast during the PM peak hour
102 Pacific Pointe East Development Project EIR Section 4.5 Transportation and Traffic Trip Generation Rates Table Project Trip Generation Forecast Daily AM Peak Hour PM Peak Hour Enter Exit Total Enter Exit Total 140: Manufacturing (TE/1,000 sf) : Warehousing (TE/1,000 sf) Trip Generation Forecast Building 9 Manufacturing (144,000 sf) Building 10 Manufacturing (118,000 sf) Building 11 Warehousing (232,000 sf) Total Trip Generation 1, Building 9 Passenger Car Trips Truck PCE Trips Building 9 Total PCE Trips Building 10 Passenger Car Trips Truck PCE Trips Building 10 Total PCE Trips Building 11 Passenger Car Trips Truck PCE Trips Building 11 Total PCE Trips 1, Total Project Trip Generation Passenger Car Trips 1, Truck PCE Trips Total Project PCE Trips 2, Source: LLG, Overall, the trip generation potential for the proposed project totals 2,205 daily PCE trips, with 323 PCE trips (253 inbound, 70 outbound) forecast during the AM peak hour and 307 PCE trips (100 inbound, 207 outbound) forecast during the PM peak hour. Project Traffic Distribution and Assignment. Traffic distribution determines the directional orientation of traffic. It is based upon the location, intensity of use, accessibility of existing and planned residential areas, employment centers, and other commercial activities. Traffic assignment is the determination of specific trip routes, given the previously developed traffic distribution. Primary factors in route selection are the generalized travel direction, minimum time and minimum distance paths
103 Pacific Pointe East Development Project EIR Section 4.5 Transportation and Traffic The general, directional traffic distribution pattern for the passenger cars and truck components of the project are graphically presented in Figure and Figure 4.5-4, respectively. Project traffic volumes entering and exiting the project site have been distributed and assigned to the adjacent street system based upon the following considerations: The site's proximity to major traffic carriers (i.e. I-405 Freeway and Lakewood Boulevard), Expected localized traffic flow patterns based on adjacent street channelization and presence of traffic signals and turn restrictions at the study intersections, Existing intersection traffic volumes, Ingress/egress availability at the project site, and Existing truck routes in the area. The anticipated AM and PM peak hour project traffic volumes generated by the proposed project at study intersections are presented in Figures and 4.5-6, respectively. Figure also presents the daily project traffic volumes. Significance Thresholds. Impacts related to transportation and circulation would be considered potentially significant if development facilitated by the proposed project would: Conflict with an applicable plan, ordinance, or policy establishing a measure of effectiveness for the performance of a circulation system, taking into account all modes of transportation, including mass transit and nonmotorized travel and relevant components of the circulation system, including but not limited to intersections, streets, highways, and freeways, pedestrian and bicycle paths, and mass transit Conflict with an applicable congestion management program, including, but not limited to, level of service standards and travel demand measures, or other standards established by the county congestion management agency for designated roads or highways Substantially increase traffic-related hazards due to a design feature or incompatible uses Result in inadequate emergency access The Initial Study prepared for the proposed project determined that project implementation would result in less than significant impacts related to the following thresholds: Result in a change in air traffic patterns, including either an increase in traffic levels or a change in location that results in substantial safety risks Conflict with adopted policies, plans, or programs regarding public transit, bikeways, or pedestrian facilities, or otherwise substantially decrease the performance or safety of such facilities Therefore, these thresholds are not discussed further herein
104 Pacific Pointe East Development Project EIR Section 4.5 Transportation and Traffic Source: LLG, 2014 Passenger Car Trip Distribution Figure 4.5-3
105 Pacific Pointe East Development Project EIR Section 4.5 Transportation and Traffic Source: LLG, 2014 Truck Trip Distribution Figure 4.5-4
106 Pacific Pointe East Development Project EIR Section 4.5 Transportation and Traffic b. Project Impacts and Mitigation Measures. Impact T-1 Implementation of the proposed project would increase traffic on the surrounding network, but would not cause any intersection to exceed the City s LOS standard or conflict with the County CMP. Impacts associated with the proposed project would be Class III, less than significant. Project-generated traffic would increase traffic volumes at each of the six study intersections. Figures and present AM and PM peak hour traffic volumes at the study intersections with the addition of the trips generated by the proposed project to existing traffic volumes. Figure also presents the existing plus project daily traffic volumes. Existing Plus Project Traffic Conditions. Table summarizes the peak hour Level of Service results at the key study intersections for Existing Plus Project traffic conditions. Figures and present AM and PM peak hour Existing Plus Project traffic volumes at the study intersections. Table Existing Plus Project Peak Hour Intersection Capacity Analysis Key Intersections Lakewood Boulevard at Carson Street Lakewood Boulevard at Conant Street Lakewood Boulevard at Donald Douglas Drive/Wardlow Road Faculty Avenue at Conant Street Clark Avenue at Carson Street Clark Avenue at Conant Street Source: LLG, Time Period Existing Conditions ICU/HC M LOS Existing Plus Project ICU/HC M LOS Increase Significant Impact? AM B B No PM C D No AM A A No PM B C No AM B B No PM B B No AM 11.3 s/v B 11.1 s/v B 0.0 s/v No PM 8.7 s/v A 9.0 s/v A 0.03 s/v No AM C C No PM E E No AM A A No PM A A No Based on the increases forecast to occur, traffic associated with the proposed project would not significantly impact any of the six key study intersections when compared to the LOS standards and significant impact criteria specified in this report. Although the intersection of Clark Avenue at Carson Street is forecast to operate at unacceptable LOS E during the PM peak hour with the addition of project traffic, the proposed project is expected to add less than to the ICU value; therefore, the project s impact would not be significant based on City criteria. The
107 Pacific Pointe East Development Project EIR Section 4.5 Transportation and Traffic Source: LLG, 2014 Project AM Peak Hour Trips Figure 4.5-5
108 Pacific Pointe East Development Project EIR Section 4.5 Transportation and Traffic Source: LLG, 2014 Project PM Peak Hour Trips Figure 4.5-6
109 Pacific Pointe East Development Project EIR Section 4.5 Transportation and Traffic Source: LLG, 2014 Existing Plus Project AM Peak Hour Traffic Volumes Figure 4.5-7
110 Pacific Pointe East Development Project EIR Section 4.5 Transportation and Traffic Source: LLG, 2014 Existing Plus Project PM Peak Hour Traffic Volumes Figure 4.5-8
111 Pacific Pointe East Development Project EIR Section 4.5 Transportation and Traffic remaining five key study intersections are forecast to continue to operate at an acceptable LOS with the addition of project generated traffic to existing traffic. Congestion Management Program. The Congestion Management Program (CMP) was created statewide as a result of Proposition 111 and has been implemented locally by the Los Angeles County Metropolitan Transportation Authority (LACMTA). The CMP for Los Angeles County requires that the traffic impact of individual development projects of potential regional significance be analyzed. A specific system of arterial roadways plus all freeways comprise the CMP system. As required by the current CMP, a review has been made of designated monitoring locations on the CMP highway system for potential impact analysis. Per CMP TIA criteria, the geographic area examined in the TIA must include the following: All CMP arterial monitoring intersections, including freeway on and off-ramp intersections, where the project will add 50 or more trips during either the AM or PM weekday peak hours. Mainline freeway-monitoring stations where the project will add 150 or more trips, in either direction, during the AM or PM weekday peak hours. The following CMP intersection monitoring location within the project study area has been identified: CMP Station Int. No. Intersection/Jurisdiction No Lakewood Boulevard at Carson Street As stated earlier, the CMP guidelines require that arterial monitoring intersection locations must be examined if the proposed project will add 50 or more trips during either the AM or PM weekday peak hours (of adjacent street traffic) at CMP monitoring intersections. Based on the results of a detailed analysis of project added trips, the proposed project would add approximately 128 trips to this intersection during the AM peak hour and 118 trips during the PM peak hour. However, as shown in Table 4.5-4, the intersection of Lakewood Boulevard/Carson Street is forecast to operate at acceptable LOS D or better during the AM and PM peak hours. Therefore, the proposed project would not significantly impact this CMP location and no improvements are required. The following CMP freeway monitoring location in the project vicinity has been identified: CMP Station Intersection/Jurisdiction No. 1065, I-405, north of Route 22 As stated earlier, the CMP TIA guidelines require that freeway monitoring locations must be examined if the proposed project will add 150 or more trips (in either direction) during either the AM or PM weekday peak periods. Based on the project s trip generation potential and distribution pattern, the proposed project would not add more than 150 trips during the AM or PM peak hour at this CMP mainline freeway monitoring location. Therefore, a CMP freeway traffic impact analysis is not required
112 Pacific Pointe East Development Project EIR Section 4.5 Transportation and Traffic A review of potential impacts on transit service was also conducted. As discussed in the Setting, Long Beach Transit (LBT) Routes Nos. 93, 101, 103, 111, 112, and 176 currently serve the surrounding vicinity. Pursuant to the CMP guidelines, the proposed project is forecast to generate 16 transit trips (12 inbound and 4 outbound) during the AM peak hour and 15 transit trips (5 inbound and 10 outbound) during the PM peak hour. Over a 24-hour period the proposed project is forecasted to generate 108 daily weekday transit trips. It is anticipated that the existing transit service in the project area would be able to accommodate the project generated transit trips. Therefore, the existing public transit system would not be significantly impacted by the proposed project. Based on the foregoing analysis, the proposed project would not result in an exceedance of the City s LOS standards, and would not conflict with implementation of the County CMP. Impacts would be less than significant. Mitigation Measures. Mitigation would not be required since impacts would be less than significant. Significance After Mitigation. Impacts would be less than significant without mitigation. Impact T-2 The proposed project does not include any hazardous design feature and would not result in inadequate emergency access. Impacts associated with the proposed project would be Class III, less than significant. Potential traffic hazards related to temporary construction traffic, internal circulation, and access are discussed below. Construction Traffic. The project TIA estimates that the busiest phase of project construction would result in 175 daily trips to and from the project site, including 60 trips during both the AM and PM peak hours. Construction-related trips associated with trucks and employees traveling to and from the site in the morning and afternoon may result in some minor traffic delays; however, potential traffic interference caused by construction vehicles would be temporary/short-term and would be limited to Lakewood Boulevard and Conant Street in the morning and afternoon hours. Traffic impacts to the adjacent roadway network would be minimal and not long-term. Further, since the construction-related trip generation potential of the proposed project is substantially less than that of the proposed project as a whole, and the proposed project would not significantly impact any of the six key study intersections, significant impacts resulting from construction traffic are not anticipated. Internal Circulation. According to the TIA, the on-site circulation layout of the proposed project as illustrated in Figure is generally adequate. Curb return radii have been confirmed and are generally adequate for small service/delivery trucks and trash trucks. Curb return radii for full-sized trucks and/or fire trucks are also generally adequate. However, these larger vehicles would require the use of both the inbound lane and outbound lanes to access the site from the
113 Pacific Pointe East Development Project EIR Section 4.5 Transportation and Traffic curb lane along Conant Street. For this reason, the TIA recommends that the preparation of a detailed truck access and circulation evaluation prior to finalization of the site plan. Project Access. As shown in Figure 4.5-9, access to the project site would be provided via four driveways to be located on Conant Street. Driveways 1, 3, and 4 will provide full access to the site, while Driveway 2 will provide right-turn in/right-turn out only access to the site. Table summarizes the intersection operations at the proposed project driveways located along Conant Street for near-term (Year 2016) traffic conditions at completion and full occupancy of the proposed project. The operations analysis for the project driveways is based on the Highway Capacity Manual 2000 (HCM 2000) unsignalized methodology. Table Project Driveway Capacity Analysis Driveway Time Period Source: LLG, Year 2016 Cumulative Plus Project Operation HCM LOS AM 15.4 C PM 13.9 B AM 9.8 A PM 9.2 A AM 11.0 B PM 11.0 B AM 11.4 B PM 11.2 B Table shows that the proposed project driveways are forecast to operate at acceptable LOS C or better during the AM and PM peak hours. As such, project access would be adequate. Motorists entering and exiting the project site will be able to do so comfortably, safely, and without undue congestion. Traffic Signal Warrant Analysis. The intersection of Faculty Avenue and Conant Street is currently controlled via an all-way stop. City staff determined that the level of service analysis at Faculty Avenue and Conant Street should be supplemented with an assessment of the need for signalization of the intersection. This assessment is made to determine whether peak-hour traffic conditions or peak-hour traffic volume levels are, or would be, sufficient to justify installation of a traffic signal. The traffic signal warrant analysis is made on the basis of signal warrant criteria published in the California Manual on Uniform Traffic Control Devices (CA MUTCD). For the intersection of Conant Street at Faculty Avenue, the need for signalization was assessed using existing daily traffic volumes collected at this intersection. Based on the existing traffic volumes and current intersection geometrics, the study intersection did not satisfy any of the applicable signal warrants. The intersection of Conant Street at Faculty Avenue currently operates at LOS B


114 Pacific Pointe East Development Project EIR Section 4.5 Transportation and Traffic Source: LLG, 2014 Project Access and Circulation Plan Figure 4.5-9
115 Pacific Pointe East Development Project EIR Section 4.5 Transportation and Traffic during the weekday AM peak hour and LOS A during the weekday PM peak hour and is forecast to operate at an acceptable LOS B or better during the AM and PM peak hours under Existing plus Project traffic conditions and Year 2016 Cumulative plus Project traffic conditions. The intersection of Faculty Avenue and Conant Street is forecast to operate at acceptable LOS B or better during the AM and PM peak hours under Existing Plus Project traffic conditions. Based on the traffic signal warrant analysis performed as part of the project TIA, the intersection of Faculty Avenue and Conant Street does not satisfy the traffic signal warrant under Existing plus project traffic conditions. Mitigation Measures. Mitigation would not be required since impacts would be less than significant. Significance After Mitigation. Impacts would be less than significant without mitigation. c. Cumulative Impacts. Cumulative development within the project area would cause increases in traffic on area roadways. The project TIA identifies seven related projects (also shown in Table 3-1 of this EIR) that could, in combination with the proposed project, result in cumulative traffic impacts. Figures and show the forecast traffic volumes for cumulative projects in the AM and PM peak hours. Figures and show the cumulative plus project traffic volumes in the AM and PM peak hours for both the study intersections and the project driveways. Table summarizes existing, cumulative, and cumulative plus project intersection capacities. Table Cumulative Peak Hour Intersection Capacity Analysis Intersection Lakewood Boulevard at Carson Street Lakewood Boulevard at Conant Street Lakewood Boulevard at Donald Douglas Drive/Wardlow Road Faculty Avenue at Conant Street Clark Avenue at Carson Street Clark Avenue at Conant Street Source: LLG, Time Period Existing Conditions ICU/ HCM LOS Year 2016 Cumulative Conditions ICU/ HCM LOS Year 2016 Cumulative Plus Project ICU/ HCM LOS Project Increase Signific ant Impact? AM B C C No PM C D D No AM A A A No PM B C C No AM B B B No PM B C C No AM 11.3 s/v B 12.0 s/v B 11.9 s/v B 0.0 s/v No PM 8.7 s/v A 9.0 s/v A 9.4 s/v A 0.4 s/v No AM C C C No PM E E E No AM A A A No PM A A A No
116 Pacific Pointe East Development Project EIR Section 4.5 Transportation and Traffic The intersection of Clark Avenue and Carson Street is currently operating at LOS E and would continue to do so under future conditions both with and without the project. As shown in Table 4.5-6, all of the other study intersections would operate at acceptable levels of service under the year 2016 cumulative and cumulative plus project scenarios. Cumulative impacts would therefore be less than significant and project impacts would not be cumulatively considerable
117 Pacific Pointe East Development Project EIR Section 4.5 Transportation and Traffic Source: LLG, 2014 Cumulative Projects AM Peak Hour Traffic Volumes Figure
118 Pacific Pointe East Development Project EIR Section 4.5 Transportation and Traffic Source: LLG, 2014 Cumulative Projects PM Peak Hour Traffic Volumes Figure
119 Pacific Pointe East Development Project EIR Section 4.5 Transportation and Traffic Source: LLG, 2014 Cumulative Plus Project AM Peak Hour Traffic Volumes Figure
120 Pacific Pointe East Development Project EIR Section 4.5 Transportation and Traffic Source: LLG, 2014 Cumulative Plus Project PM Peak Hour Traffic Volumes Figure
121 Pacific Pointe East Development Project EIR Section 4.5 Transportation and Traffic This page intentionally left blank
122 Pacific Pointe East Development Project EIR Section 5.0 Other CEQA-Required Discussions 5.0 OTHER CEQA-REQUIRED DISCUSSIONS 5.1 GROWTH INDUCEMENT Section 15126(d) of the CEQA Guidelines requires a discussion of a proposed project's potential to foster economic or population growth, including ways in which a project could remove an obstacle to growth. Growth does not necessarily create significant physical changes to the environment. However, depending upon the type, magnitude, and location of growth, it can result in significant adverse environmental effects. The proposed project's growth inducing potential is therefore considered significant if it could result in significant physical effects in one or more environmental issue areas. The most commonly cited example of how an economic effect might create a physical change is where economic growth in one area could create blight conditions elsewhere by causing existing competitors to go out of business and buildings to be left vacant for extended periods Pacific Pointe East Development Project Site The proposed project involves development of an existing paved surface parking lot with three industrial buildings with a total floor area of 494,000 square feet. The project would generate temporary employment opportunities during construction, which would be expected to draw workers from the existing regional work force. Therefore, construction of the project would not be considered growth inducing from a temporary employment standpoint. Any increase in permanent jobs in the City associated with the project would result from jobs associated with the proposed industrial development. Based on median square feet per employee for Los Angeles County (SCAG, 2001), the proposed projet would generate an estimated 407 new jobs in the. In 2012 the had 165,186 jobs, and by 2035 it is projected to have 184,800 jobs, for an increase of 19,614 jobs (SCAG, 2013). The 407 jobs generated by the project would represent approximately 2% of this increase. Therefore, project-generated employment growth would be well within projected employment growth for the. The proposed project does not include any residential development, and would not remove any existing residences from the City s housing supply. Thus, the project would have no direct effect on population within the. Indirect growth in population may occur as a result of employees who work at the project site seeking housing within the City in order to live close to their place of employment. The City s 2013 population was 467,646 residents, which is forecast to increase to 534,100 residents by 2035, an increase of 66,454 residents (California Department of Finance, 2013; SCAG 2013). Were all 407 employees to seek housing in the City, this would represent approximately 0.6 percent of the total population growth forecast to occur. Therefore, project-generated population growth would be well within projected growth for the. According to SCAG data, in 2008 (the most recent year for which SCAG data is available) Long Beach had a jobs-housing ratio of 1.03:1 (SCAG, October 2012). This indicates that there are 1.03 jobs for every housing unit. A jobs-housing ratio over 1.5:1 is considered high and may indicate an increasing imbalance between jobs and housing (i.e., new residential construction has not 5-1
123 Pacific Pointe East Development Project EIR Section 5.0 Other CEQA-Required Discussions kept up with job creation), while a ratio below 1:1 is considered low. The new population growth and employment opportunities that would be added by the project are well within SCAG s projections for the City. The project-related increase of 407 jobs would only incrementally alter the existing job-housing ratio in the from :1 to :1. Impacts related to the jobs-housing ratio would not be signifcant Removal of Obstacles to Growth The proposed project would be located in a fully urbanized area, generally served by existing infrastructure. The Initial Study (Appendix A) found that the project would not create the need for the extension of utility service to a currently unserved area, nor would it require any upgrades to the area s existing water, sewer, circulation and drainage connection infrastructure. However, if any such improvements were necessary, they would be sized to accommodate the project s contribution to existing service needs. The proposed project does not provide for any substantially capacity-increasing transportation and circulation improvements. No new roadways or bike/pedestrian pathways are proposed. The project constitutes infill development within an urbanized area and does not require the extension of new infrastructure through undeveloped areas. 5.2 IRREVERSIBLE ENVIRONMENTAL EFFECTS The CEQA Guidelines require that EIRs evaluating projects involving amendments to public plans, ordinances, or policies contain a discussion of significant irreversible environmental changes. CEQA also requires decisionmakers to balance the benefits of a proposed project against its unavoidable environmental risks in determining whether to approve a project. This section addresses non-renewable resources, the commitment of future generations to the proposed uses, and irreversible impacts associated with the proposed project. Conversion of the project site from a surface parking lot to an industrial development would likely result in a long-term commitment of the site to such uses. The project would involve the use of building materials and energy, some of which are non-renewable resources. Consumption of these resources would occur with any development in the region and are not unique to the project. The increased intensity of industrial development would also irreversibly increase local demand for non-renewable energy resources such as petroleum products and natural gas. However, increasingly efficient building fixtures and automobile engines are expected to offset this demand to some degree. The project would require a commitment of law enforcement, fire protection, water supply, wastewater treatment, and solid waste disposal services. However, as discussed in the Initial Study (Appendix A), impacts to these service systems would be less than significant. The additional vehicle trips associated with buildout of the project site would increase traffic in the vicinity of the project site. As discussed in Section 4.2, Air Quality, air pollutant emissions associated with construction would be less than significant. Although impacts would be less than significant, air pollutants emissions associated with construction and operation of the project would contribute to the degradation of air quality associated with this and all other cumulative development. The project would also create greenhouse gas emissions 5-2
124 Pacific Pointe East Development Project EIR Section 5.0 Other CEQA-Required Discussions incrementally contributing to global climate change. This impact was found to be less than significant in Section 4.3, Greenhouse Gas Emissions, which includes an analysis of the cumulative nature of this impact. 5-3
125 Pacific Pointe East Development Project EIR Section 5.0 Other CEQA-Required Discussions This page intentionally left blank. 5-4
126 Pacific Pointe East Development Project EIR Section 6.0 Alternatives 6.0 ALTERNATIVES As required by Section of the CEQA Guidelines, this EIR examines a range of reasonable alternatives to the proposed project that would attain most of the basic objectives of the project (as stated in Section 2.5 of this EIR) but would avoid or substantially lessen any of its significant effects. Included in this analysis are three alternatives, including the CEQA-required no project alternative, that involve changes to the project to help reduce its environmental impacts as identified in this EIR. This section also identifies the Environmentally Superior Alternative. The following alternatives are evaluated in this EIR: Alternative 1: No Project (no three new light industrial buildings with associated improvements) Alternative 2: Reduced Intensity Alternative 3: Alternate Site The potential environmental impacts of each alternative are analyzed in Sections 6.1 through 6.4. Because the alternatives analysis is intended to focus on alternatives that would substantially lessen any of the significant effects of the project, and because this EIR focuses only on impact areas with the potential for such effects, the potential impacts of each alternative are analyzed in the areas of Aesthetics, Air Quality, Greenhouse Gas Emissions, Noise, and Transportation/Traffic, which are the only areas that were identified in the Initial Study (Appendix A) as having potentially significant effects. Table 6-1 provides a summary comparison of the development characteristics of the proposed project and the alternatives. A more detailed description of the alternatives is included in the impact analysis for each alternative. Characteristic Table 6-1 Comparison of Project Alternatives Buildout Characteristics Proposed Project No Project Alternative Alternatives Reduced Intensity Alternative Alternate Site Alternative Number of Buildings Square Footage of Buildings 494, , ,000 Parking Spaces Although the project site was formerly used as a surface parking lot, this use is no longer in operation, and therefore the number of parking spaces currently available is
127 Pacific Pointe East Development Project EIR Section 6.0 Alternatives 6.1 NO PROJECT As described below and throughout this EIR, the project does not have any significant impacts that would be significantly reduced by this alternative. This alternative assumes that the proposed improvements are not implemented and that the site remains in its present condition, occupied by a vacant surface parking lot. This alternative would not meet the objectives of the proposed project because it would not attract tenants in the light industrial, light manufacturing, warehouse, office, and/or research & development industries; help develop the site in accordance with land uses called for under the PD-19 District; utilize design elements that would project a high-quality professional image while focusing on sustainability and energy conservation; provide employment opportunities or attract businesses; or enhance the City s tax base. Implementation of the No Project alternative would not preclude future development on the site. Any future development projects proposed on the site would be subject to at least the same level of discretionary review as required of the proposed project Aesthetics The No Project Alternative would not change the aesthetics of the project site or area. As discussed in the Aesthetics section of this EIR, the project site currently has relatively low visual quality, but it is consistent with the aesthetic character of its surroundings, which also contain large amounts of unlandscaped open space (i.e., the runways and surrounding open areas at Long Beach Airport). This alternative would avoid the project s less than significant impact related to blocking views of the distant ridgelines of Signal Hill and the Palos Verdes Peninsula from Conant Street. While the project would be consistent with policies from the Long Beach General Plan relating to aesthetics, such as maintaining and improving the aesthetic quality of neighborhoods and City facilities, the No Project Alternative would leave the site in its current state, which, as a vacant surface parking lot, has relatively low aesthetic quality. Overall, this alternative s impacts with respect to aesthetics would, like those of the proposed project, be less than significant Air Quality Due to the fact that the project site is currently vacant, there are little to no emissions currently resulting from use of the site. While the project s impacts related to air quality emissions are less than significant, the project would still result in emissions from increased use of the site. Therefore, the No Project Alternative s air quality impacts would be less than those of the proposed project Greenhouse Gas Emissions/Climate Change Because the project site is currently vacant, it creates fewer greenhouse gas (GHG) emissions than it would under the proposed project, which would increase use of and vehicle trips to the site. Although the project s impacts related to GHG emissions would be less than significant, the No Project Alternative s GHG/Climate Change impacts would be less than those of the proposed project. 6-2
128 Pacific Pointe East Development Project EIR Section 6.0 Alternatives Noise Because the project site is currently vacant, it produces less noise and vibration than it would under the proposed project, which would result in temporary noise and vibration impacts from construction of the proposed project, as well as long-term noise and vibration impacts from the operation of the proposed commercial/light industrial uses on the site, including both on-site operational noise and vibration and on- and off-site vehicle noise and vibration. The No Project Alternative would not involve any construction on the project site or any construction traffic on surrounding streets, and would retain the site in its currently vacant, unused state. It would therefore avoid the project s less than significant impacts related to both construction and operational noise and vibration, and its impacts in this regard would be less than those of the proposed project Transportation and Traffic Because the project site is currently vacant, it has little or no vehicle trips associated with it. The proposed project would result in both temporary construction traffic and long-term operational traffic that would be added to the area s street system. While the impacts of this project-related traffic have been determined to be less than significant in this EIR, the No Project Alternative would avoid these impacts, and its transportation and traffic impacts are therefore less than those of the proposed project. 6.2 REDUCED INTENSITY ALTERNATIVE As described below and throughout this EIR, the project does not have any significant impacts that would be significantly reduced by this alternative. This alternative involves reducing the amount of development included in the proposed project. For the purposes of this analysis, a 50% reduction in total square footage and parking spaces has been assumed, which would result in a reduction from 494,000 square of total floor area to 247,000 square feet of floor area, and a reduction from 722 parking spaces to 361 parking spaces. Also, it is assumed that this reduction in square footage would lead to the inclusion in the project of two rather than three light industrial buildings. The intent of this alternative is to reduce any potentially significant impacts associated with the project that would result from its intensity, such as traffic, noise, and air quality impacts. This alternative would meet the objectives of the project, but to a lesser degree than the project, because it would not allow for as much job creation or economic development. It should also be noted that the Reduced Density Alternative could be applied at an alternate site. The Alternate Site Alternative is analyzed in Section Aesthetics The Reduced Intensity Alternative would reduce the amount of development on the project site, but it would still change the visual character of the site from a vacant surface parking lot to a site occupied by light industrial commercial development. If the remaining buildings on the project site under this alternative were clustered towards the eastern end of the site, the project s less than significant impact related to blocking views of the distant ridgelines of Signal Hill and the Palos Verdes Peninsula from Conant Street could be reduced. Both the proposed project, as well as this alternative, would be consistent with policies from the Long Beach 6-3
129 Pacific Pointe East Development Project EIR Section 6.0 Alternatives General Plan relating to aesthetics, such as maintaining and improving the aesthetic quality of neighborhoods and City facilities. Due to its potential to preserve views of distant ridgelines to a slightly greater degree than the proposed project, this alternative s impacts with respect to aesthetics would be slightly less than those of the proposed project Air Quality While the proposed project s impacts related to air quality emissions are less than significant, the Reduced Intensity Alternative would reduce emissions associated with development and increased use of the site because it would reduce the amount of development on the site. This reduced amount of development could lead to fewer emissions during construction, if less of the site needed to be developed and less construction activity needed to be carried out to construct the project. It would also lead to fewer emissions during operation of the project, because less activity would be carried out on the site and fewer vehicle trips would be made to and from the site. Therefore, this alternative s air quality impacts would be less than those of the proposed project Greenhouse Gas Emissions/Climate Change While the proposed project s impacts related to GHG emissions and climate change are less than significant, the Reduced Intensity Alternative would reduce GHG emissions associated with development and increased use of the site because it would reduce the amount of development on the site, as explained in Section above. Therefore, this alternative s impacts related to GHG emissions and climate change would be less than those of the proposed project Noise While the proposed project s impacts related to noise are less than significant, the Reduced Intensity Alternative would reduce noise associated with development and increased use of the site because it would reduce the amount of development on the site. This could lead to less construction activity required to construct the project, and less construction noise. It would also reduce the amount of noise associated with project operation, since there would be less operational activity on the site, as well as fewer vehicle trips to and from the site. Therefore, this alternative s noise impacts would be less than those of the proposed project Transportation and Traffic While the project s impacts related to transportation and traffic are less than significant, the Reduced Intensity Alternative would reduce such impacts associated with development and increased use of the site because it would reduce the amount of development on the site. This could lead to less construction activity required to construct the project, and less construction traffic. It would also reduce the amount of traffic associated with project operation, since there would be less operational activity on the site, and thus fewer vehicle trips to and from the site. Therefore, this alternative s transportation and traffic impacts would be less than those of the proposed project. 6-4
130 Pacific Pointe East Development Project EIR Section 6.0 Alternatives 6.3 ALTERNATE SITE ALTERNATIVE As described below and throughout this EIR, the project does not have any significant impacts that would be significantly reduced by this alternative. This alternative involves analyzing the potential impacts of development of the proposed project on a different site relative to its impacts on the currently proposed site. In order to identify the most comparable sites, the areas closest to the project site were examined first. The project site is located in the City s Douglas Aircraft Planned Development District (PD-19). The project site is the last piece of property within PD-19 large enough to accommodate the proposed project. The City has two other Planned Development Districts in the vicinity of Long Beach Airport that include some areas that would allow the proposed project: Douglas Park North (PD-32 North) and Douglas Park South (PD-32 South). Sub Area 3 of PD-32 North, which is located on the north side of Cover Street between Schauffle Avenue and the Lakewood Golf Course, allows light industrial uses, but this area is already largely developed with buildings and other currently active land uses, and therefore does not contain a site large enough to accommodate the proposed project. Sub Area 7 of PD-32 South, which is located between Lakewood Boulevard, Conant Street, Worsham Avenue, and Cover Street, directly to the northeast and across Lakewood Boulevard from the project site, also allows light industrial, and is not developed. This site is roughly square in shape and is approximately 20.5 acres in size. Due to its proximity to the project site, size, and similar access to Conant Street and Lakewood Boulevard, this site has been chosen, for the purposes of this analysis, as the Alternate Site. It should be noted that this site is approximately five acres smaller than the project site. While it could be possible to rearrange the buildings proposed under the project at this alternate site to accommodate the same amount of development as under the proposed project, this alternative may also require somewhat reducing the total amount of proposed development. A Reduced Intensity Alternative is analyzed in Section 6.2. No other undeveloped sites this large were found in the general area. This alternative would meet the objectives of the project, because it would allow for construction of the same project, but on a different site in relatively close proximity to the current project site. If this alternative required a reduction in the total amount of development, it would meet the project objectives to a proportionally lesser degree. However, for the purposes of analysis, it is assumed in this section that this alternative would allow construction of the proposed project to its full extent. The actual availability of alternate sites for purchase and development is not known Aesthetics The Alternate Site Alternative would change the visual character of the alternate site from a currently undeveloped lot to a lot developed with light industrial/commercial development. It would also leave the proposed project site as a vacant surface parking lot. The impacts of this alternative on visual character and quality would be the same as under the proposed project, but at a different site. This alternative would preserve views of Signal Hill and the Palos Verdes Peninsula from Conant Street, but could block them to a similar degree from Lakewood Boulevard north of Conant Street. Its impacts in this regard would therefore be similar. Both the proposed project, as well as this alternative, would be consistent with policies from the Long 6-5
131 Pacific Pointe East Development Project EIR Section 6.0 Alternatives Beach General Plan relating to aesthetics, such as maintaining and improving the aesthetic quality of neighborhoods and City facilities. This alternative s aesthetic impacts would therefore be similar to those of the proposed project, and less than significant Air Quality The Alternate Site Alternative assumes the same level of development as the proposed project. It would therefore have the same construction and on-site operational emissions as the proposed project. Additionally, because it is in close proximity to the proposed project site, it would have very similar trip generation and distribution characteristics as the project, and would therefore have very similar emissions from mobile (vehicular) sources. This alternative s air quality impacts would therefore be similar to those of the proposed project, and less than significant Greenhouse Gas Emissions/Climate Change The Alternate Site Alternative assumes the same level of development as the proposed project. It would therefore have the same construction and on-site operational emissions as the proposed project. Additionally, because it is in close proximity to the proposed project site, it would have very similar trip generation and distribution characteristics as the project, and would therefore have very similar emissions from mobile (vehicular) sources. This alternative s impacts related to GHG emissions and climate change would therefore be similar to those of the proposed project, and less than significant Noise While the proposed project s impacts related to noise are less than significant, the alternate site is somewhat further from noise-sensitive receptors than the proposed project site. While the proposed project site is approximately 730 feet from residential neighborhoods on the east side of Clark Avenue, the closest residential neighborhoods to the alternate site are located approximately 1,750 feet to its north on the north side of Carson Street. Although noise generated on the proposed project site would have a less than significant impact on the closest noise-sensitive receptors, the greater distance of the alternate site from such receptors could reduce the project s construction-related and operational noise impacts. Because the proposed project would have similar trip generation and distribution characteristics at either site, trafficrelated noise would be similar under either alternative. Because of its greater distance from noise-sensitive receptors, this alternative s noise impacts would be less than those of the proposed project Transportation and Traffic The project at the alternate site would most likely be accessed from the immediately surrounding streets of Conant Street, Worsham Avenue, or Cover Street. While the alternate site also borders Lakewood Boulevard, this facility is a State highway, and it is more likely that acceptable access would be taken from these other streets. The proposed project would have similar trip generation at either site. Because of the proximity of the two sites, project-generated traffic would distribute across the local roadway network in very similar ways under either 6-6
132 Pacific Pointe East Development Project EIR Section 6.0 Alternatives alternative, and impacts related to transportation and traffic would be similar and less than significant under either alternative. 6.4 ENVIRONMENTALLY SUPERIOR ALTERNATIVE The environmental analysis contained in the EIR has found that the proposed project has no significant environmental impacts. Adoption of a project alternative is therefore not necessary in order to avoid significant environmental impacts. However, each of the alternatives would incrementally reduce one or more of the proposed project s less than significant impacts, as discussed below. Alternative 2, the Reduced Intensity Alternative, would avoid all of the project s less than significant impacts. Consequently, the Reduced Intensity Alternative is considered environmentally superior. This alternative would meet the objectives of the project (stated in Section 2.0, Project Description, and discussed throughout this alternatives analysis) but to a lesser degree than the project, because it would not allow for as much job creation or economic development. Table 6-2 indicates whether each alternative s environmental impact is greater, lesser, or similar to the proposed project. Table 6-2 Comparison of Environmental Impacts of Alternatives Issue Proposed Project Alternative 1: No Project Alternative 2: Reduced Intensity Alternative 3: Alternate Site Aesthetics = = + = Air Quality = + + = GHG Emissions/ Climate Change = + + = Noise = Transportation and Traffic = + + = Overall = Superior to the proposed project - Inferior to the proposed project = Similar impact to the proposed project 6-7
133 Pacific Pointe East Development Project EIR Section 6.0 Alternatives This page intentionally left blank. 6-8
134 Pacific Pointe East Development Project EIR Section 7.0 References and Report Preparers 7.0 REFERENCES AND REPORT PREPARERS 7.1 REFERENCES Bibliography California Air Resources Board. Ambient Air Quality Standards. /research/aaqs/aaqs2.pdf website. General Plan. /general_plan.asp. Municipal Code website. /longbeach. California Air Districts CalEEMod User s Guide. /UsersGuide.pdf California Air Pollution Control Officers Association. CEQA and Climate Change: Addressing Climate Change through California Environmental Quality Act (CEQA). January California Air Resources Board. October Greenhouse Gas Inventory Data 2000 to Available: California Air Resources Board. August Greenhouse Gas Inventory Data 2020 Emissions Forecast. Available: California Climate Action Registry (CCAR) General Reporting Protocol, Reporting Entity-Wide Greenhouse Gas Emissions, Version 3.1, January California Climate Change Center. Climate Scenarios for California California Climate Change Center. The Impacts of Sea-Level Rise on the California Coast. May California Department of Transportation California Manual on Uniform Traffic Control Devices. California Department of Water Resources. October Managing an Uncertain Future: Climate Change Adaption Strategies for California s Water. Available: California Energy Commission. Environmental Health and Equity Impacts from Climate Change and Mitigation Policies in California: A Review of the Literature. March 2009: D.PDF 7-1
135 Pacific Pointe East Development Project EIR Section 7.0 References and Report Preparers California Environmental Protection Agency (CalEPA). Climate Action Team Biennial Report. Final Report. April California Environmental Protection Agency (CalEPA), March Climate Action Team Report to Governor Schwarzenegger and the Legislature. 03_FINAL_CAT_REPORT_EXECSUMMARY.PDF California Natural Resources Agency. December California Climate Adaption Strategy. Available: PDF Crain and Associates. May Western Riverside County Warehouse/Distribution Center Trip Generation Study. Institute of Transportation Engineers [ITE] Trip Generation, ninth ed. Intergovernmental Panel on Climate Change [IPCC]. Revised 2006 IPCC Guidelines for National Greenhouse Gas Inventories. [Penman,J.; Gytarsky, M.; Hiraishi, T.; Irving, W.; Krug, T.]. Paris: OECD, Intergovernmental Panel on Climate Change [IPCC], 2007: Summary for Policymakers. In: Climate Change 2007: The Physical Science Basis. Contribution of Working Group I to the Fourth Assessment Report of the Intergovernmental Panel on Climate Change [Solomon, S., D. Qin, M. Manning, Z. Chen, M. Marquis, K.B. Averyt, M.Tignor and H.L. Miller (eds.)]. Cambridge University Press, Cambridge, United Kingdom and New York, NY, USA. Intergovernmental Panel on Climate Change [IPCC], 2013: Summary for Policymakers. In: Climate Change 2013: The Physical Science Basis. Contribution of Working Group I to the Fifth Assessment Report of the Intergovernmental Panel on Climate Change [Stocker, T.F., D. Qin, G.-K. Plattner, M. Tignor, S. K. Allen, J. Boschung, A. Nauels, Y. Xia, V. Bex and P.M. Midgley (eds.)]. Cambridge University Press, Cambridge, United Kingdom and New York, NY, USA. National Oceanic & Atmospheric Administration (NOAA). Annual Greenhouse Gas Index. September Parmesan, C Ecological and Evolutionary Responses to Recent Climate Change. Parmesan C, Galbraith H Observed Ecological Impacts of Climate Change in North America. Arlington, VA: Pew Cent. Glob. Clim. Change South Coast Air Quality Management District SQAQMD Air Quality Significance Thresholds. South Coast Air Quality Management District CEQA Air Quality Handbook. 7-2
136 Pacific Pointe East Development Project EIR Section 7.0 References and Report Preparers South Coast Air Quality Management District. /appc.pdf South Coast Air Quality Management District. September Proposed Tier 3 Quantitative Thresholds Option 1. Southern California Association of Governments [SCAG] Employment Density Study Summary Report. Southern California Association of Governments [SCAG]. Adopted 2012 RTP Growth Forecast. Website. Accessed March Transportation Research Board Highway Capacity Manual, fourth ed. United Nations (n.d.) Gateway to the United Nations Systems Work on Climate Change: Durban conference delivers breakthrough in international community s response to climate change. Accessed March Retrieved from: United Nations Framework Convention on Climate Change (UNFCCC). August United Nations Framework Convention on Climate Change. Available: ation/pdf/unfccc_conv_rat.pdf United Nations Framework Convention on Climate Change (November 2011). Outcome of the work of the Ad Hoc Working Group on Further Commitments for Annex I Parties under the Kyoto Protocol at its sixteenth session. Accessed March Retrieved from: utcome.pdf United Nations Framework Convention on Climate Change (March 15, 2012). Report of the Conference of the Parties on its seventeenth session, held in Durban from 28 November to 11 December Retrieved from: United States Department of Energy, Energy Information Administration. Annual Energy Review August United States Department of Transportation, Federal Transit Administration Transit Noise and Vibration Assessment. United States Environmental Protection Agency (U.S. EPA). Climate Change Technology Program (CCTP). December
137 Pacific Pointe East Development Project EIR Section 7.0 References and Report Preparers United States Environmental Protection Agency (U.S. EPA). Inventory of U.S. Greenhouse Gas Emissions and Sinks: U. S. EPA #430-R April World Meteorological Organization, A summary of current and climate change findings and figures, March Info-Sheet-136_fr.pdf Persons Contacted Craig Chalfant. Long Beach Development Services, Planning Bureau. January-March Janine Padia. Sares-Regis Group/Commercial Development. January-March REPORT PREPARERS This EIR was prepared by the, with the assistance of Rincon Consultants, Inc. Consultant staff involved in the preparation of the EIR are listed below. Rincon Consultants, Inc. Joe Power, AICP, Principal in Charge Greg Martin, AICP, Project Manager Douglas Brown, Associate Environmental Planner Wade Sherman, Graphics Technician Katherine Warner, GIS Technician Traffic Study- Linscott, Law & Greenspan, Engineers Richard E. Barretto, Principal Garrett Milovich, Transportation Engineer I Daniel A Kloos, PE, Senior Transportation Engineer 7-4
138 Appendix A Initial Study, Notice of Preparation (NOP), and NOP Comment Letters

139 Pacific Pointe East Development Project Initial Study January 2014
140 PACIFIC POINTE EAST DEVELOPMENT PROJECT INITIAL STUDY Prepared for: Department of Development Services 333 W. Ocean Boulevard, 5th Floor Long Beach, CA Prepared by: Rincon Consultants 180 North Ashwood Avenue Ventura, California 93 January 2014
141 This report prepared on 50% recycled paper with 50% post-consumer content.
142 Pacific Pointe East Development Project Initial Study TABLE OF CONTENTS Initial Study 1. Project title Lead agency name and address Contact person and phone number Project location Project sponsor s name and address General Plan designation Zoning Project Description Surrounding land uses and setting Required Entitlements Other public agencies whose approval is required... 2 Environmental Factors Affected... 7 Determination... 8 Environmental Checklist... 9 Page Discussion I. Aesthetics... 9 II. Agricultural and Forest Resources III. Air Quality IV. Biological Resources V. Cultural Resources VI. Geology and Soils VII. Greenhouse Gas Emissions VIII. Hazards and Hazardous Materials IX. Hydrology and Water Quality X. Land Use and Planning XI. Mineral Resources XII. Noise XIII. Population and Housing XIV. Public Services XV. Recreation XVI. Transportation/Traffic XVII. Utilities and Service Systems XVIII. Mandatory Findings of Significance References i
143 Pacific Pointe East Development Project Initial Study List of Figures Figure 1 Regional Location... 3 Figure 2 Project Location... 4 Figure 3 Site Plan... 5 List of Tables Table 1 SCAQMD LSTs for Emissions in SRA ii
144 Pacific Pointe East Development Project Initial Study INITIAL STUDY 1. Project title: Pacific Pointe East Development Project 2. Lead agency name and address: Department of Development Services 333 W. Ocean Boulevard, 5th Floor Long Beach, CA Contact person and phone number: Craig Chalfant (562) Project location: Southeast corner of Lakewood Boulevard and Conant Street near the Long Beach Airport Figure 1 shows the location of the project site within the region and Figure 2 shows an aerial view of the project site. 5. Project applicant s/sponsor s DP3 Hangars, LLC name and address: Bardeen Avenue Irvine, California Phone: (949) General Plan designation: Mixed Use (LUD No. 7) 7. Zoning: Douglas Aircraft Planned Development District (PD-19) 8. Project Description: The proposed Pacific Pointe East development is located on an unaddressed, approximately 25- acre parcel at the southeast corner of Lakewood Boulevard and Conant Street near the Long Beach Airport, with a Los Angeles County Assessor s ID Number of As shown in Figure 3, the proposed project involves three new industrial buildings on a site that is currently developed with a paved surface parking lot. These buildings have an open floor plan and would be intended for light industrial, light manufacturing, warehouse, office, and/or research & development land uses. The three buildings would have a maximum height of about 41 feet and total floor area of 494,000 square feet, broken down as follows: Building 9 144,000 sq. ft. of building area on a 306,399 square foot (sq. ft.) site Building ,000 sq. ft. of building area on a 233,538 sq. ft. site Building ,000 sq. ft. of building area on a 541,098 sq. ft. site A total of 722 parking spaces are proposed, including 221 spaces for Building 9, 156 spaces for Building 10, and 345 spaces for Building 11. 1
145 Pacific Pointe East Development Project Initial Study The project site is located in the Douglas Aircraft Planned Development District (PD-19), which allows a range of uses but limits total peak period (4-6 PM) vehicle trips to and from the district to 5,503. In addition, development within PD-19 must not have significant effects on neighboring residences, significant effects on visual resources, or significant safety and security effects. 9. Surrounding land uses and setting: The project site is surrounded by industrial and office development to the north, east, and west. A golf course is located immediately south of the project site. Long Beach Airport facilities are located approximately 650 feet southwest of the site, and airport runways are located approximately 450 feet southwest of the site. Approximately 300 feet east of the project site is Rosie the Riveter Park. Long Beach City College is located nearby to the north and east of the project site. The nearest residential development is located approximately 700 feet east of the project site along Clark Avenue. 10. Required Entitlements: The project requires the following discretionary approval (entitlement) from the City of Long Beach: Site Plan Review and Approval Consistent with City Ordinance ORD , a Site Plan would be submitted for Planning Commission approval. 11. Other public agencies whose approval is required: The is the lead agency and is the only public agency with discretionary approval over the project. 2


146 Pacific Pointe East Development Project Initial Study ^_ ^_ ± Project Location Miles Regional Location Figure 1


147 Pacific Pointe East Development Project Initial Study E Centralia St Lakewood Golf Course ST 19 E Harvey Way Bellflower Blvd Carson St Carson St Heartwell Park Cover St N Lakewood Blvd Faculty Ave E Conant St Stearnlee Ave Skylinks Golf Course J^ Long Beach Airport E Wardlow Rd ST 19 Clark Ave N Bellflower Blvd E Spring St 405 E 28Th St Project Boundary ,600 Feet ± 405 Imagery provided by ESRI and its licensors Aerial View of Project Site and Surrounding Uses Figure 2
148 Pacific Pointe East Development Project Initial Study SITE AREA Acres Acres SF 1,081,035 SF TOTAL BUILDING AREA 494,000 SF FLOOR AREA RATIO (FAR) 45.7% TOTAL PARKING 1/ STALLS TOTAL PARKING PROVIDED 722 STALLS PARKING RATIO / / Scale in Feet BUILDING DESCRIPTION BUILDING 9 BUILDING 10 BUILDING 11 TOTALS SITE AREA Acres SF 306, , ,098 1,081,035 FAR 47.0% 50.5% 42.9% 45.7% BUILDING AREA 1ST FLOOR - Industrial 129, , , ,000 2ND FLOOR - Office 15,000 15,000 20,000 50,000 TOTALS 144, , , ,000 PARKING 1/ PARKING 1.5/ PARKING PROVIDED PARKING RATIO Source: Pacific Pointe East, November 22, Site Plan Figure 3
149 Pacific Pointe East Development Project Initial Study ENVIRONMENTAL FACTORS AFFECTED The environmental factors checked below would be potentially affected by this Project, involving at least one impact that is Potentially Significant or Potentially Significant Unless Mitigation Incorporated as indicated by the checklist on the following pages. Aesthetics Agriculture and Forest Resources Air Quality Biological Resources Cultural Resources Geology/Soils Greenhouse Gas Emissions Hazards & Hazardous Materials Land Use/Planning Mineral Resources Noise Hydrology/Water Quality Population/Housing Public Services Recreation Transportation/Traffic Utilities/Service Systems Mandatory Findings of Significance 7
150
151 Pacific Pointe East Development Project Initial Study Environmental Checklist Potentially Significant Impact Potentially Significant Unless Mitigation Incorporated Less than Significant Impact No Impact I. AESTHETICS Would the Project: a) Have a substantial adverse effect on a scenic vista? b) Substantially damage scenic resources, including, but not limited to, trees, rock outcroppings, and historic buildings within a state scenic highway? c) Substantially degrade the existing visual character or quality of the site and its surroundings? d) Create a new source of substantial light or glare which would adversely affect day or nighttime views in the area? a) Policy 1.2 in the City s General Plan Open Space and Recreation Element identifies natural resources, amenities, and scenic values in the City, including nature centers, beaches, bluffs, wetlands, and other water bodies (, October 2002). There are no such resources in the vicinity of the project site, which is located in an urbanized inland area of the City. The proposed structures would be approximately 41 feet high, which would potentially obscure views of scenic resources not located in the immediate vicinity of the project site. Impacts would be potentially significant and will be analyzed in the EIR. b) There are no state scenic highways in the. The has one local scenic route, which follows Ocean Boulevard from the Los Angeles River to Livingston Drive in the Belmont Shore neighborhood (, 2009). This scenic route is located approximately 4 miles south of the project site and would not be affected by project development. There would be no impact and further analysis of this issue in an EIR is not warranted. c) The project site is currently occupied by a paved parking lot. Due to the height of the proposed structures (41 feet), project development would potentially alter views available from the golf course to the south and residences to the east of the project site. The project s impact is potentially significant and will be studied in the EIR. d) The project site is currently developed with a paved parking lot that includes security lighting. The proposed project would include sources of light and glare on the project site, such as parking lot and structural lighting and reflective surfaces on parked cars and building exteriors. However, Chapter of the Long Beach Municipal Code (LBMC) requires the following: 9
152 Pacific Pointe East Development Project Initial Study All parking lots and garages shall be illuminated with lights directed and shielded to prevent light and glare from intruding onto adjacent sites. The light standards shall not exceed the height of the principal use structure or one foot (1 ) for each two feet (2 ) of the distance between the light standard and the nearest property line, whichever is greater. Otherwise, the project site would be lit similarly to its current state, and any new lighting would be reviewed through the City s Site Plan Review process, as described in Division V of Chapter Site Plan Review of the LBMC. The project s impacts related to light and glare would therefore be less than significant and further analysis of this issue in an EIR is not warranted. Potentially Significant Impact Potentially Significant Unless Mitigation Incorporated Less than Significant Impact No Impact II. AGRICULTURE AND FOREST RESOURCES -- In determining whether impacts to agricultural resources are significant environmental effects, lead agencies may refer to the California Agricultural Land Evaluation and Site Assessment Model (1997) prepared by the California Dept. of Conservation as an optional model to use in assessing impacts on agriculture and farmland. In determining whether impacts to forest resources, including timberland, are significant environmental effects, lead agencies may refer to information compiled by the California Department of Forestry and Fire Protection regarding the state s inventory of forest land, including the Forest and Range Assessment Project and the Forest Legacy Assessment Project; and forest carbon measurement methodology provided in Forest Protocols adopted by the California Air Resources Board. -- Would the Project: a) Convert Prime Farmland, Unique Farmland, Farmland of Statewide Importance (Farmland), as shown on the maps prepared pursuant to the Farmland Mapping and Monitoring Program of the California Resources Agency, to nonagricultural use? b) Conflict with existing zoning for agricultural use, or a Williamson Act contract? 10
153 Pacific Pointe East Development Project Initial Study Potentially Significant Impact Potentially Significant Unless Mitigation Incorporated Less than Significant Impact No Impact c) Conflict with existing zoning for, or cause rezoning of, forest land (as defined in Public Resources Code Section 12220(g)), timberland (as defined by Public Resources Code Section 4526), or timberland zoned Timberland Production (as defined by Government Code Section 51104(g))? d) Result in the loss of forest land or conversion of forest land to non-forest use? e) Involve other changes in the existing environment which, due to their location or nature, could result in conversion of Farmland, to non-agricultural use? a-e) There are no agricultural zones or forest lands within the, which is a fully urbanized community that has been urbanized for over half a century. The proposed project would have no impact upon agricultural or forest resources and further analysis of this issue in an EIR is not warranted. Potentially Significant Impact Potentially Significant Unless Mitigation Incorporated Less than Significant Impact No Impact III. AIR QUALITY -- Would the Project: a) Conflict with or obstruct implementation of the applicable air quality plan? b) Violate any air quality standard or contribute substantially to an existing or projected air quality violation? c) Result in a cumulatively considerable net increase of any criteria pollutant for which the project region is non-attainment under an applicable federal or state ambient air quality standard (including releasing emissions which exceed quantitative thresholds for ozone precursors)? d) Expose sensitive receptors to substantial pollutant concentrations? e) Create objectionable odors affecting a substantial number of people? 11
154 Pacific Pointe East Development Project Initial Study The project site is within the South Coast Air Basin (the Basin), which is under the jurisdiction of the South Coast Air Quality Management District (SCAQMD). The local air quality management agency (SCAQMD) is required to monitor air pollutant levels to ensure that applicable air quality standards are met and, if they are not met, to develop strategies to meet the standards. Depending on whether or not the standards are met or exceeded, the air basin is classified as being in attainment or nonattainment. The part of the Basin in which the project site is located is a nonattainment area for both the federal and state standards for ozone, particulate matter (PM 10 and PM 2.5), and lead, as well as the state standard for nitrogen dioxide (NOx) (California Air Resources Board, February 2011, April 2013). Thus, the basin currently exceeds several state and federal ambient air quality standards and is required to implement strategies that would reduce the pollutant levels to recognized acceptable standards. This non-attainment status is a result of several factors, the primary ones being the naturally adverse meteorological conditions that limit the dispersion and diffusion of pollutants, the limited capacity of the local airshed to eliminate pollutants from the air, and the number, type, and density of emission sources within the Basin. The SCAQMD has adopted an Air Quality Management Plan (AQMP) that provides a strategy for the attainment of state and federal air quality standards. The SCAQMD has established the following significance thresholds for project operations within the Basin: 55 pounds per day of reactive organic compounds (ROC (also known as ROG or VOC)) 55 pounds per day of nitrogen oxides (NO x) 550 pounds per day of carbon monoxide (CO) 150 pounds per day of sulphur oxides (SO x) 150 pounds per day of particulate matter less than 10 microns in diameter (PM 10) 55 pounds per day of particulate matter less than 2.5 microns in diameter (PM 2.5) The SCAQMD has also adopted the following thresholds for temporary construction-related pollutant emissions: 75 pounds per day ROC 100 pounds per day NO x 550 pounds per day CO 150 pounds per day of PM pounds per day of PM pounds per day SO x The SCAQMD has also developed Localized Significance Thresholds (LSTs) in response to the Governing Board s Environmental Justice Enhancement Initiative (1-4), which was prepared to update the SCAQMD s CEQA Air Quality Handbook. LSTs were devised in response to concern regarding exposure of individuals to criteria pollutants in local communities. LSTs represent the maximum emissions from a project that would not cause or contribute to an air quality exceedance of the most stringent applicable federal or state ambient air quality standard at the nearest sensitive receptor, taking into consideration ambient concentrations in each source receptor area (SRA), project size, and distance to the sensitive receptor. LSTs only apply to emissions within a fixed stationary location, including idling emissions during both project 12
155 Pacific Pointe East Development Project Initial Study construction and operation. LSTs have been developed only for NOx, CO, PM 10 and PM 2.5. LSTs are not applicable to mobile sources such as cars on a roadway (Final Localized Significance Threshold Methodology, SCAQMD, June 2). LSTs have been developed for emissions within areas up to five acres in size, with air pollutant modeling recommended for activity within larger areas. The SCAQMD provides a lookup table for project sites that measure one, two, three, four, or five acres, with allowable emissions for receptors within 25, 50, 100, 200, and 500 meters. The project site is approximately 25 acres and is located in Source Receptor Area 4 (SRA-4), which is designated by the SCAQMD as the South Coastal LA County and includes the. LST thresholds for a five-acre site in SRA-4 are shown in Table 1 for reference (SCAQMD, June 2). The sensitive receptors closest to the project site include: Long Beach City College, which is located immediately to the north and east of the project site, and residences approximately 700 feet east of the project site. The Long Beach City College American Culture and Language Institute is located approximately 100 feet east of the project site, and would be the nearest sensitive receptor. Table 1 SCAQMD LSTs for Emissions in SRA-4 Pollutant Allowable emissions as a function of receptor distance in meters from a one acre site (lbs/day) Gradual conversion of NO x to NO CO ,180 2,296 7,558 PM 10 (construction) PM 10 (operation) PM 2.5 (construction) PM 2.5 (operation) Source: SCAQMD. accessed online November a) Vehicle use, energy consumption, and associated air pollutant emissions are directly related to population growth. The population forecasts upon which the Air Quality Management Plan (AQMP) is based are used to estimate future emissions and devise appropriate strategies to attain state and federal air quality standards. When population growth exceeds the forecasts upon which the AQMP is based, emission inventories could be surpassed, which could affect attainment of standards. However, as discussed in Section XIII, Population and Housing, the proposed project would not induce population growth exceeding these population forecasts. Therefore, the project would not conflict with implementation of an air quality plan, and no impact would occur. Further analysis of this issue in an EIR is not warranted b-d) The sensitive receptors closest to the project site that could potentially be affected by project emissions are Long Beach City College nearby the project site to the north and east, and residential development located approximately 700 feet east of the project site. The Long Beach 13
156 Pacific Pointe East Development Project Initial Study City College American Culture and Language Institute is located approximately 100 feet east of the project site, and would be considered the nearest sensitive receptor. Construction activities for the project would generate temporary air pollutant emissions and fugitive dust emissions associated with demolition of the existing parking lot and construction of the proposed structures, including emissions from construction equipment used in activities such as demolition, minor site grading, asphalt paving, architectural coatings, and motor vehicles transporting construction workers. emissions from construction activities would vary daily as construction activity levels change. Operational emissions would consist primarily of exhaust from vehicles traveling to and from the project site. Other sources of operational emissions would include the occupants of the proposed structures. The types of activity that could occur in the proposed structures include light industrial, light manufacturing, warehouse, office, and research & development. The project s construction and operational emissions could result in a potentially significant impact with respect to air quality standards and effects on sensitive receptors, and be studied further in the EIR. e) It is expected that the proposed project would be occupied by light industrial, light manufacturing, warehouse, office, and research & development uses. Light industrial uses typically do not generate odors that are noticeable off-site. Impacts related to odors would be less than significant and further analysis of this issue in an EIR is not warranted. Potentially Significant Impact Potentially Significant Unless Mitigation Incorporated Less than Significant Impact No Impact IV. BIOLOGICAL RESOURCES -- Would the Project: a) Have a substantial adverse effect, either directly or through habitat modifications, on any species identified as a candidate, sensitive, or special status species in local or regional plans, policies, or regulations, or by the California Department of Fish and Game or U.S. Fish and Wildlife Service? b) Have a substantial adverse effect on any riparian habitat or other sensitive natural community identified in local or regional plans, policies, or regulations, or by the California Department of Fish and Game or U.S. Fish and Wildlife Service? 14
157 Pacific Pointe East Development Project Initial Study Potentially Significant Impact Potentially Significant Unless Mitigation Incorporated Less than Significant Impact No Impact IV. BIOLOGICAL RESOURCES -- Would the Project: c) Have a substantial adverse effect on federally protected wetlands as defined by Section 404 of the Clean Water Act (including, but not limited to, marsh, vernal pool, coastal, etc.) through direct removal, filling, hydrological interruption, or other means? d) Interfere substantially with the movement of any native resident or migratory fish or wildlife species or with established native resident or migratory wildlife corridors, or impede the use of native wildlife nursery sites? e) Conflict with any local policies or ordinances protecting biological resources, such as a tree preservation policy or ordinance? f) Conflict with the provisions of an adopted Habitat Conservation Plan, Natural Community Conservation Plan, or other approved local, regional, or state habitat conservation plan? a- d, f) The proposed project would be located within a developed portion of the City of Long Beach. The project site is located within an existing urbanized area that has been previously disturbed. The site is fully paved and lacks significant native vegetation that provides a habitat for any unique, rare, or endangered plant or animal species. The site does not contain and is not adjacent to wetlands. There is no vegetation present on the project site. Vegetation in the project vicinity consists of ornamental street trees located on Conant Street, on the parcel adjacent to the east of the project site, and the golf course to the south of the project site which is heavily planted with ornamental trees and other vegetation. The area is highly urbanized and there is no potential for adverse effects to wildlife resources or their habitat, either directly or indirectly. There would be no impact and further analysis of this issue in an EIR is not warranted. e) The proposed project would not conflict with any local policies or ordinances protecting biological resources such as trees, nor would it conflict with any conservation plans. There would be no impact and further analysis of this issue in an EIR is not warranted. 15
158 Pacific Pointe East Development Project Initial Study Potentially Significant Impact Potentially Significant Unless Mitigation Incorporated Less than Significant Impact No Impact V. CULTURAL RESOURCES -- Would the Project: a) Cause a substantial adverse change in the significance of a historical resource as defined in ? b) Cause a substantial adverse change in the significance of an archaeological resource as defined in ? c) Directly or indirectly destroy a unique paleontological resource or site or unique geologic feature? d) Disturb any human remains, including those interred outside of formal cemeteries? a) The project site contains an existing surface parking lot. No historic buildings or other resources are present within the site. The nearest designated historical resource is the Long Beach Airport terminal building, which is located approximately 1,700 feet south of the project site (, 2010). This structure would be unaffected by project implementation. Therefore, no impact with regard to historic resources would occur, and further analysis of this issue in an EIR is not warranted. b-d) The proposed project would require grading and excavation for foundations. Earthdisturbing activities have the potential to affect previously undiscovered subsurface resources, including archaeological and paleontological resources and human remains. Because the site is already developed and has therefore been previously disturbed, the likelihood of finding intact archaeological or paleontological resources is considered low. In the unlikely event that such resources are discovered during construction of the proposed project, the applicant would be required to comply with standard procedures for assessment and preservation of such resources compliant with the State Health and Safety Code Section and Public Resources Code Section , which regulate disturbance and disposition of cultural resources and human remains. Although unlikely, if human remains are found during demolition activities, work must stop in the vicinity of the find as well as any area that is reasonably suspected until the County Coroner has been called out and the remains have been investigated and appropriate recommendations have been made for the treatment and disposition of the remains. Compliance with State regulations, which detail the appropriate actions necessary in the event human remains are encountered, would reduce impacts to a less than significant level. Further analysis of this issue in an EIR is not warranted 16
159 Pacific Pointe East Development Project Initial Study Potentially Significant Impact Potentially Significant Unless Mitigation Incorporated Less than Significant Impact No Impact VI. GEOLOGY AND SOILS Would the Project: a) Expose people or structures to potential substantial adverse effects, including the risk of loss, injury, or death involving: i) Rupture of a known earthquake fault, as delineated on the most recent Alquist-Priolo Earthquake Fault Zoning Map issued by the State Geologist for the area or based on other substantial evidence of a known fault? ii) Strong seismic ground shaking? iii) Seismic-related ground failure, including liquefaction? iv) Landslides? b) Result in substantial soil erosion or the loss of topsoil? c) Be located on a geologic unit or soil that is unstable as a result of the Project, and potentially result in on- or off-site landslide, lateral spreading, subsidence, liquefaction, or collapse? d) Be located on expansive soil, as defined in Table 18-1-B of the Uniform Building Code, creating substantial risks to life or property? e) Have soils incapable of adequately supporting the use of septic tanks or alternative wastewater disposal systems where sewers are not available for the disposal of wastewater? a.i and ii) Similar to all of Southern California, active and/or potentially active faults in the region could generate strong groundshaking on the project site. However, the project site is not located within an Alquist-Priolo Earthquake Zone (California Department of Conservation, 1986), so the probability of seismic surface rupture is considered low. Per Plate 2 of the Seismic Safety Element of the General Plan, the most significant fault system in the City is the Newport- Inglewood fault zone. This fault zone runs in a northwest to southeast angle across the southern half of the City. However, the project site is located approximately 1.75 miles northeast of the closest portion of the Newport-Inglewood Fault Zone. Thus, project 17
160 Pacific Pointe East Development Project Initial Study implementation would not expose people or structures to potentially substantial adverse effects involving fault rupture. The project would be required to comply with the California Building Code (CBC). The CBC requires various measures of all construction in California to account for hazards from seismic shaking, and the proposed project would be inspected for compliance with these measures by the Building Bureau prior to Certificate of Occupancy. Impacts related to seismically-induced surface rupture or ground shaking would therefore be less than significant and further analysis of this issue in an EIR is not warranted. a.iii and iv) The project site is located on a relatively flat site in an area that is not susceptible to earthquake induced landslide hazards. However, the site is in an area that is subject to identified liquefaction hazard (California Department of Conservation Seismic Hazard Zones for the Long Beach Quadrangle, 1999). Based on Plate 7, Liquefaction Potential Areas, of the Long Beach General Plan Seismic Safety Element, the project site has a low potential for liquefaction. Based on the geotechnical analysis performed for the project site, soils subject to liquefaction during seismic events are present on the site (Southern California Geotechnical, 2013). The differential settlement associated with liquefaction at this site would be less than 1 inch. The estimated differential settlements could be assumed to occur across a distance of 100 feet, indicating maximum angular distortions of less than inches per inch for both sites. Such settlements are considered to be within the structural tolerances of typical building supported on shallow foundation systems. However, minor to moderate repairs, including repair of damaged drywall and stucco, etc., could be required after the occurrence of liquefaction-induced settlements. Compliance with City and State building codes, which include provisions to mitigate potential liquefaction hazard, would be required of the proposed project. The project would therefore have a less than significant impact related to these hazards and further analysis of this issue in an EIR is not warranted. b) Soil erosion is the removal of soil by water, wind, and gravity. Demolition of the existing parking lot and construction of the structures would involve soil-disturbing activities that could create soil erosion. However, Standard Urban Stormwater Mitigation Plan (SUSMP) and National Pollutant Discharge Elimination System (NPDES) requirements to utilize watering of soils and stormwater Best Management Practices (BMPs) limiting erosion would be enforced on the project, as described in Section IX, Hydrology and Water Quality. These impacts would be less than significant and further analysis of this issue in an EIR is not warranted. c) The project site is located in a topographically flat area and does not contain slopes that are subject to landslide or other geologic hazards that could affect on- or off-site development. Therefore, impacts related to unstable soils and collapse would be less than significant. d) Testing was performed on the soils present on the project site to determine their potential for expansion. The soils tested were determined to have low to medium expansion potential. Project development would require excavation and removal of existing fill soils and the provision of compacted fill to support the proposed structures. It is expected that the compacted fill, in combination with other common methods for addressing expansive soils, would substantially reduce expansion potential at the project site. Compliance with existing City and State building codes would ensure that impacts related to expansive soils are less than significant and further analysis of this issue in an EIR is not warranted. 18
161 Pacific Pointe East Development Project Initial Study e) The project is located in a fully developed part of Long Beach, with access to existing sewer connections, and would not require the use of septic tanks. Therefore, no impact related to the use of septic tanks would occur and further analysis of this issue in an EIR is not warranted. Potentially Significant Impact Potentially Significant Unless Mitigation Incorporated Less than Significant Impact No Impact VII. GREENHOUSE GAS EMISSIONS - Would the Project: a) Generate greenhouse gas emissions, either directly or indirectly, that may have a significant impact on the environment? b) Conflict with any applicable plan, policy, or regulation adopted for the purpose of reducing the emissions of greenhouse gases? a) Project activities would generate greenhouse gas (GHG) emissions through the burning of fossil fuels or other emissions of GHGs, thus potentially contributing to cumulative impacts related to global climate change. Sources of GHG emissions include the operation of heavy equipment and the application of architectural coating during project construction, vehicular emissions from employees traveling to and from the project site, emissions resulting from industrial activities on the project site, and indirect emissions from energy use (electricity and natural gas). The adopted CEQA Guidelines provide general regulatory guidance on the analysis and mitigation of GHG emissions in CEQA documents, but contain no suggested thresholds of significance for GHG emissions. Instead, they give lead agencies the discretion to set quantitative or qualitative thresholds for the assessment and mitigation of GHGs and climate change impacts. The general approach to developing a threshold of significance for GHG emissions is to identify the emissions level for which a project would not be expected to substantially conflict with existing California legislation adopted to reduce statewide GHG emissions needed to move the state towards climate stabilization. This is a potentially significant impact that will be analyzed in the EIR. b. In response to Executive Order (EO) S-3-05, CalEPA created the Climate Action Team (CAT), which in March 2006 published the Climate Action Team Report (the 2006 CAT Report ) (CalEPA, 2006). The 2006 CAT Report identified a recommended list of strategies that the state could pursue to reduce GHG emissions. These are strategies that could be implemented by various state agencies to ensure that the emission reduction targets in EO S-3-05 are met and can be met with existing authority of the state agencies. The strategies include the reduction of passenger and light duty truck emissions, the reduction of idling times for diesel trucks, an overhaul of shipping technology/infrastructure, increased use of alternative fuels, increased recycling, and landfill methane capture, etc. In addition, in 2008 the California Attorney General published The California Environmental Quality Act Addressing Global Warming Impacts at the Local Agency Level (Office of the California Attorney General, Global Warming Measures Updated May 21, 2008). This document provides information that may be helpful to 19
162 Pacific Pointe East Development Project Initial Study local agencies in carrying out their duties under CEQA as they relate to global warming. Included in this document are various measures that may reduce the global warming related impacts of a project. Lastly, Senate Bill 375, signed in August 2008, requires the inclusion of Sustainable Communities Strategies (SCS) in Regional Transportation Plans (RTPs) for the purpose of reducing GHG emissions. In April 2012 SCAG adopted the Regional Transportation Plan/Sustainable Communities Strategy (RTP/SCS). SCAG s RTP/SCS includes a commitment to reduce emissions from transportation sources by promoting compact and infill development in order to comply with SB 375. A goal of the SCS is to promote the development of better places to live and work through measures that encourage more compact development, varied housing options, bike and pedestrian improvements, and efficient transportation infrastructure. The extent to which the proposed project would be consistent with local and regional programs to reduce GHG emissions represents a potentially significant impact that will be analyzed in the EIR. Potentially Significant Impact Potentially Significant Unless Mitigation Incorporated Less than Significant Impact No Impact VIII. HAZARDS AND HAZARDOUS MATERIALS - Would the Project: a) Create a significant hazard to the public or the environment through the routine transport, use, or disposal of hazardous materials? b) Create a significant hazard to the public or the environment through reasonably foreseeable upset and accident conditions involving the release of hazardous materials into the environment? c) Emit hazardous emissions or handle hazardous or acutely hazardous materials, substances, or waste within ¼ mile of an existing or proposed school? d) Be located on a site which is included on a list of hazardous material sites compiled pursuant to Government Code Section and, as a result, would it create a significant hazard to the public or the environment? e) For a project located within an airport land use plan or, where such a plan has not been adopted, within two miles of a public airport or public use airport, would the Project result in a safety hazard for people residing or working in the Project area? 20
163 Pacific Pointe East Development Project Initial Study Potentially Significant Impact Potentially Significant Unless Mitigation Incorporated Less than Significant Impact No Impact VIII. HAZARDS AND HAZARDOUS MATERIALS - Would the Project: f) For a project within the vicinity of a private airstrip, would the Project result in a safety hazard for people residing or working in the Project area? g) Impair implementation of or physically interfere with an adopted emergency response plan or emergency evacuation plan? h) Expose people or structures to a significant risk of loss, injury, or death involving wildland fires, including where wildlands are adjacent to urbanized areas or where residences are intermixed with wildlands? a) The proposed project involves demolition of an existing surface parking lot and construction of three industrial buildings totaling 502,076 square feet of floor area. Operation of the proposed project would not involve the routine transport, use or disposal of hazardous substances. There would be no impact and further analysis of this issue in an EIR is not warranted. b, c) The school nearest to the project site is Long Beach City College, which is located to the north and east of the site. Burcham Elementary School is located approximately 0.7 miles to the southeast of the project. Operation of the proposed project would not involve the routine use or transport of hazardous materials or emit hazardous emissions or handle hazardous or acutely hazardous materials, substances, or waste, and nearby schools would therefore not be adversely affected. Construction of the project would require the demolition of the existing surface parking lot and construction of the proposed industrial buildings. These activities would not expose nearby schools to hazardous materials, emissions, or substances. Compliance with existing state and City regulations regarding the use and transport of hazardous materials would reduce the project s potential impacts related to hazardous emissions or materials affecting school sites within ¼ mile to a less than significant level. Further analysis of this issue in an EIR is not warranted d) The following databases compiled pursuant to Government Code Section were checked (November 13, 2013) for known hazardous materials contamination at the project site: Comprehensive Environmental Response, Compensation, and Liability Information System (CERCLIS) database; Geotracker search for leaking underground storage tanks (LUSTs); 21
164 Pacific Pointe East Development Project Initial Study Investigations- Cleanups (SLIC) and Landfill sites, Cortese list of Hazardous Waste and Substances Sites; and The Department of Toxic Substances Control s Site Mitigation and Brownfields Database. The project site is identified in the Geotracker database as the site of four USTs associated with prior use of the site. Based on the records on the Geotracker online database, potential contaminants of concern on this site as a result of the former uses include 1,1,1-trichloroethane (TCA), benzene, chromium, other chlorinated hydrocarbons, other solvent or non-petroleum hydrocarbon, stoddard solvent/mineral spirits/distillates, tetrachloroethylene (PCE), and trichloroethylene (TCE). The case was opened in 1995 and its status is no further action as of December The record search indicates that cleanup onsite took place and the case was deemed to be closed by the Los Angeles Regional Water Quality Control Board (RWQCB) in January According to Geotracker records, a health risk assessment for the affected area was completed and reviewed by the Office of Environmental Hazard Assessment, and the site was deemed suitable for continued industrial/commercial uses. The closest open status contaminated site is located approximately ¼ mile to the northwest of the project site, with potential contaminants of concern including chlorinated hydrocarbons, metal, polynuclear aromatic hydrocarbons (PAHS), and waste oil. There is no evidence to suggest that any contamination at this site would affect the project site. Thus, construction of the proposed project would not create a significant hazard to the public or the environment from being located on a contaminated site. The impact would be less than significant and further analysis of this issue in an EIR is not warranted. e, f) The project site is located immediately northeast of the Long Beach Municipal Airport. A portion of the southern project site is located in a Runway Protection Zone (RPZ) within the airport s influence area. The proposed project has been designed such that all proposed structures are located beyond the RPZ boundary. Those areas in the southern portion of the project site within the RPZ are planned for development as parking areas and loading docks. The project applicant will be required to submit building plans to the Federal Aviation Administration for review and approval. Thus, air traffic associated with the Long Beach Municipal Airport would not result in a safety hazard at the project site. The project site is not located near any private airstrip. There would be a less than significant impact and further analysis of this issue in an EIR is not warranted. g) The proposed project involves demolition of an existing surface parking lot and the construction of three industrial buildings, and would not conflict with an adopted emergency response plan or emergency evacuation plan or interfere with traffic on adjacent streets. The impact would be less than significant and further analysis of this issue in an EIR is not warranted. h) The project site is located in an urbanized area of Long Beach and is not near any wildlands. Thus the proposed project would not expose persons or structures to wildfire hazard risks. There would be no impact and further analysis of this issue in an EIR is not warranted. 22
165 Pacific Pointe East Development Project Initial Study Potentially Significant Impact Potentially Significant Unless Mitigation Incorporated Less than Significant Impact No Impact IX. HYDROLOGY AND WATER QUALITY Would the Project: a) Violate any water quality standards or waste discharge requirements? b) Substantially deplete groundwater supplies or interfere substantially with groundwater recharge such that there would be a net deficit in aquifer volume or a lowering or the local groundwater table level (e.g., the production rate of preexisting nearby wells would drop to a level which would not support existing land uses or planned uses for which permits have been granted)? c) Substantially alter the existing drainage pattern of the site or area, including through the alteration of the course of a stream or river, in a manner which would result in substantial erosion or siltation onor off-site? d) Substantially alter the existing drainage pattern of the site or area, including the alteration of the course of a stream or river, or substantially increase the rate or amount of surface runoff in a manner which would result in flooding on- or offsite? e) Create or contribute runoff water which would exceed the capacity of existing or planned stormwater drainage systems or provide substantial additional sources of polluted runoff? f) Otherwise substantially degrade water quality? g) Place housing within a 100-year flood hazard area as mapped on a federal Flood Hazard Boundary or Flood Insurance Rate Map or other flood hazard delineation map? h) Place within a 100-year flood hazard area structures which would impede or redirect flood flows? 23
166 Pacific Pointe East Development Project Initial Study Potentially Significant Impact Potentially Significant Unless Mitigation Incorporated Less than Significant Impact No Impact IX. HYDROLOGY AND WATER QUALITY Would the Project: i) Expose people or structures to a significant risk of loss, injury, or death involving flooding, including flooding as a result of the failure of a levee or dam? j) Inundation by seiche, tsunami, or mudflow? a, e-f) The project site is located approximately 4.5 miles north of the Pacific Ocean, 3.4 miles north of Colorado Lagoon, 3.8 miles north of Alamitos Bay, 3.6 miles east of the the Los Angeles River, and 2.5 miles west of the San Gabriel River. Construction activity, including grading, could have the potential to degrade water quality due to sediment erosion or the presence of contaminants located within the soils (as discussed in Section VIII, Hazards and Hazardous Materials). However, on-site activities would be required to comply with the requirements of Long Beach Municipal Code (LBMC) Chapter 18.61, NPDES and SUSMP Regulations. Specifically, proposed construction activities would be required to comply with LBMC Section , which requires construction plans to include construction and erosion and sediment control best management practices (BMPs). Examples of required BMPs include sediment traps, stockpile management, and material delivery and storage. Further, the City would be required to complete and submit a Stormwater Pollution and Prevention Plan (SWPPP) to both the Regional Water Quality Control Board (RWQCB) and the in addition a Notice of Intent (NOI) to comply with the state construction activity storm water permit. Compliance with these requirements would reduce potential impacts associated with water quality during implementation of the proposed project to less than significant. The project does not involve any actions beyond construction activities that would adversely affect water quality. Further analysis of this issue in an EIR is not warranted b) The proposed project would introduce three new industrial buildings totaling 502,076 square feet on the project site. The project would therefore lead to a small increase in consumption of potable water. However, this increase would be so small in comparison to total water usage in this highly urbanized area that it would not significantly impact groundwater. Also, the project would produce little if any increase in impermeable surfaces in the area that would restrict groundwater recharge. The project would therefore not substantially deplete groundwater supplies or interfere substantially with groundwater recharge such that there would be a net deficit in aquifer volume or a lowering or the local groundwater table level, and this impact would be less than significant. Further analysis of this issue in an EIR is not warranted c, d) The proposed project would not alter the surface drainage pattern of the surrounding area. It also would not require the relocation of existing storm drain lines or construction of any new storm drain lines. Storm water would continue to flow into the City s existing storm drain system. The project would not significantly increase the amount of impermeable surfaces on the 24
167 Pacific Pointe East Development Project Initial Study project site, and would therefore not significantly alter the overall amount of surface water drainage such that the project would result in flooding, substantial erosion or siltation on- or off-site. Construction activities, including excavation, may result in sedimentation or erosion on or off-site. However, as discussed above, proposed construction activities would be required to comply with LBMC Section , which requires construction plans to include construction and erosion and sediment control best management practices (BMPs) that would reduce the impacts related to erosion or siltation on or off site to a less than significant level. Impacts related to drainage patterns, both temporary and operational, would be less than significant. Further analysis of this issue in an EIR is not warranted g-h) Per FEMA flood zone maps (#06037C1960F), the project site is located in Zone X, which is within the 500-year flood zone (the area with a 0.2% chance per year of flooding). The proposed project would not impede flood flows or expose people to significant flood-related safety impacts. Consequently, there would be no impact and further analysis of this issue in an EIR is not warranted. i) The proposed project is not subject to flooding due to dam or levee failure, and would not increase exposure to risks associated with dam or levee failure. No impact would occur and further analysis of this issue in an EIR is not warranted. j) A tsunami is a tidal wave produced by off-shore seismic activity; seiches are seismicallyinduced waves that occur in large bodies of water, such as lakes. The project site is not located within a tsunami hazard zone (California Department of Conservation, March 2009). Additionally, because the project site is not sufficiently close to a large body of water other than the ocean, seiches are not a significant concern. As described above in Section VI, Geology and Soils, the project site is not located within an area subject to potentially high landslide or debris and mud flows. Therefore, no impact related to these hazards would occur and further analysis of this issue in an EIR is not warranted. Potentially Significant Impact Potentially Significant Unless Mitigation Incorporated Less than Significant Impact No Impact X. LAND USE AND PLANNING -- Would the proposal: a) Physically divide an established community? b) Conflict with any applicable land use plan, policy, or regulation of an agency with jurisdiction over the Project (including, but not limited to the general plan, specific plan, local coastal program, or zoning ordinance) adopted for the purpose of avoiding or mitigating an environmental effect? 25
168 Pacific Pointe East Development Project Initial Study c) Conflict with an applicable habitat conservation plan or natural community conservation plan? a) The proposed project involves infill development and does not include any components, such as a new road, that would physically divide an established community. No impact would occur and further analysis of this issue in an EIR is not warranted. b) The project site is located in the Douglas Aircraft Planned Development District (PD-19) and within General Plan land use designation Mixed Use (LUD No. 7). The proposed project would require design review to ensure that it complies with the requirements of the PD-19 district and other applicable land use regulations. Upon completion of City review for compliance with the requirements of the PD-19 district, impacts would be less than significant, and further analysis of this issue in an EIR is not warranted. c) The project site is not located within an area that is subject to an adopted habitat conservation plan or natural community plan. No impact would occur and further analysis of this issue in an EIR is not warranted. Potentially Significant Impact Potentially Significant Unless Mitigation Incorporated Less than Significant Impact No Impact XI. MINERAL RESOURCES -- Would the Project: a) Result in the loss of availability of a known mineral resource that would be of value to the region and the residents of the state? b) Result in the loss of availability of a locally important mineral resource recovery site delineated on a local general plan, specific plan, or other land use plan? a-b) The project site and surrounding properties are part of an urbanized area in northeast Long Beach. The project site is not located in a mineral extraction operations area. The proposed project does not involve a mineral resource recovery site and no mineral resource activities would be altered or displaced by the project. Therefore, no impact would occur and further analysis of this issue in an EIR is not warranted. 26
169 Pacific Pointe East Development Project Initial Study Potentially Significant Impact Potentially Significant Unless Mitigation Incorporated Less than Significant Impact No Impact XII. NOISE Would the Project result in: a) Exposure of persons to or generation of noise levels in excess of standards established in the local general plan or noise ordinance, or applicable standards of other agencies? b) Exposure of persons to or generation of excessive groundborne vibration or groundborne noise levels? c) A substantial permanent increase in ambient noise levels above levels existing without the Project? d) A substantial temporary or periodic increase in ambient noise levels in the Project vicinity above levels existing without the Project? e) For a project located within an airport land use plan or, where such a plan has not been adopted, within two miles of a public airport or public use airport, would the Project expose people residing or working in the Project area to excessive noise levels? f) For a project within the vicinity of a private airstrip, would the Project expose people residing or working in the Project area to excessive noise? Noise is defined as unwanted sound that disturbs human activity. Environmental noise levels typically fluctuate over time, and different types of noise descriptors are used to account for this variability. Noise level measurements include intensity, frequency, and duration, as well as time of occurrence. Noise level (or volume) is generally measured in decibels (db) using the A- weighted sound pressure level (dba). In order to determine the compatibility of proposed new uses with existing development, the uses the State Noise/Land Use Compatibility Standards, which suggest a normally acceptable exterior noise exposure of up to 65 dba CNEL for sensitive land uses such as residences and schools. Less sensitive commercial and industrial uses may be compatible with ambient noise levels up to 70 dba, or even 75 dba for industrial uses. The City has not adopted any thresholds or regulations addressing vibration. Vibration impacts would be significant if they exceeded the following Federal Railroad Administration (FRA) thresholds. 27
170 Pacific Pointe East Development Project Initial Study 65VdB where low ambient vibration is essential for interior operations, such as hospitals and recording studios. 72 VdB for residences and buildings where people normally sleep, including hotels. 75 VdB for institutional land uses with primary daytime use, such as churches and schools. 95 VdB for physical damage to extremely fragile historic buildings. 100 VdB for physical damage to buildings. a, c) The proposed project involves demolition of an existing surface parking lot and the construction of three industrial buildings. The project would generate vehicular trips and increase vehicular traffic on surrounding streets. The primary operational sources of noise associated with the proposed project that could increase existing ambient noise levels would be this project-generated traffic, stationary sources such as mechanical equipment, and nonstationary noise such as parking lot noise from vehicles and conversations. Mechanical equipment associated with the proposed project would include equipment such as HVAC systems and equipment associated with industrial development, which would produce temporary noise. However, such HVAC equipment would be subject to Chapter of the LBMC. Enforcement of this regulation would ensure that its operation would not cause a significant operational noise impact. Other operational noise sources would include activity at the planned loading docks in the southern portion of the project site. Construction and operational noise has the potential to affect nearby sensitive receptors and is a potentially significant impact that will be further analyzed in the EIR. b) The proposed project would involve demolition and construction activities at the project site such as pavement removal, grading and paving activities for the proposed surface parking lot, and building construction noise. The operation of heavy construction equipment, particularly in the demolition and grading phases of project implementation, has the potential to cause perceptible vibration at off-site sensitive receptors. This is a potentially significant impact that will be analyzed further in the EIR. d) Project construction would involve the use of heavy equipment associated with grading. Noise generated during this phase would be typical of such site preparation activity and would be temporary. The noise-sensitive land uses closest to the project site include: Long Beach City College, which is located to the north and east of the project site, and residences approximately 700 feet east of the project site. Such noise levels would exceed ambient levels in the area and could cause temporary disturbance to nearby receptors. This is a potentially significant impact that will be analyzed further in the EIR. e) The project site is located immediately northeast of the closest airport, Long Beach Municipal Airport, and within the airport s 70 db noise contour. Exposure to noise from the airport is a potentially significant impact that will be analyzed further in the EIR. f) The project site is not located in the vicinity of a private airstrip, and no impact related to such facilities would occur. Further analysis of this issue in an EIR is not warranted 28
171 Pacific Pointe East Development Project Initial Study Potentially Significant Impact Potentially Significant Unless Mitigation Incorporated Less than Significant Impact No Impact XIII. POPULATION AND HOUSING Would the Project: a) Induce substantial population growth in an area, either directly (for example, by proposing new homes and businesses) or indirectly (for example, through extension of roads or other infrastructure)? b) Displace substantial numbers of existing housing, necessitating the construction of replacement housing elsewhere? c) Displace substantial numbers of people, necessitating the construction of replacement housing elsewhere? a) The proposed project would involve the creation of three new industrial buildings totaling 494,000 square feet. The project does not include new residential development that could directly induce population growth. Employees of businesses operating in the proposed structures could be existing residents of the, commuters from locations outside of the City, or new residents of the City. Based on median employment for similar types of development in Los Angeles County, the proposed project would generate approximately 352 jobs (The Natelson Company, October 2001). The population of the is 462,257 (California Department of Finance, May 2013). The Southern California Association of Governments (SCAG) in its adopted 2012 Integrated Growth Forecast (SCAG, August 2012), forecasts that the population of Long Beach will grow to 491,000 by 2020, which would be a population increase of 28,743 persons, or 6.2%. Population growth as a result of employment created by the proposed project which would be approximately 352 residents, as discussed above would fall well within SCAG s population increase forecast and, therefore, would not directly or indirectly induce substantial population growth in the area. Therefore, this impact would be less than significant and further analysis of this issue in an EIR is not warranted. b, c) The proposed project would not displace any existing housing unit, and therefore no impact would occur. Further analysis of this issue in an EIR is not warranted. 29
172 Pacific Pointe East Development Project Initial Study Potentially Significant Impact Potentially Significant Unless Mitigation Incorporated Less than Significant Impact No Impact XIV. PUBLIC SERVICES a) Would the Project result in substantial adverse physical impacts associated with the provision of new or physically altered governmental facilities, or the need for new or physically altered governmental facilities, the construction of which could cause significant environmental impacts, in order to maintain acceptable service ratios, response times or other performance objectives for any of the public services: i) Fire protection? ii) Police protection? iii) Schools? iv) Parks? v) Other public facilities? a.i, ii) Fire and police protection are provided by the Long Beach Fire Department (LBFD) and the Long Beach Police Department (LBPD). The proposed project does not include any new residential development. As discussed in Section XIII, Population and Housing, the project would not create a significant increase in population compared to projected growth. The project would therefore not significantly affect existing fire and police service ratios and response times or significantly increase the demand for fire and police protection services beyond that already planned. The proposed project would be built according to California Building Code (CBC) requirements. Additionally, the submitted plans would require review and approval from the Development Services Department and all other required departments and agencies to ensure that fire and life safety regulations are met. Therefore, impacts would be less than significant and further analysis of this issue in an EIR is not warranted. a.iii, iv, v) The amount of employment opportunities created by the proposed project would not directly result in significant population increases or significantly increased demand for schools, parks, or other facilities, and this impact would be less than significant. Further analysis of this issue in an EIR is not warranted 30
173 Pacific Pointe East Development Project Initial Study Potentially Significant Impact Potentially Significant Unless Mitigation Incorporated Less than Significant Impact No Impact XV. RECREATION -- a) Would the Project increase the use of existing neighborhood and regional parks or other recreational facilities such that substantial physical deterioration of the facility would occur or be accelerated? b) Does the Project include recreational facilities or require the construction or expansion of recreational facilities which might have an adverse physical effect on the environment? a, b) As discussed in Section XIV, Public Services, the proposed project would not result in significant population growth or new employment opportunities that would result in significantly increased demand for, or increased use of, park or recreational facilities. Furthermore, the project does not propose any recreational facilities that could be used by the public. Therefore the project s impacts on or from recreational facilities would be less than significant and further analysis of this issue in an EIR is not warranted. Potentially Significant Impact Potentially Significant Unless Mitigation Incorporated Less than Significant Impact No Impact XVI. TRANSPORTATION / TRAFFIC -- Would the Project: a) Conflict with an applicable plan, ordinance or policy establishing a measure of effectiveness for the performance of the circulation system, taking into account all modes of transportation, including mass transit and non-motorized travel and relevant components of the circulation system, including but not limited to intersections, streets, highways, and freeways, pedestrian and bicycle paths, and mass transit? 31
174 Pacific Pointe East Development Project Initial Study Potentially Significant Impact Potentially Significant Unless Mitigation Incorporated Less than Significant Impact No Impact XVI. TRANSPORTATION / TRAFFIC -- Would the Project: b) Conflict with an applicable congestion management program, including, but not limited to level of service standards and travel demand measures, or other standards established by the county congestion management agency for designated roads or highways? c) Result in a change in air traffic patterns, including either an increase in traffic levels or a change in location that results in substantial safety risks? d) Substantially increase hazards due to a design feature (e.g., sharp curves or dangerous intersections) or incompatible use (e.g., farm equipment)? e) Result in inadequate emergency access? f) Conflict with adopted policies, plans, or programs regarding public transit, bikeways, or pedestrian facilities, or otherwise substantially decrease the performance or safety of such facilities? a, b) The proposed project is located in the Douglas Aircraft Planned Development District (PD-19), which allows new development intensity within this District to equal no more than 5,503 vehicle trips to and from the District in the peak period between 4 and 6PM. Although the project itself would generate less than this threshold (366 PM peak hour trips), the project s trip generation combined with other land uses has the potential to exceed this threshold. The project s impacts on traffic in the area and its consistency with the requirements of the PD-19 District and other plans are therefore potentially significant and will be evaluated in the EIR. c) As discussed in Section VIII, Hazards and Hazardous Materials, the project site is located immediately northeast of the Long Beach Municipal Airport. A portion of the southern project site is located in a Runway Protection Zone (RPZ) within the airport s influence area. The proposed project has been designed such that all proposed structures are located beyond the RPZ boundary. Those areas in the southern portion of the project site within the RPZ are planned for development as parking areas and loading docks. The proposed project would not result in changes in air traffic patterns. There would be no impact in this regard and further study of this issue is not warranted. d) Site plans for the proposed project would be reviewed by the City to ensure that the project would not include any design features that could present traffic hazards. Vehicular access to 32
175 Pacific Pointe East Development Project Initial Study the project site would be taken from three planned driveways on Conant Street, similar to the existing site access for the surface parking lot currently on the site. Construction activity for the project may result in temporary safety impacts to surrounding streets such as Lakewood Boulevard, Conant Street, and Clark Avenue for all users including drivers, bicyclists, and pedestrians. Also, because of changes in driveway location and different traffic levels and circulation patterns, operation of the project has the potential to create hazardous design features. This impact is therefore potentially significant and will be further evaluated in the EIR. e) As stated under impact XVId) above, the project may have both temporary constructionrelated and permanent operational safety impacts on immediately surrounding streets, and while no temporary or permanent street closures are anticipated, the project s impacts related to hazardous design features and site access are potentially significant. These impacts are therefore also potentially significant for emergency vehicles, which would also need to access the site in case of emergency. Impacts related to emergency access are therefore potentially significant and will be evaluated in the EIR. f) The proposed project would not directly result in changes to the public transportation system that would conflict with adopted policies plans or programs. Transit access to City of Long Beach bus lines is currently available adjacent to the project site at the intersection of Conant Street with both Lakewood Boulevard and the intersection of Conant Street with Clark Avenue. People employed at the project site may use existing transit services to reach the project site. Project-related increases in the use of existing transit resources would be a less than significant impact and further study of this issue is not warranted. Potentially Significant Impact Potentially Significant Unless Mitigation Incorporated Less than Significant Impact No Impact XVII. UTILITIES AND SERVICE SYSTEMS -- Would the Project: a) Exceed wastewater treatment requirements of the applicable Regional Water Quality Control Board? b) Require or result in the construction of new water or wastewater treatment facilities or expansion of existing facilities, the construction of which could cause significant environmental effects? c) Require or result in the construction of new storm water drainage facilities or expansion of existing facilities, the construction of which could cause significant environmental effects? 33
176 Pacific Pointe East Development Project Initial Study Potentially Significant Impact Potentially Significant Unless Mitigation Incorporated Less than Significant Impact No Impact XVII. UTILITIES AND SERVICE SYSTEMS -- Would the Project: d) Have sufficient water supplies available to serve the Project from existing entitlements and resources, or are new or expanded entitlements needed? e) Result in a determination by the wastewater treatment provider which serves or may serve the Project that it has adequate capacity to serve the Project s projected demand in addition to the provider s existing commitments? f) Be served by a landfill with sufficient permitted capacity to accommodate the Project s solid waste disposal needs? g) Comply with federal, state, and local statutes and regulations related to solid waste? a, b, e) The proposed project would require connection to existing sewer infrastructure and would result in an increase in the amount of wastewater produced on the site. The site is already served by the City s existing sewer system. Based on standard wastewater generation rates developed by the Sanitation Districts of Los Angeles County, the proposed project would generate an estimated 10 gallons of wastewater per 1,000 square feet per day, or approximately 5,021 gallons per day (gpd) (Sanitation Districts of Los Angeles, 2013). Currently, a majority of the City s wastewater is delivered to the Joint Water Pollution Control Plant (JWPCP) of the Los Angeles County Sanitation Districts. The remaining portion of the City s wastewater is delivered to the Long Beach Water Reclamation Plant of the Los Angeles County Sanitation Districts. The JWPCP provides advanced primary and partial secondary treatment for 350 million gallons of wastewater per day (mgd). The Long Beach Water Reclamation Plant provides primary, secondary, and tertiary treatment for 25 mgd of wastewater. Project operation would result in a 0.001% increase in demand for wastewater treatment compared to the available treatment capacity of 375 mgd. Thus, the project would not exceed wastewater treatment requirements, exceed the capacity of the City s wastewater systems, or require the construction of new wastewater treatment facilities. These impacts would be less than significant and further analysis of this issue in an EIR is not warranted. c) As discussed in Section IX, Hydrology and Water Quality, the proposed project would not substantially change the amount of impervious surfaces on the project site, and the project would therefore not significantly increase the amount of runoff from the site. It would therefore not require or result in the construction of new storm water drainage facilities or expansion of existing facilities, the construction of which could cause significant environmental effects, and would have no impact in this regard. Further analysis of this issue in an EIR is not warranted 34
177 Pacific Pointe East Development Project Initial Study d) The proposed project would require connection to existing water delivery infrastructure and would result in an increase in the amount of water consumed on the site. The site is already served by the City s existing water system. Based on the project s estimated wastewater generation, project water demand can be estimated at 6,025 gpd, or 6.75 acre-feet per year. The City s 2010 Urban Water Management Plan (UWMP) reports total Citywide water demand for 2010 at 63,448 acre-feet. This is projected to increase by 4,172 acre-feet (or 6.6 percent) to 67,620 acre-feet in Project water demand would represent less than 0.2 percent of the forecast increase in water demand. Adequate water supplies are identified in the UWMP to meet future demand. Based on the project s incremental contribution to future demand, it is not expected that new sources of water supply would be required to meet project water needs. This would be a less than significant impact and further analysis of this issue in an EIR is not warranted. f, g) Demolition materials, including asphalt and concrete, would be disposed of at either the Azusa Landfill or the Puente Hills Landfill. Azusa Landfill is a Class III landfill with 6,500 tons per day capacity that accepts inert waste and contaminated soil (CalRecycle, 2013). Demolition materials containing any contaminated soils (if found onsite as described in Section VIII, Hazards and Hazardous Materials) would be disposed of at this landfill. All other demolition waste would be disposed of at the Scholl Canyon Landfill, which is a Class III landfill with 3,400 tons per day capacity (CalRecycle, 2013). Asphalt and concrete demolition debris would likely be recycled at Hanson Aggregates, a local construction recycling facility in Long Beach (located approximately 5 miles north of the site). Demolition materials would be a one-time deposit and the project would not be a continuous solid waste generator. Based on solid waste generation rates provided by CalRecycle for similar types of uses, the project would generate an estimated 2.5 tons per day of solid waste (CalRecycle, 2013). Based on the disposal capacity of landfills serving the project site, this would be an incremental increase in total disposal that would not affect the availability of solid waste disposal capacity. Therefore, impacts related to solid waste would be less than significant and further analysis of this issue in an EIR is not warranted. Potentially Significant Impact Potentially Significant Unless Mitigation Incorporated Less than Significant Impact No Impact XVIII. MANDATORY FINDINGS OF SIGNIFICANCE a) Does the Project have the potential to substantially reduce the habitat of a fish or wildlife species, cause a fish or wildlife population to drop below self- sustaining levels, eliminate a plant or animal community, reduce the number or restrict the range of a rare or endangered plant or animal or eliminate important examples of the major periods of California history or prehistory? 35
178 Pacific Pointe East Development Project Initial Study b) Does the Project have impacts that are individually limited, but cumulatively considerable? ( Cumulatively considerable means that the incremental effects of a project are considerable when viewed in connection with the effects of past projects, the effects of other current projects, and the effects of probable future projects)? c) Does the Project have environmental effects which will cause substantial adverse effects on human beings, either directly or indirectly? a) As discussed in Section V, Cultural Resources, the project site does not contain potentially historic structures that would be removed or altered by the proposed project. The project would also be required to comply with standard procedures for assessment and preservation of subsurface resources compliant with the State Health and Safety Code Section and Public Resources Code Section , which regulate disturbance and disposition of cultural resources and human remains. Compliance with these regulations, which detail the appropriate actions necessary in the event human remains are encountered, would reduce impacts to these cultural resources to a less than significant level. As discussed in Section IV, Biological Resources, the project area is located within an existing urbanized area that has been previously disturbed. The site lacks significant native vegetation that would provide a habitat for any unique, rare, or endangered plant or animal species. The site does not contain and is not adjacent to wetlands. Vegetation in the area is limited to ornamental street trees and other ornamental vegetation along local streets and on private property. The area is highly urbanized and there is no potential for adverse effects to wildlife resources or their habitat either directly or indirectly. There would be no impact related to biological resources. b) The proposed project has potentially significant impacts related to aesthetics, air quality, greenhouse gas emissions, land use, noise, and traffic, which could potentially contribute to cumulative impacts in the same areas. The project s potentially significant cumulative impacts will be studied in the EIR. c) As analyzed in this Initial Study, the proposed project has potentially significant environmental effects in the areas of aesthetics, air quality, greenhouse gas emissions, land use, noise, and traffic, but these environmental effects would not cause substantial adverse effects on human beings, either directly or indirectly. The project s impacts in this area are therefore less than significant. 36
179 Pacific Pointe East Development Project Initial Study References California Air Resources Board. Climate Change Emission Control Fact Sheet, California Air Resources Board. Area Designation Maps/State and National. February 2011, April Website: Accessed October California Climate Change Center. Climate Scenarios for California California Department of Conservation, California Geological Society. Alquist Priolo Fault Zone Maps. Accessed November California Department of Conservation. Los Angeles County Tsunami Inundation Maps. March Website: Accessed November California Department of Conservation. Seismic Hazard Zones for the Long Beach Quadrangle. March California Department of Finance. E-1 Population Estimates for Cities, Counties, and the State January 1, 2011 and May Website: Accessed November California Department of Toxic Substances Control. Envirostor Database. Website: Accessed November California Department of Water Resources. Progress on Incorporating Climate Change into Management of California s Water Resources. July California Energy Commission. Inventory of California Greenhouse Gas Emissions and Sinks: Staff Final Report. CEC SF. December California Energy Commission. Inventory Draft 2009 Biennial Report to the Governor and Legislature. Staff Draft Report. March California Environmental Protection Agency, March Climate Action Team Report to Governor Schwarzenegger and the Legislature. /climate_action_team/reports/ _final_cat_report_execsummary.pdf. CalRecycle. Solid Waste Information System. /Search.aspx. Accessed November
180 Pacific Pointe East Development Project Initial Study CalRecycle. Estimated Solid Waste Generation Rates. /wastegenrates/. Accessed November California State Water Quality Control Board. Geotracker database. Website: Accessed November Cayan, D., A.L. Luers, M. Hanemann, G. Granco, and B. Croes. Scenarios of Climate Change in California: An Overview. California Climate Change Center, State of California. White Paper, CEC SF. March Cayan, D., E. Maurer, M. Dettinger, M. Tyree, K. Hayhoe, C. Bonfils, P. Duffy, and B. Santer. Climate Scenarios for California: Climate Action Team Reports to the Governor and Legislature , Existing Conditions Report for Historic Preservation Element, General Plan, Housing Element, General Plan, Historic Preservation Element, General Plan, Land Use Element, Revised and Reprinted April, General Plan, Noise Element, General Plan, Open Space Element, October General Plan Seismic Safety Element, Municipal Code website. Accessed November LB Planning website. Accessed November 2013., Water Department Urban Water Management Plan. Energy Information Administration, Department of Energy. Official Energy Statistics from the U.S. Government. December Federal Emergency Management Agency (FEMA). Flood Insurance Rate Map (FIRM), Los Angeles, California, and Incorporated Areas, Map Number 06037C1960F. September FTA (Federal Transit Administration). Noise and Vibration Impact Assessment. May
181 Pacific Pointe East Development Project Initial Study Intergovernmental Panel on Climate Change [IPCC], 2007: Summary for Policymakers. In: Climate Change 2007: The Physical Science Basis. Contribution of Working Group I to the Fourth Assessment Report of the Intergovernmental Panel on Climate Change [Solomon, S., D. Qin, M. Manning, Z. Chen, M. Marquis, K.B. Averyt, M.Tignor and H.L. Miller (eds.)]. Cambridge University Press, Cambridge, United Kingdom and New York, NY, USA. Kiparsky, Michael and Peter H. Gleick, 2. Climate Change and California Water Resources: A Survey and Summary of the Literature. California Energy Commission Report Parmesan C, Galbraith H Observed Ecological Impacts of Climate Change in North America. Arlington, VA: Pew Cent. Glob. Clim. Change. Parmesan, C Ecological and Evolutionary Responses to Recent Climate Change. Sanitation Districts of Los Angeles County. Table of Standard Loadings. Website: Accessed November South Coast Air Quality Management District Air Quality Management Plan. June 1, South Coast Air Quality Management District CEQA Air Quality Handbook Accessed March, South Coast Air Quality Management District. CEQA, Final Localized Significance Threshold Methodology, SCAQMD. June 2. Website: /handbook/lst/method_final.pdf. Accessed November Southern California Association of Governments. Adopted 2012 RTP Growth Forecast. Website. Accessed November Southern California Geotechnical. Geotechnical Investigation and Liquefaction Evaluation, Proposed Commercial/Industrial Development Lot D The Natelson Company. Employment Density Study Summary Report. October 31, United Nations Framework Convention on Climate Change ( United States Environmental Protection Agency. CERCLIS database. Website: Accessed November United States Environmental Protection Agency. EnviroMapper database. Website: Accessed November U.S. Environmental Protection Agency (USEPA). Inventory of U.S. Greenhouse Gas Emissions and Sinks: April 15, 2008 Final. 39
182 Pacific Pointe East Development Project Initial Study This page intentionally left blank. 40
 570-6458 - FAX (562) 570-6068 NOTICE OF PREPARATION TO: SUBJECT: Agencies, Organizations and Interested Parties Notice of Preparation of a Draft Environmental Impact Report")
183 CITY OF LONG BEACH DEPARTMENT OF DEVELOPMENT SERVICES 333 W. Ocean Blvd. Long Beach, CA (562) FAX (562) NOTICE OF PREPARATION TO: SUBJECT: Agencies, Organizations and Interested Parties Notice of Preparation of a Draft Environmental Impact Report in Compliance with Title 14, Section 15082(a) of the California Code of Regulations Pursuant to Public Resources Code Section and the Guidelines for the California Environmental Quality Act (CEQA) Section 15050, the is the Lead Agency responsible for preparation of an Environmental Impact Report (EIR) addressing potential impacts associated with the project identified below. AGENCIES: The purpose of this notice is to serve as a Notice of Preparation (NOP) of an EIR pursuant to the State CEQA Guidelines Section 15082, and solicit comments and suggestions regarding the scope and content of the EIR to be prepared for the proposed project. Specifically, the requests input on the environmental information that is germane to your agency s statutory responsibility in connection with the proposed project. Your agency may rely on the Draft EIR prepared by the City when considering permits or other approvals for this project. ORGANIZATIONS AND INTERESTED PARTIES: The requests your comments and concerns regarding the proposed scope and content of the environmental information to be included in the EIR. PROJECT TITLE: Pacific Pointe East Development Project PROJECT LOCATION: Southeast corner of Lakewood Boulevard and Conant Street near the Long Beach Airport (Los Angeles County Assessor s ID Number ). PROJECT DESCRIPTION: The proposed project involves construction of three industrial buildings on a site currently improved as a paved surface parking lot. These buildings would have an open floor plan and are intended for light industrial, light manufacturing, warehouse, office, and/or research and development land uses. These three buildings would have a maximum height of 41 feet with a total floor area of 494,000 square feet and 722 on-site parking spaces, broken down as follows: Building 9 144,000 square feet with 221 parking spaces; Building ,000 square feet with 156 parking spaces; and Building ,000 square feet with 345 parking spaces. PROBABLE ENVIRONMENTAL EFFECTS OF THE PROJECT: Based on the findings of the Initial Study, the proposed project could have potentially significant impacts on the following environmental factors: Aesthetics, Air Quality, Greenhouse Gas Emissions, Noise, and Transportation/Traffic.
184 Pacific Pointe East Development Project NOP Page 2 PUBLIC REVIEW PERIOD: This NOP is available for public review and comment pursuant to California Code of Regulations, Title 14, Section 15082(b). The public review and comment period during which the will receive comments on the NOP for this proposed project is: Beginning: Wednesday, January 22, 2014 Ending: Thursday, February 20, 2014 THE NOP AND INITIAL STUDY ARE AVAILABLE FOR PUBLIC REVIEW AT THE FOLLOWING LOCATIONS: City Hall, 333 W. Ocean Boulevard, 5 th Floor Long Beach Main Library, 101 Pacific Avenue Online at: RESPONSES AND COMMENTS: Please list a contact person for your agency or organization, include U.S. mail and addresses, and send your comments to: Craig Chalfant Planning Bureau, Development Services Department 333 W. Ocean Boulevard, 5 th Floor Long Beach, CA Or via to: craig.chalfant@longbeach.gov

185
186
187
188
189
190

191

192
193 Appendix B CalEEMod Emissions Modeling
194 CalEEMod Version: CalEEMod Page 1 of 31 Date: 4/11/2014 3:27 PM 1.0 Project Characteristics 1.1 Land Usage Pacific Pointe South Coast Air Basin, Annual Land Uses Size Metric Lot Acreage Floor Surface Area Population General Light Industry sqft , Other Project Characteristics Urbanization Urban Wind Speed (m/s) 2.2 Precipitation Freq (Days) 31 Climate Zone 11 Operational Year 2016 Utility Company Southern California Edison CO2 Intensity (lb/mwhr) CH4 Intensity (lb/mwhr) N2O Intensity (lb/mwhr) User Entered Comments & Non-Default Data Project Characteristics - Land Use - Changed lot acreage to reflect project site Construction Phase - Adjusted construction schedule per applicant Trips and VMT - Adjusted trips per applicant schedule Demolition - Land Use Change - Sequestration - Mobile Land Use Mitigation - Area Mitigation - Architectural Coating - Corrected square footage
195 CalEEMod Version: CalEEMod Page 2 of 31 Date: 4/11/2014 3:27 PM Table Name Column Name Default Value New Value tblarchitecturalcoating ConstArea_Nonresidential_Interior 741, , tblarchitecturalcoating EF_Nonresidential_Exterior tblarchitecturalcoating EF_Nonresidential_Interior tblconstructionphase NumDays tblconstructionphase PhaseEndDate 12/29/ /29/2016 tbllanduse LotAcreage tblprojectcharacteristics OperationalYear tblsequestration NumberOfNewTrees Emissions Summary
196 CalEEMod Version: CalEEMod Page 3 of 31 Date: 4/11/2014 3:27 PM 2.1 Overall Construction Unmitigated Construction ROG NOx CO SO2 Fugitive Total Fugitive Total Bio- CO2 NBio- CO2 Total CO2 CH4 N2O CO2e Year tons/yr MT/yr e e Total , , , Mitigated Construction ROG NOx CO SO2 Fugitive Total Fugitive Total Bio- CO2 NBio- CO2 Total CO2 CH4 N2O CO2e Year tons/yr MT/yr e e Total , , , ROG NOx CO SO2 Fugitive Total Fugitive Total Bio- CO2 NBio-CO2 Total CO2 CH4 N20 CO2e Percent Reduction
197 CalEEMod Version: CalEEMod Page 4 of 31 Date: 4/11/2014 3:27 PM 2.2 Overall Operational Unmitigated Operational ROG NOx CO SO2 Fugitive Total Fugitive Total Bio- CO2 NBio- CO2 Total CO2 CH4 N2O CO2e Category tons/yr MT/yr Area e e e e e e e Energy e , , , Mobile , , , Waste Water Total , , ,
198 CalEEMod Version: CalEEMod Page 5 of 31 Date: 4/11/2014 3:27 PM 2.2 Overall Operational Mitigated Operational ROG NOx CO SO2 Fugitive Total Fugitive Total Bio- CO2 NBio- CO2 Total CO2 CH4 N2O CO2e Category tons/yr MT/yr Area e e e e e e e Energy e , , , Mobile , , , Waste Water Total , , , ROG NOx CO SO2 Fugitive Total Fugitive Total Bio- CO2 NBio-CO2 Total CO2 CH4 N20 CO2e Percent Reduction
199 CalEEMod Version: CalEEMod Page 6 of 31 Date: 4/11/2014 3:27 PM 2.3 Vegetation Vegetation CO2e Category MT New Trees Total Construction Detail Construction Phase Phase Number Phase Name Phase Type Start Date End Date Num Days Week Num Days Phase Description 1 Demolition Demolition 1/1/2015 1/28/ Site Preparation Site Preparation 1/29/2015 2/11/ Grading Grading 2/12/2015 4/1/ Building Construction Building Construction 4/2/2015 8/31/ Paving Paving 9/1/2016 9/28/ Architectural Coating Architectural Coating 9/29/ /29/ Acres of Grading (Site Preparation Phase): 0 Acres of Grading (Grading Phase): 87.5 Acres of Paving: 0
200 CalEEMod Version: CalEEMod Page 7 of 31 Date: 4/11/2014 3:27 PM Residential Indoor: 0; Residential Outdoor: 0; Non-Residential Indoor: 494,000; Non-Residential Outdoor: 247,000 (Architectural Coating sqft) OffRoad Equipment Phase Name Offroad Equipment Type Amount Usage Hours Horse Power Load Factor Demolition Concrete/Industrial Saws Demolition Excavators Demolition Rubber Tired Dozers Site Preparation Rubber Tired Dozers Site Preparation Tractors/Loaders/Backhoes Grading Excavators Grading Graders Grading Rubber Tired Dozers Grading Scrapers Grading Tractors/Loaders/Backhoes Building Construction Cranes Building Construction Forklifts Building Construction Generator Sets Building Construction Tractors/Loaders/Backhoes Building Construction Welders Paving Pavers Paving Paving Equipment Paving Rollers Architectural Coating Air Compressors Trips and VMT
201 CalEEMod Version: CalEEMod Page 8 of 31 Date: 4/11/2014 3:27 PM Phase Name Offroad Equipment Count Worker Trip Number Vendor Trip Number Hauling Trip Number Worker Trip Length Vendor Trip Length Hauling Trip Length Worker Vehicle Class Vendor Vehicle Class Hauling Vehicle Class Demolition LD_Mix HDT_Mix HHDT Site Preparation LD_Mix HDT_Mix HHDT Grading LD_Mix HDT_Mix HHDT Building Construction LD_Mix HDT_Mix HHDT Paving LD_Mix HDT_Mix HHDT Architectural Coating LD_Mix HDT_Mix HHDT 3.1 Mitigation Measures Construction 3.2 Demolition Unmitigated Construction On-Site ROG NOx CO SO2 Fugitive Total Fugitive Total Bio- CO2 NBio- CO2 Total CO2 CH4 N2O CO2e Category tons/yr MT/yr Fugitive Dust Off-Road e- 004 Total e
202 CalEEMod Version: CalEEMod Page 9 of 31 Date: 4/11/2014 3:27 PM 3.2 Demolition Unmitigated Construction Off-Site ROG NOx CO SO2 Fugitive Total Fugitive Total Bio- CO2 NBio- CO2 Total CO2 CH4 N2O CO2e Category tons/yr MT/yr Hauling Vendor Worker e e e e e e e e e e Total e e e e e e e e e e Mitigated Construction On-Site ROG NOx CO SO2 Fugitive Total Fugitive Total Bio- CO2 NBio- CO2 Total CO2 CH4 N2O CO2e Category tons/yr MT/yr Fugitive Dust Off-Road e- 004 Total e
203 CalEEMod Version: CalEEMod Page 10 of 31 Date: 4/11/2014 3:27 PM 3.2 Demolition Mitigated Construction Off-Site ROG NOx CO SO2 Fugitive Total Fugitive Total Bio- CO2 NBio- CO2 Total CO2 CH4 N2O CO2e Category tons/yr MT/yr Hauling Vendor Worker e e e e e e e e e e Total e e e e e e e e e e Site Preparation Unmitigated Construction On-Site ROG NOx CO SO2 Fugitive Total Fugitive Total Bio- CO2 NBio- CO2 Total CO2 CH4 N2O CO2e Category tons/yr MT/yr Fugitive Dust Off-Road e- 004 Total e e e
204 CalEEMod Version: CalEEMod Page 11 of 31 Date: 4/11/2014 3:27 PM 3.3 Site Preparation Unmitigated Construction Off-Site ROG NOx CO SO2 Fugitive Total Fugitive Total Bio- CO2 NBio- CO2 Total CO2 CH4 N2O CO2e Category tons/yr MT/yr Hauling Vendor Worker e e e e e e e e e e e Total e e e e e e e e e e e Mitigated Construction On-Site ROG NOx CO SO2 Fugitive Total Fugitive Total Bio- CO2 NBio- CO2 Total CO2 CH4 N2O CO2e Category tons/yr MT/yr Fugitive Dust Off-Road e- 004 Total e e e
205 CalEEMod Version: CalEEMod Page 12 of 31 Date: 4/11/2014 3:27 PM 3.3 Site Preparation Mitigated Construction Off-Site ROG NOx CO SO2 Fugitive Total Fugitive Total Bio- CO2 NBio- CO2 Total CO2 CH4 N2O CO2e Category tons/yr MT/yr Hauling Vendor Worker e e e e e e e e e e e Total e e e e e e e e e e e Grading Unmitigated Construction On-Site ROG NOx CO SO2 Fugitive Total Fugitive Total Bio- CO2 NBio- CO2 Total CO2 CH4 N2O CO2e Category tons/yr MT/yr Fugitive Dust Off-Road e- Total e
206 CalEEMod Version: CalEEMod Page 13 of 31 Date: 4/11/2014 3:27 PM 3.4 Grading Unmitigated Construction Off-Site ROG NOx CO SO2 Fugitive Total Fugitive Total Bio- CO2 NBio- CO2 Total CO2 CH4 N2O CO2e Category tons/yr MT/yr Hauling Vendor Worker e e e e e e e e e e Total e e e e e e e e e e Mitigated Construction On-Site ROG NOx CO SO2 Fugitive Total Fugitive Total Bio- CO2 NBio- CO2 Total CO2 CH4 N2O CO2e Category tons/yr MT/yr Fugitive Dust Off-Road e- Total e
207 CalEEMod Version: CalEEMod Page 14 of 31 Date: 4/11/2014 3:27 PM 3.4 Grading Mitigated Construction Off-Site ROG NOx CO SO2 Fugitive Total Fugitive Total Bio- CO2 NBio- CO2 Total CO2 CH4 N2O CO2e Category tons/yr MT/yr Hauling Vendor Worker e e e e e e e e e e Total e e e e e e e e e e Building Construction Unmitigated Construction On-Site ROG NOx CO SO2 Fugitive Total Fugitive Total Bio- CO2 NBio- CO2 Total CO2 CH4 N2O CO2e Category tons/yr MT/yr Off-Road e- Total e
208 CalEEMod Version: CalEEMod Page 15 of 31 Date: 4/11/2014 3:27 PM 3.5 Building Construction Unmitigated Construction Off-Site ROG NOx CO SO2 Fugitive Total Fugitive Total Bio- CO2 NBio- CO2 Total CO2 CH4 N2O CO2e Category tons/yr MT/yr Hauling Vendor e e Worker e e e Total e Mitigated Construction On-Site ROG NOx CO SO2 Fugitive Total Fugitive Total Bio- CO2 NBio- CO2 Total CO2 CH4 N2O CO2e Category tons/yr MT/yr Off-Road e- Total e
209 CalEEMod Version: CalEEMod Page 16 of 31 Date: 4/11/2014 3:27 PM 3.5 Building Construction Mitigated Construction Off-Site ROG NOx CO SO2 Fugitive Total Fugitive Total Bio- CO2 NBio- CO2 Total CO2 CH4 N2O CO2e Category tons/yr MT/yr Hauling Vendor e e Worker e e e Total e Building Construction Unmitigated Construction On-Site ROG NOx CO SO2 Fugitive Total Fugitive Total Bio- CO2 NBio- CO2 Total CO2 CH4 N2O CO2e Category tons/yr MT/yr Off-Road e- Total e
210 CalEEMod Version: CalEEMod Page 17 of 31 Date: 4/11/2014 3:27 PM 3.5 Building Construction Unmitigated Construction Off-Site ROG NOx CO SO2 Fugitive Total Fugitive Total Bio- CO2 NBio- CO2 Total CO2 CH4 N2O CO2e Category tons/yr MT/yr Hauling Vendor e e e e Worker e e e e Total e Mitigated Construction On-Site ROG NOx CO SO2 Fugitive Total Fugitive Total Bio- CO2 NBio- CO2 Total CO2 CH4 N2O CO2e Category tons/yr MT/yr Off-Road e- Total e
211 CalEEMod Version: CalEEMod Page 18 of 31 Date: 4/11/2014 3:27 PM 3.5 Building Construction Mitigated Construction Off-Site ROG NOx CO SO2 Fugitive Total Fugitive Total Bio- CO2 NBio- CO2 Total CO2 CH4 N2O CO2e Category tons/yr MT/yr Hauling Vendor e e e e Worker e e e e Total e Paving Unmitigated Construction On-Site ROG NOx CO SO2 Fugitive Total Fugitive Total Bio- CO2 NBio- CO2 Total CO2 CH4 N2O CO2e Category tons/yr MT/yr Off-Road e e Paving Total e e
212 CalEEMod Version: CalEEMod Page 19 of 31 Date: 4/11/2014 3:27 PM 3.6 Paving Unmitigated Construction Off-Site ROG NOx CO SO2 Fugitive Total Fugitive Total Bio- CO2 NBio- CO2 Total CO2 CH4 N2O CO2e Category tons/yr MT/yr Hauling Vendor Worker e e e e e e e e e e e Total e e e e e e e e e e e Mitigated Construction On-Site ROG NOx CO SO2 Fugitive Total Fugitive Total Bio- CO2 NBio- CO2 Total CO2 CH4 N2O CO2e Category tons/yr MT/yr Off-Road e e Paving Total e e
213 CalEEMod Version: CalEEMod Page 20 of 31 Date: 4/11/2014 3:27 PM 3.6 Paving Mitigated Construction Off-Site ROG NOx CO SO2 Fugitive Total Fugitive Total Bio- CO2 NBio- CO2 Total CO2 CH4 N2O CO2e Category tons/yr MT/yr Hauling Vendor Worker e e e e e e e e e e e Total e e e e e e e e e e e Architectural Coating Unmitigated Construction On-Site ROG NOx CO SO2 Fugitive Total Fugitive Total Bio- CO2 NBio- CO2 Total CO2 CH4 N2O CO2e Category tons/yr MT/yr Archit. Coating Off-Road e e e e e e e Total e e e e e e
214 CalEEMod Version: CalEEMod Page 21 of 31 Date: 4/11/2014 3:27 PM 3.7 Architectural Coating Unmitigated Construction Off-Site ROG NOx CO SO2 Fugitive Total Fugitive Total Bio- CO2 NBio- CO2 Total CO2 CH4 N2O CO2e Category tons/yr MT/yr Hauling Vendor Worker e e e e e e e e e e Total e e e e e e e e e e Mitigated Construction On-Site ROG NOx CO SO2 Fugitive Total Fugitive Total Bio- CO2 NBio- CO2 Total CO2 CH4 N2O CO2e Category tons/yr MT/yr Archit. Coating Off-Road e e e e e e e Total e e e e e e
215 CalEEMod Version: CalEEMod Page 22 of 31 Date: 4/11/2014 3:27 PM 3.7 Architectural Coating Mitigated Construction Off-Site ROG NOx CO SO2 Fugitive Total Fugitive Total Bio- CO2 NBio- CO2 Total CO2 CH4 N2O CO2e Category tons/yr MT/yr Hauling Vendor Worker e e e e e e e e e e Total e e e e e e e e e e Operational Detail - Mobile 4.1 Mitigation Measures Mobile ROG NOx CO SO2 Fugitive Total Fugitive Total Bio- CO2 NBio- CO2 Total CO2 CH4 N2O CO2e Category tons/yr MT/yr Mitigated , , , Unmitigated , , ,
216 CalEEMod Version: CalEEMod Page 23 of 31 Date: 4/11/2014 3:27 PM 4.2 Trip Summary Information Average Daily Trip Rate Unmitigated Mitigated Land Use Weekday Saturday Sunday Annual VMT Annual VMT General Light Industry 3, ,515,989 11,515,989 Total 3, ,515,989 11,515, Trip Type Information Land Use H-W or C-W H-S or C-C H-O or C-NW H-W or C- W Miles Trip % Trip Purpose % H-S or C-C H-O or C-NW Primary Diverted Pass-by General Light Industry LDA LDT1 LDT2 MDV LHD1 LHD2 MHD HHD OBUS UBUS MCY SBUS MH Energy Detail 4.4 Fleet Mix Historical Energy Use: N 5.1 Mitigation Measures Energy
217 CalEEMod Version: CalEEMod Page 24 of 31 Date: 4/11/2014 3:27 PM ROG NOx CO SO2 Fugitive Total Fugitive Total Bio- CO2 NBio- CO2 Total CO2 CH4 N2O CO2e Category tons/yr MT/yr Electricity Mitigated Electricity Unmitigated , , , , , , NaturalGas Mitigated e e e NaturalGas Unmitigated e e e Energy by Land Use - NaturalGas Unmitigated NaturalGa s Use ROG NOx CO SO2 Fugitive Total Fugitive Total Bio- CO2 NBio- CO2 Total CO2 CH4 N2O CO2e Land Use kbtu/yr tons/yr MT/yr General Light Industry e e e e Total e e e
218 CalEEMod Version: CalEEMod Page 25 of 31 Date: 4/11/2014 3:27 PM 5.2 Energy by Land Use - NaturalGas Mitigated NaturalGa s Use ROG NOx CO SO2 Fugitive Total Fugitive Total Bio- CO2 NBio- CO2 Total CO2 CH4 N2O CO2e Land Use kbtu/yr tons/yr MT/yr General Light Industry e e e e Total e e e Energy by Land Use - Electricity Unmitigated Electricity Use Total CO2 CH4 N2O CO2e Land Use kwh/yr MT/yr General Light Industry e , , Total 1, ,
219 CalEEMod Version: CalEEMod Page 26 of 31 Date: 4/11/2014 3:27 PM 5.3 Energy by Land Use - Electricity Mitigated Electricity Use Total CO2 CH4 N2O CO2e Land Use kwh/yr MT/yr General Light Industry e , , Total 1, , Area Detail 6.1 Mitigation Measures Area No Hearths Installed ROG NOx CO SO2 Fugitive Total Fugitive Total Bio- CO2 NBio- CO2 Total CO2 CH4 N2O CO2e Category tons/yr MT/yr Mitigated e e e e e e e Unmitigated e e e e e e e
220 CalEEMod Version: CalEEMod Page 27 of 31 Date: 4/11/2014 3:27 PM 6.2 Area by SubCategory Unmitigated ROG NOx CO SO2 Fugitive Total Fugitive Total Bio- CO2 NBio- CO2 Total CO2 CH4 N2O CO2e SubCategory tons/yr MT/yr Architectural Coating Consumer Products Landscaping e e e e e e e e Total e e e e e e e Mitigated ROG NOx CO SO2 Fugitive Total Fugitive Total Bio- CO2 NBio- CO2 Total CO2 CH4 N2O CO2e SubCategory tons/yr MT/yr Architectural Coating Consumer Products Landscaping e e e e e e e e Total e e e e e e e Water Detail
221 CalEEMod Version: CalEEMod Page 28 of 31 Date: 4/11/2014 3:27 PM 7.1 Mitigation Measures Water Total CO2 CH4 N2O CO2e Category MT/yr Mitigated Unmitigated Water by Land Use Unmitigated Indoor/Out door Use Total CO2 CH4 N2O CO2e Land Use Mgal MT/yr General Light Industry / Total
222 CalEEMod Version: CalEEMod Page 29 of 31 Date: 4/11/2014 3:27 PM 7.2 Water by Land Use Mitigated Indoor/Out door Use Total CO2 CH4 N2O CO2e Land Use Mgal MT/yr General Light Industry / Total Waste Detail 8.1 Mitigation Measures Waste Category/Year Total CO2 CH4 N2O CO2e MT/yr Mitigated Unmitigated
223 CalEEMod Version: CalEEMod Page 30 of 31 Date: 4/11/2014 3:27 PM 8.2 Waste by Land Use Unmitigated Waste Disposed Total CO2 CH4 N2O CO2e Land Use tons MT/yr General Light Industry Total Mitigated Waste Disposed Total CO2 CH4 N2O CO2e Land Use tons MT/yr General Light Industry Total Operational Offroad Equipment Type Number Hours/Day Days/Year Horse Power Load Factor Fuel Type
224 CalEEMod Version: CalEEMod Page 31 of 31 Date: 4/11/2014 3:27 PM 10.0 Vegetation Total CO2 CH4 N2O CO2e Category MT Unmitigated Net New Trees Species Class Number of Trees Total CO2 CH4 N2O CO2e MT Miscellaneous Total
225 CalEEMod Version: CalEEMod Page 1 of 26 Date: 4/11/2014 3:24 PM 1.0 Project Characteristics 1.1 Land Usage Pacific Pointe South Coast Air Basin, Summer Land Uses Size Metric Lot Acreage Floor Surface Area Population General Light Industry sqft , Other Project Characteristics Urbanization Urban Wind Speed (m/s) 2.2 Precipitation Freq (Days) 31 Climate Zone 11 Operational Year 2016 Utility Company Southern California Edison CO2 Intensity (lb/mwhr) CH4 Intensity (lb/mwhr) N2O Intensity (lb/mwhr) User Entered Comments & Non-Default Data Project Characteristics - Land Use - Changed lot acreage to reflect project site Construction Phase - Adjusted construction schedule per applicant Trips and VMT - Adjusted trips per applicant schedule Demolition - Land Use Change - Sequestration - Mobile Land Use Mitigation - Area Mitigation - Architectural Coating - Corrected square footage
226 CalEEMod Version: CalEEMod Page 2 of 26 Date: 4/11/2014 3:24 PM Table Name Column Name Default Value New Value tblarchitecturalcoating ConstArea_Nonresidential_Interior 741, , tblarchitecturalcoating EF_Nonresidential_Exterior tblarchitecturalcoating EF_Nonresidential_Interior tblconstructionphase NumDays tblconstructionphase PhaseEndDate 12/29/ /29/2016 tbllanduse LotAcreage tblprojectcharacteristics OperationalYear tblsequestration NumberOfNewTrees Emissions Summary
227 CalEEMod Version: CalEEMod Page 3 of 26 Date: 4/11/2014 3:24 PM 2.1 Overall Construction (Maximum Daily Emission) Unmitigated Construction ROG NOx CO SO2 Fugitive Total Fugitive Total Bio- CO2 NBio- CO2 Total CO2 CH4 N2O CO2e Year lb/day lb/day , , , , , , Total , , , Mitigated Construction ROG NOx CO SO2 Fugitive Total Fugitive Total Bio- CO2 NBio- CO2 Total CO2 CH4 N2O CO2e Year lb/day lb/day , , , , , , Total , , , ROG NOx CO SO2 Fugitive Total Fugitive Total Bio- CO2 NBio-CO2 Total CO2 CH4 N20 CO2e Percent Reduction
228 CalEEMod Version: CalEEMod Page 4 of 26 Date: 4/11/2014 3:24 PM 2.2 Overall Operational Unmitigated Operational ROG NOx CO SO2 Fugitive Total Fugitive Total Bio- CO2 NBio- CO2 Total CO2 CH4 N2O CO2e Category lb/day lb/day Area e e e e e e Energy , , , Mobile , Total , , , , , Mitigated Operational ROG NOx CO SO2 Fugitive Total Fugitive Total Bio- CO2 NBio- CO2 Total CO2 CH4 N2O CO2e Category lb/day lb/day Area e e e e e e Energy , , , Mobile , Total , , , , ,
229 CalEEMod Version: CalEEMod Page 5 of 26 Date: 4/11/2014 3:24 PM ROG NOx CO SO2 Fugitive Total Fugitive Total Bio- CO2 NBio-CO2 Total CO2 CH4 N20 CO2e Percent Reduction Construction Detail Construction Phase Phase Number Phase Name Phase Type Start Date End Date Num Days Week Num Days Phase Description 1 Demolition Demolition 1/1/2015 1/28/ Site Preparation Site Preparation 1/29/2015 2/11/ Grading Grading 2/12/2015 4/1/ Building Construction Building Construction 4/2/2015 8/31/ Paving Paving 9/1/2016 9/28/ Architectural Coating Architectural Coating 9/29/ /29/ Acres of Grading (Site Preparation Phase): 0 Acres of Grading (Grading Phase): 87.5 Acres of Paving: 0 Residential Indoor: 0; Residential Outdoor: 0; Non-Residential Indoor: 494,000; Non-Residential Outdoor: 247,000 (Architectural Coating sqft) OffRoad Equipment
230 CalEEMod Version: CalEEMod Page 6 of 26 Date: 4/11/2014 3:24 PM Phase Name Offroad Equipment Type Amount Usage Hours Horse Power Load Factor Demolition Concrete/Industrial Saws Demolition Excavators Demolition Rubber Tired Dozers Site Preparation Rubber Tired Dozers Site Preparation Tractors/Loaders/Backhoes Grading Excavators Grading Graders Grading Rubber Tired Dozers Grading Scrapers Grading Tractors/Loaders/Backhoes Building Construction Cranes Building Construction Forklifts Building Construction Generator Sets Building Construction Tractors/Loaders/Backhoes Building Construction Welders Paving Pavers Paving Paving Equipment Paving Rollers Architectural Coating Air Compressors Trips and VMT
231 CalEEMod Version: CalEEMod Page 7 of 26 Date: 4/11/2014 3:24 PM Phase Name Offroad Equipment Count Worker Trip Number Vendor Trip Number Hauling Trip Number Worker Trip Length Vendor Trip Length Hauling Trip Length Worker Vehicle Class Vendor Vehicle Class Hauling Vehicle Class Demolition LD_Mix HDT_Mix HHDT Site Preparation LD_Mix HDT_Mix HHDT Grading LD_Mix HDT_Mix HHDT Building Construction LD_Mix HDT_Mix HHDT Paving LD_Mix HDT_Mix HHDT Architectural Coating LD_Mix HDT_Mix HHDT 3.1 Mitigation Measures Construction 3.2 Demolition Unmitigated Construction On-Site ROG NOx CO SO2 Fugitive Total Fugitive Total Bio- CO2 NBio- CO2 Total CO2 CH4 N2O CO2e Category lb/day lb/day Fugitive Dust Off-Road , , , Total , , ,
232 CalEEMod Version: CalEEMod Page 8 of 26 Date: 4/11/2014 3:24 PM 3.2 Demolition Unmitigated Construction Off-Site ROG NOx CO SO2 Fugitive Total Fugitive Total Bio- CO2 NBio- CO2 Total CO2 CH4 N2O CO2e Category lb/day lb/day Hauling Vendor Worker e e e e Total e e e e Mitigated Construction On-Site ROG NOx CO SO2 Fugitive Total Fugitive Total Bio- CO2 NBio- CO2 Total CO2 CH4 N2O CO2e Category lb/day lb/day Fugitive Dust Off-Road , , , Total , , ,
233 CalEEMod Version: CalEEMod Page 9 of 26 Date: 4/11/2014 3:24 PM 3.2 Demolition Mitigated Construction Off-Site ROG NOx CO SO2 Fugitive Total Fugitive Total Bio- CO2 NBio- CO2 Total CO2 CH4 N2O CO2e Category lb/day lb/day Hauling Vendor Worker e e e e Total e e e e Site Preparation Unmitigated Construction On-Site ROG NOx CO SO2 Fugitive Total Fugitive Total Bio- CO2 NBio- CO2 Total CO2 CH4 N2O CO2e Category lb/day lb/day Fugitive Dust Off-Road , , , Total , , ,
234 CalEEMod Version: CalEEMod Page 10 of 26 Date: 4/11/2014 3:24 PM 3.3 Site Preparation Unmitigated Construction Off-Site ROG NOx CO SO2 Fugitive Total Fugitive Total Bio- CO2 NBio- CO2 Total CO2 CH4 N2O CO2e Category lb/day lb/day Hauling Vendor Worker e e e Total e e e Mitigated Construction On-Site ROG NOx CO SO2 Fugitive Total Fugitive Total Bio- CO2 NBio- CO2 Total CO2 CH4 N2O CO2e Category lb/day lb/day Fugitive Dust Off-Road , , , Total , , ,
235 CalEEMod Version: CalEEMod Page 11 of 26 Date: 4/11/2014 3:24 PM 3.3 Site Preparation Mitigated Construction Off-Site ROG NOx CO SO2 Fugitive Total Fugitive Total Bio- CO2 NBio- CO2 Total CO2 CH4 N2O CO2e Category lb/day lb/day Hauling Vendor Worker e e e Total e e e Grading Unmitigated Construction On-Site ROG NOx CO SO2 Fugitive Total Fugitive Total Bio- CO2 NBio- CO2 Total CO2 CH4 N2O CO2e Category lb/day lb/day Fugitive Dust Off-Road , , , Total , , ,
236 CalEEMod Version: CalEEMod Page 12 of 26 Date: 4/11/2014 3:24 PM 3.4 Grading Unmitigated Construction Off-Site ROG NOx CO SO2 Fugitive Total Fugitive Total Bio- CO2 NBio- CO2 Total CO2 CH4 N2O CO2e Category lb/day lb/day Hauling Vendor Worker e e e Total e e e Mitigated Construction On-Site ROG NOx CO SO2 Fugitive Total Fugitive Total Bio- CO2 NBio- CO2 Total CO2 CH4 N2O CO2e Category lb/day lb/day Fugitive Dust Off-Road , , , Total , , ,
237 CalEEMod Version: CalEEMod Page 13 of 26 Date: 4/11/2014 3:24 PM 3.4 Grading Mitigated Construction Off-Site ROG NOx CO SO2 Fugitive Total Fugitive Total Bio- CO2 NBio- CO2 Total CO2 CH4 N2O CO2e Category lb/day lb/day Hauling Vendor Worker e e e Total e e e Building Construction Unmitigated Construction On-Site ROG NOx CO SO2 Fugitive Total Fugitive Total Bio- CO2 NBio- CO2 Total CO2 CH4 N2O CO2e Category lb/day lb/day Off-Road , , , Total , , ,
238 CalEEMod Version: CalEEMod Page 14 of 26 Date: 4/11/2014 3:24 PM 3.5 Building Construction Unmitigated Construction Off-Site ROG NOx CO SO2 Fugitive Total Fugitive Total Bio- CO2 NBio- CO2 Total CO2 CH4 N2O CO2e Category lb/day lb/day Hauling Vendor , , , Worker , , , Total , , , Mitigated Construction On-Site ROG NOx CO SO2 Fugitive Total Fugitive Total Bio- CO2 NBio- CO2 Total CO2 CH4 N2O CO2e Category lb/day lb/day Off-Road , , , Total , , ,
239 CalEEMod Version: CalEEMod Page 15 of 26 Date: 4/11/2014 3:24 PM 3.5 Building Construction Mitigated Construction Off-Site ROG NOx CO SO2 Fugitive Total Fugitive Total Bio- CO2 NBio- CO2 Total CO2 CH4 N2O CO2e Category lb/day lb/day Hauling Vendor , , , Worker , , , Total , , , Building Construction Unmitigated Construction On-Site ROG NOx CO SO2 Fugitive Total Fugitive Total Bio- CO2 NBio- CO2 Total CO2 CH4 N2O CO2e Category lb/day lb/day Off-Road , , , Total , , ,
240 CalEEMod Version: CalEEMod Page 16 of 26 Date: 4/11/2014 3:24 PM 3.5 Building Construction Unmitigated Construction Off-Site ROG NOx CO SO2 Fugitive Total Fugitive Total Bio- CO2 NBio- CO2 Total CO2 CH4 N2O CO2e Category lb/day lb/day Hauling Vendor , , , Worker , , , Total , , , Mitigated Construction On-Site ROG NOx CO SO2 Fugitive Total Fugitive Total Bio- CO2 NBio- CO2 Total CO2 CH4 N2O CO2e Category lb/day lb/day Off-Road , , , Total , , ,
241 CalEEMod Version: CalEEMod Page 17 of 26 Date: 4/11/2014 3:24 PM 3.5 Building Construction Mitigated Construction Off-Site ROG NOx CO SO2 Fugitive Total Fugitive Total Bio- CO2 NBio- CO2 Total CO2 CH4 N2O CO2e Category lb/day lb/day Hauling Vendor , , , Worker , , , Total , , , Paving Unmitigated Construction On-Site ROG NOx CO SO2 Fugitive Total Fugitive Total Bio- CO2 NBio- CO2 Total CO2 CH4 N2O CO2e Category lb/day lb/day Off-Road , , , Paving Total , , ,
242 CalEEMod Version: CalEEMod Page 18 of 26 Date: 4/11/2014 3:24 PM 3.6 Paving Unmitigated Construction Off-Site ROG NOx CO SO2 Fugitive Total Fugitive Total Bio- CO2 NBio- CO2 Total CO2 CH4 N2O CO2e Category lb/day lb/day Hauling Vendor Worker e e e e Total e e e e Mitigated Construction On-Site ROG NOx CO SO2 Fugitive Total Fugitive Total Bio- CO2 NBio- CO2 Total CO2 CH4 N2O CO2e Category lb/day lb/day Off-Road , , , Paving Total , , ,
243 CalEEMod Version: CalEEMod Page 19 of 26 Date: 4/11/2014 3:24 PM 3.6 Paving Mitigated Construction Off-Site ROG NOx CO SO2 Fugitive Total Fugitive Total Bio- CO2 NBio- CO2 Total CO2 CH4 N2O CO2e Category lb/day lb/day Hauling Vendor Worker e e e e Total e e e e Architectural Coating Unmitigated Construction On-Site ROG NOx CO SO2 Fugitive Total Fugitive Total Bio- CO2 NBio- CO2 Total CO2 CH4 N2O CO2e Category lb/day lb/day Archit. Coating Off-Road e- Total e
244 CalEEMod Version: CalEEMod Page 20 of 26 Date: 4/11/2014 3:24 PM 3.7 Architectural Coating Unmitigated Construction Off-Site ROG NOx CO SO2 Fugitive Total Fugitive Total Bio- CO2 NBio- CO2 Total CO2 CH4 N2O CO2e Category lb/day lb/day Hauling Vendor Worker e e e Total e e e Mitigated Construction On-Site ROG NOx CO SO2 Fugitive Total Fugitive Total Bio- CO2 NBio- CO2 Total CO2 CH4 N2O CO2e Category lb/day lb/day Archit. Coating Off-Road e- Total e
245 CalEEMod Version: CalEEMod Page 21 of 26 Date: 4/11/2014 3:24 PM 3.7 Architectural Coating Mitigated Construction Off-Site ROG NOx CO SO2 Fugitive Total Fugitive Total Bio- CO2 NBio- CO2 Total CO2 CH4 N2O CO2e Category lb/day lb/day Hauling Vendor Worker e e e Total e e e Operational Detail - Mobile 4.1 Mitigation Measures Mobile ROG NOx CO SO2 Fugitive Total Fugitive Total Bio- CO2 NBio- CO2 Total CO2 CH4 N2O CO2e Category lb/day lb/day Mitigated , Unmitigated , , , , ,
246 CalEEMod Version: CalEEMod Page 22 of 26 Date: 4/11/2014 3:24 PM 4.2 Trip Summary Information Average Daily Trip Rate Unmitigated Mitigated Land Use Weekday Saturday Sunday Annual VMT Annual VMT General Light Industry 3, ,515,989 11,515,989 Total 3, ,515,989 11,515, Trip Type Information Land Use H-W or C-W H-S or C-C H-O or C-NW H-W or C- W Miles Trip % Trip Purpose % H-S or C-C H-O or C-NW Primary Diverted Pass-by General Light Industry LDA LDT1 LDT2 MDV LHD1 LHD2 MHD HHD OBUS UBUS MCY SBUS MH Energy Detail 4.4 Fleet Mix Historical Energy Use: N 5.1 Mitigation Measures Energy
247 CalEEMod Version: CalEEMod Page 23 of 26 Date: 4/11/2014 3:24 PM ROG NOx CO SO2 Fugitive Total Fugitive Total Bio- CO2 NBio- CO2 Total CO2 CH4 N2O CO2e Category lb/day lb/day NaturalGas Mitigated NaturalGas Unmitigated , , , , , , Energy by Land Use - NaturalGas Unmitigated NaturalGa s Use ROG NOx CO SO2 Fugitive Total Fugitive Total Bio- CO2 NBio- CO2 Total CO2 CH4 N2O CO2e Land Use kbtu/yr lb/day lb/day General Light Industry , , , Total , , ,
248 CalEEMod Version: CalEEMod Page 24 of 26 Date: 4/11/2014 3:24 PM 5.2 Energy by Land Use - NaturalGas Mitigated NaturalGa s Use ROG NOx CO SO2 Fugitive Total Fugitive Total Bio- CO2 NBio- CO2 Total CO2 CH4 N2O CO2e Land Use kbtu/yr lb/day lb/day General Light Industry , , , Total , , , Area Detail 6.1 Mitigation Measures Area No Hearths Installed ROG NOx CO SO2 Fugitive Total Fugitive Total Bio- CO2 NBio- CO2 Total CO2 CH4 N2O CO2e Category lb/day lb/day Mitigated e e e e e e Unmitigated e e e e e e
249 CalEEMod Version: CalEEMod Page 25 of 26 Date: 4/11/2014 3:24 PM 6.2 Area by SubCategory Unmitigated ROG NOx CO SO2 Fugitive Total Fugitive Total Bio- CO2 NBio- CO2 Total CO2 CH4 N2O CO2e SubCategory lb/day lb/day Architectural Coating Consumer Products Landscaping e e e e e e e Total e e e e e e Mitigated ROG NOx CO SO2 Fugitive Total Fugitive Total Bio- CO2 NBio- CO2 Total CO2 CH4 N2O CO2e SubCategory lb/day lb/day Architectural Coating Consumer Products Landscaping e e e e e e e Total e e e e e e Water Detail
250 CalEEMod Version: CalEEMod Page 26 of 26 Date: 4/11/2014 3:24 PM 7.1 Mitigation Measures Water 8.0 Waste Detail 8.1 Mitigation Measures Waste 9.0 Operational Offroad Equipment Type Number Hours/Day Days/Year Horse Power Load Factor Fuel Type 10.0 Vegetation


251 Appendix C Traffic Study
252 TRAFFIC IMPACT ANALYSIS PACIFIC POINTE EAST Long Beach, California March 13, 2014

253 TRAFFIC IMPACT ANALYSIS PACIFIC POINTE EAST Long Beach, California March 13, 2014 Prepared for: RINCON CONSULTANTS, INC. 180 North Ashwood Avenue Ventura, CA 93 and THE CITY OF LONG BEACH Department of Development Services 333 West Ocean Boulevard Long Beach, California LLG Ref Prepared by: Garrett Milovich Transportation Engineer I and Daniel A. Kloos, P.E. Senior Transportation Engineers Under the Supervision of: Richard E. Barretto, P.E. Principal
254 TABLE OF CONTENTS SECTION PAGE 1.0 Introduction Scope of Work Study Area Project Description Site Access Existing Conditions Street Network Existing Public Transit Existing Area Traffic Volumes Existing Intersection Conditions Intersection Capacity Utilization (ICU) Method of Analysis (Signalized Intersections) Highway Capacity Manual (HCM) Method of Analysis (Unsignalized Intersections) Level of Service Criteria Existing Level of Service Results Conant Street at Faculty Avenue Traffic Signal Warrant Analysis California MUTCD Policy/Criteria Existing Traffic Volumes Traffic Signal Warrant Evaluation Traffic Forecasting Methodology Project Traffic Characteristics Project Traffic Generation Project Traffic Distribution and Assignment Existing Plus Project Traffic Conditions Future Traffic Conditions Ambient Traffic Growth Related Projects Traffic Characteristics Year 2016 Traffic Volumes Traffic Impact Analysis Methodology Impact Criteria and Thresholds Traffic Impact Analysis Scenarios LINSCOTT, LAW & GREENSPAN, engineers LLG Ref i Pacific Pointe East, Long Beach N:\3400\ Pacific Pointe, Long Beach\Report\3437 Pacific Pointe East TIA doc
255 TABLE OF CONTENTS SECTION PAGE 8.0 Peak Hour Intersection Capacity Analysis Existing Plus Project Traffic Conditions Existing Traffic Conditions Existing Plus Project Traffic Conditions Year 2016 Traffic Conditions Year 2016 Cumulative Traffic Conditions Year 2016 Cumulative Plus Project Traffic Conditions Site Access And Internal Circulation Evaluation Site Access Internal Circulation Traffic Signal Warrant Analysis Traffic Signal Warrant Results Recommend Improvements Existing Plus Project Traffic Conditions Year 2016 Plus Project Traffic Conditions Project-Specific Improvements Congestion Management Program Compliance Assessment Traffic Impact Review Intersections Freeways Transit Impact Review Construction Traffic Impact Assessment Construction Traffic Trip Generation Construction Traffic Assessment Construction Management Plan Criteria Summary Of Findings And Conclusions APPENDIX A. Existing Traffic Count Data APPENDICES B. Intersection Level of Service Calculation Worksheets C. Project Driveway Level of Service Calculation Worksheets D. Traffic Signal Warrant Analysis Worksheets LINSCOTT, LAW & GREENSPAN, engineers LLG Ref ii Pacific Pointe East, Long Beach N:\3400\ Pacific Pointe, Long Beach\Report\3437 Pacific Pointe East TIA doc
256 LIST OF FIGURES SECTION FIGURE # FOLLOWING PAGE 1-1 Vicinity Map Existing Site Proposed Site Plan Existing Roadway Conditions and Intersection Controls Existing AM Peak Hour Traffic Volumes Existing PM Peak Hour and Daily Traffic Volumes Project Trip Distribution Pattern (Passenger Cars) Project Trip Distribution Pattern (Trucks) AM Peak Hour Project Traffic Volumes PM Peak Hour and Daily Project Traffic Volumes Existing Plus Project AM Peak Hour Traffic Volumes Existing Plus Project PM Peak Hour and Daily Traffic Volumes Related Projects Location Map AM Peak Hour Related Projects Traffic Volumes PM Peak Hour and Daily Related Projects Traffic Volumes Year 2016 Cumulative AM Peak Hour Traffic Volumes Year 2016 Cumulative PM Peak Hour and Daily Traffic Volumes Year 2016 Cumulative Plus Project AM Peak Hour Traffic Volumes Year 2016 Cumulative Plus Project PM Peak Hour and Daily Traffic Volumes LINSCOTT, LAW & GREENSPAN, engineers LLG Ref iii Pacific Pointe East, Long Beach N:\3400\ Pacific Pointe, Long Beach\Report\3437 Pacific Pointe East TIA doc
257 LIST OF TABLES SECTION TABLE # PAGE 2 1 Project Development Summary Clearance Intervals Level of Service Criteria for Signalized Intersections (ICU Methodology) Level of Service Criteria for Unsignalized Intersections Existing Peak Hour Levels of Service Existing Daily Traffic Volumes for Conant Street at Faculty Avenue Existing Traffic Signal Warrant Analysis Summary for Conant Street at Faculty Avenue Project Traffic Generation Forecast Location and Description of Related Projects Related Projects Traffic Generation Forecast Existing Plus Project Peak Hour Intersection Capacity Analysis Year 2016 Cumulative Plus Project Peak Hour Intersection Capacity Analysis Project Driveway Peak Hour Intersection Capacity Analysis Traffic Signal Warrant Analysis Summary Project Construction-Related Traffic Generation LINSCOTT, LAW & GREENSPAN, engineers LLG Ref iv Pacific Pointe East, Long Beach N:\3400\ Pacific Pointe, Long Beach\Report\3437 Pacific Pointe East TIA doc
258 TRAFFIC IMPACT ANALYSIS PACIFIC POINTE EAST Long Beach, California March 13, INTRODUCTION This Traffic Impact Analysis report addresses the potential traffic impacts and circulation needs associated with the development of the Pacific Pointe East Project (hereinafter referred to as Project). The Project site is generally located south of Conant Street, east of Lakewood Boulevard, and north of the Skylinks Golf Course in the, California. The Project site is located in Douglas Aircraft Planned Development District (PD-19), which allows new development intensity to equal no more than 5,503 vehicle trips to and from the site in the weekday peak period between 4:00 PM and 6:00 PM. This report documents the findings and recommendations of a traffic impact analysis, conducted by Linscott, Law & Greenspan, Engineers (LLG) to determine the potential impacts associated with the proposed Project. 1.1 Scope of Work The traffic analysis evaluates the existing operating conditions at six (6) key intersections within the project vicinity, estimates the trip generation potential of the proposed Project, and forecasts future operating conditions without and with the Project. Where necessary, intersection improvements/mitigation measures are identified to offset the impact of the proposed Project. This traffic report satisfies the traffic impact requirements of the and is consistent with the requirements and procedures outlined in the most current Congestion Management Program (CMP) for Los Angeles County. The Scope of Work for this report has been developed in coordination with Traffic Engineering staff. The Project site has been visited and an inventory of adjacent area roadways and intersections was performed. Existing peak hour traffic information has been collected at the six (6) key study locations on a typical weekday for use in the preparation of intersection level of service calculations. Information concerning related projects (planned and/or approved) in the vicinity of the project has been researched at the and the City of Lakewood. Based on our research, seven (7) related projects were considered in the cumulative traffic analysis for this project. Based on requirement s, this traffic report analyzes existing and future (nearterm) weekday AM and PM peak hour traffic conditions for eexisting and Year 2016 traffic conditions without and with the proposed Project. Peak hour traffic forecasts for the Year 2016 horizon year have been projected by increasing existing traffic volumes by an annual growth rate of two percent (2%) per year and adding traffic volumes generated by seven (7) related projects. LINSCOTT, LAW & GREENSPAN, engineers LLG Ref Pacific Pointe East, Long Beach N:\3400\ Pacific Pointe, Long Beach\Report\3437 Pacific Pointe East TIA doc
259 1.2 Study Area The key area intersections evaluated in this report provide both regional and local access to the study area. The study intersections were selected in coordination with the Traffic Engineer and consist of the following: 1. Lakewood Boulevard at Carson Street 1 2. Lakewood Boulevard at Conant Street 3. Lakewood Boulevard at Donald Douglas Drive/Wardlow Road 4. Faculty Avenue at Conant Street 5. Clark Avenue at Carson Street 6. Clark Avenue at Conant Street Figure 1-1 presents a Vicinity Map, which illustrates the general location of the project and depicts the study locations and surrounding street system. Level of Service (LOS) calculations for the AM and PM peak hours at these key study intersections were performed to evaluate the future potential traffic impacts associated with anticipated area growth, related projects, and the proposed Project. Included in this traffic study report are: Existing traffic counts, Estimated project traffic generation/distribution/assignment, Estimated cumulative project traffic generation/distribution/assignment, AM and PM peak hour capacity analyses for existing conditions, AM and PM peak hour capacity analyses for existing plus project conditions, AM and PM peak hour capacity analyses for future (Year 2016) conditions without and with project traffic, Site Access and Internal Circulation Evaluation, Traffic Signal Warrant Analysis Recommended Improvements, Congestion Management Program Compliance Assessment, and Construction Traffic Impact Assessment. 1 Los Angeles County CMP intersection. LINSCOTT, LAW & GREENSPAN, engineers LLG Ref Pacific Pointe East, Long Beach N:\3400\ Pacific Pointe, Long Beach\Report\3437 Pacific Pointe East TIA doc


260
261 2.0 PROJECT DESCRIPTION The Project site is a acre rectangular-shaped parcel of land, now developed with surface parking spaces, that is generally located south of Conant Street, east of Lakewood Boulevard, and north of the Skylinks Golf Course. The Project site is located in Douglas Aircraft Planned Development District (PD-19). Located directly north of the Project site, across Conant Street, west of Faculty Avenue and east of Lakewood Boulevard is the former Boeing C-717 site that is developed with 1,064,615 square-feet (SF) of building area 2. Similar to the Project, the former Boeing C-717 site is located within PD-19. East of Faculty Avenue and north of Conant Street is the Long Beach City College campus. Bordering the Project site to the east, on the southeast corner of Conant Street and Clark Avenue, is Rosie the Riveter Park and Interpretive Center. Figure 2-1 presents an existing aerial of the Project site. Figure 2-2 presents the site plan for the proposed Project. As shown, the proposed Pacific Pointe East development will consist of three new industrial buildings. These buildings would be speculative developments with an open floor, intended for light industrial, light manufacturing, warehouse, office, and/or research & development land uses. Based on information provided by Rincon Consultants, Inc., the three buildings would have a total area of 494,000 square feet (SF) and provide 722 parking spaces broken down as follows: Building 9 144,000 SF with 221 parking spaces Building ,000 SF with 156 parking spaces Building ,000 SF with 345 parking spaces Given that the potential tenant mix has not been determined at this time, Buildings 9 and 10 have been assumed to be manufacturing type uses, whereas Building 11 is assumed to be occupied by warehouse/storage uses. Table 2-1 presents the development summary for the proposed uses of the Project. The Project is expected to be completed by the Year 2016 and is assumed to be completed in one phase. 2.1 Site Access Access to the Project will be provided via four driveways to be located along Conant Street. Driveways 1, 3, and 4 will provide full access to the site, whereas Driveway 2, due to its proximity to the Conant Street/Faculty Avenue intersections, will provide right-turn in/right-turn out only access to the site. 2 The former Boeing C-717 site will be renovated to accommodate the Mercedes-Benz West Coast Campus. The Mercedes Benz West Coast Campus will include a Vehicle Preparation Center, Learning and Performance Center, Regional Offices, and a Classic Car Center (Source: City of Long Beach/Sares-Regis Group). LINSCOTT, LAW & GREENSPAN, engineers LLG Ref Pacific Pointe East, Long Beach N:\3400\ Pacific Pointe, Long Beach\Report\3437 Pacific Pointe East TIA doc

262


263
264 Land Use / Project Description Manufacturing/Industrial Building Floor Area Allocation TABLE 2-1 PROJECT DEVELOPMENT SUMMARY 3 Building 9 Floor Area (SF-GFA) Building 10 Floor Area (SF-GFA) Building 11 Floor Area (SF-GFA) Total Project Floor Area (SF-GFA) Office 15,000 SF 15,000 SF 20,000 SF 50,000 SF Manufacturing 129,000 SF 103,000 SF ,000 SF Warehousing ,000 SF 212,000 SF Total Building Floor Area 144,000 SF 118,000 SF 232,000 SF 494,000 SF Vehicular Parking Supply Standard 193 spaces 152 spaces 300 spaces 645 spaces Van Accessible 2 spaces 2 spaces 4 spaces 8 spaces Standard Accessible 5 spaces 2 spaces 6 spaces 13 spaces Van Pool 11 spaces 0 spaces 20 spaces 31 spaces Car Pool 10 spaces 0 spaces 15 spaces 25 spaces Total Vehicular Parking Supply 221 spaces 156 spaces 345 spaces 722 spaces Notes: SF-GFA = square feet of gross floor area 3 Source: Rincon Consultants, Inc. LINSCOTT, LAW & GREENSPAN, engineers LLG Ref Pacific Pointe East, Long Beach N:\3400\ Pacific Pointe, Long Beach\Report\3437 Pacific Pointe East TIA doc
265 3.0 EXISTING CONDITIONS 3.1 Street Network Regional access to the project site is provided by the I-405 Freeway located south of the project. Other key roadways in the local area network include Lakewood Boulevard, Faculty Avenue, Clark Avenue, Carson Street, Conant Street, and Wardlow Road. The following discussion provides a brief synopsis of these key area streets. The descriptions are based on an inventory of existing roadway conditions. Lakewood Boulevard is primarily an eight-lane, divided roadway that borders the Project site on the west. Lakewood Boulevard is oriented in the north-south direction. North of Conant Street, Lakewood Boulevard is a six-lane, divided roadway. The posted speed limit along Lakewood Boulevard is 45 miles per hour (mph). Parking is not permitted on either side of the roadway within the vicinity of the Project. The key study intersections of Lakewood Boulevard at Carson Street, Conant Street and Donald Douglas Drive/Wardlow Road are controlled by traffic signals. Faculty Avenue is a two-lane, undivided roadway oriented in the north-south direction. The posted speed limit along Faculty Avenue is 30 mph. Parking is not permitted on either side of the roadway within the vicinity of the Project, but angled parking is available along a cul-de-sac located at the northern end of Faculty Avenue. The key study intersection of Faculty Avenue at Conant Street is controlled by an all-way stop. Clark Avenue is primarily a four-lane, divided roadway located east of the Project site. Clark Avenue is oriented in the north-south direction. South of Conant Street, Clark Avenue is a five-lane, divided roadway, with three lanes in the southbound direction and two lanes in the northbound direction. The posted speed limit along Clark Avenue is 40 mph. North of Conant Street, parking is permitted on the east side and restricted on the west side. South of Conant Street, parking is not permitted on either side of the roadway. The key study intersections of Clark Avenue at Carson Street and Conant Street are controlled by traffic signals. Carson Street is primarily a five-lane, divided roadway located north of the Project site. Carson Street is oriented in the east-west direction, with three lanes in the westbound direction and two lanes in the eastbound direction. West of Lakewood Boulevard and east of Clark Avenue, Carson Street is a six-lane, divided roadway. The posted speed limit along Carson Street is 40 mph. Parking is permitted on both sides of the roadway within the vicinity of the Project. Conant Street is a four-lane, divided roadway that borders the Project site on the north. Conant Street is oriented in the east-west direction. West of Faculty Avenue, parking is not permitted on either side of the roadway. East of Faculty Avenue, parking is permitted on the south side and restricted on the north side. LINSCOTT, LAW & GREENSPAN, engineers LLG Ref Pacific Pointe East, Long Beach N:\3400\ Pacific Pointe, Long Beach\Report\3437 Pacific Pointe East TIA doc
266 Wardlow Road is a four-lane, divided roadway located south of the Project site. Wardlow Road is oriented in the east-west direction. The posted speed limit along Wardlow Road is 35 mph. Parking is permitted on both sides of the roadway within the vicinity of the Project. Figure 3-1 presents an inventory of the existing roadway conditions for the arterials and intersections evaluated in this report. The number of travel lanes and intersection controls for the key area intersections are identified. 3.2 Existing Public Transit The Long Beach Transit (LBT) provides public transit services in the vicinity of the proposed Project. A brief description of the transit services is as follows: LBT Route 93: Route 93 extends from Alondra Boulevard and Woodruff Avenue to Fifth Street Station. Route 93 traverses the study area on Carson Street and Clark Avenue, and operates throughout the day, Monday through Friday. During the weekday AM peak hour, Route 93 provides headways of 3 buses in the eastbound direction and 2 buses in the westbound direction. During the weekday PM peak hour, Route 93 provides headways of 2 buses in the eastbound direction and 3 buses in the westbound direction. LBT Routes 101 and 103: The routes extend from Santa Fe Avenue and Willow Street to Norwalk Boulevard and Carson Street. The route traverses the study area on Carson Street, Lakewood Boulevard, and Clark Avenue, and operates throughout the day, Monday through Friday. During the weekday AM and PM peak hours, in the eastbound/westbound directions, Routes 101 and 103 provide headways of 2 buses in each direction. LBT Routes 111 and 112: The route extends from the Downtown Long Beach Station to Lakewood Regional Medical Center. These routes traverse the study area on Carson Street, Lakewood Boulevard, and Clark Avenue, and operate throughout the day, Monday through Sunday. During the weekday AM peak hour, Route 111 provides headways of 2 buses in both the northbound and southbound directions. During the weekday PM peak hour, Route 111 provides headways of 2 buses in the northbound direction and 1 bus in the southbound direction. During the weekday AM peak hour, Route 112 provides a headway of 2 buses in the southbound direction. During the weekday PM peak hour, Route 112 provides a headway of 1 bus in the southbound direction. Route 112 does not provide any buses in the northbound direction during the AM or PM peak hours. LINSCOTT, LAW & GREENSPAN, engineers LLG Ref Pacific Pointe East, Long Beach N:\3400\ Pacific Pointe, Long Beach\Report\3437 Pacific Pointe East TIA doc
267 LBT Route 176: The route extends from the Lakewood Mall to San Gabriel and Pacific Coast Highway. The route traverses the study area on Carson Street and Lakewood Boulevard, and operates throughout the day, Monday through Friday. During the weekday AM and PM peak hours, in the northbound/southbound directions, Route 176 provides headways of 2 buses in each direction. 3.3 Existing Area Traffic Volumes Manual vehicular turning movement counts were conducted at the six (6) key study locations during the weekday morning and evening peak commuter periods to determine the existing AM peak hour and PM peak hour traffic volumes. Traffic counts at the six (6) key study intersections were conducted in February 2014 by Transportation Studies, Inc. Figures 3-2 and 3-3 depict the existing AM and PM peak hour traffic volumes at the six (6) key study intersections, respectively. Figure 3-3 also presents the existing average daily traffic volumes for the roadway segments in the vicinity of the proposed Project. Appendix A contains the detailed manual turning movement count sheets for the key study intersections evaluated in this report. 3.4 Existing Intersection Conditions Existing AM and PM peak hour operating conditions for the key study intersections were evaluated using the Intersection Capacity Utilization (ICU) Methodology for signalized intersections and the methodology outlined in Chapter 17 of the Highway Capacity Manual 2000 (HCM 2000) for unsignalized intersections Intersection Capacity Utilization (ICU) Method of Analysis (Signalized Intersections) In conformance with and LA County CMP requirements, existing AM and PM peak hour operating conditions for the key signalized study intersections were evaluated using the Intersection Capacity Utilization (ICU) method. The ICU technique is intended for signalized intersection analysis and estimates the volume to capacity (V/C) relationship for an intersection based on the individual V/C ratios for key conflicting traffic movements. The ICU numerical value represents the percent signal (green) time, and thus capacity, required by existing and/or future traffic. It should be noted that the ICU methodology assumes uniform traffic distribution per intersection approach lane and optimal signal timing. Per LA County CMP requirements, the ICU calculations use a lane capacity of 1,600 vehicles per hour (vph) for left-turn, through, and right-turn lanes, and dual left turn capacity of 2,880 vph. A clearance interval is also added to each Level of Service calculation. Per requirements, clearance intervals are based on the number of phases in the intersection and whether the left turning movements are all fully protected or whether some of them are permitted with other left-turn movements being protected. Table 3-1 shows the clearance intervals used in the analysis of the key study intersections. LINSCOTT, LAW & GREENSPAN, engineers LLG Ref Pacific Pointe East, Long Beach N:\3400\ Pacific Pointe, Long Beach\Report\3437 Pacific Pointe East TIA doc
268
269
270
271 TABLE 3-1 CITY OF LONG BEACH CLEARANCE INTERVALS 4 Number of Signal Phases Left-turn Phasing Type Clearance Interval (percent) 2 Permitted 10% 3 Protected and Permitted 12% 3 Fully Protected 15% 4 Protected and Permitted 14% 4 Fully Protected 18% 4 Source: Guidelines for Signalized Intersection Analysis, LINSCOTT, LAW & GREENSPAN, engineers LLG Ref Pacific Pointe East, Long Beach N:\3400\ Pacific Pointe, Long Beach\Report\3437 Pacific Pointe East TIA doc
272 TABLE 3-2 LEVEL OF SERVICE CRITERIA FOR SIGNALIZED INTERSECTIONS (ICU METHODOLOGY) 5 Level of Service (LOS) Intersection Capacity Utilization Value (V/C) Level of Service Description A B C D E F > EXCELLENT. No vehicle waits longer than one red light, and no approach phase is fully used. VERY GOOD. An occasional approach phase is fully utilized; many drivers begin to feel somewhat restricted within groups of vehicles. GOOD. Occasionally drivers may have to wait through more than one red light; backups may develop behind turning vehicles. FAIR. Delays may be substantial during portions of the rush hours, but enough lower volume periods occur to permit clearing of developing lines, preventing excessive backups. POOR. Represents the most vehicles intersection approaches can accommodate; may be long lines of waiting vehicles through several signal cycles. FAILURE. Backups from nearby locations or on cross streets may restrict or prevent movement of vehicles out of the intersection approaches. Potentially very long delays with continuously increasing queue lengths. 5 Source: Transportation Research Board Circular Interim Materials on Highway Capacity. LINSCOTT, LAW & GREENSPAN, engineers LLG Ref Pacific Pointe East, Long Beach N:\3400\ Pacific Pointe, Long Beach\Report\3437 Pacific Pointe East TIA doc
273 The ICU value translates to a Level of Service (LOS) estimate, which is a relative measure of the intersection performance. The six qualitative categories of Level of Service have been defined along with the corresponding ICU value range and are shown in Table 3-2. The ICU value is the sum of the critical volume to capacity ratios at an intersection; it is not intended to be indicative of the LOS of each of the individual turning movements Highway Capacity Manual (HCM) Method of Analysis (Unsignalized Intersections) The 2000 HCM unsignalized methodology for stop-controlled intersections was utilized for the analysis of the unsignalized intersections. This methodology estimates the average control delay for each of the subject movements and determines the level of service for each movement. For all-way stop controlled intersections, the overall average control delay measured in seconds per vehicle, and level of service is then calculated for the entire intersection. For one-way and two-way stopcontrolled (minor street stop-controlled) intersections, this methodology estimates the worst side street delay, measured in seconds per vehicle and determines the level of service for that approach. The HCM control delay value translates to a Level of Service (LOS) estimate, which is a relative measure of the intersection performance. The six qualitative categories of Level of Service have been defined along with the corresponding HCM control delay value range, as shown in Table Level of Service Criteria According to the, LOS D is the minimum acceptable condition that should be maintained during the peak commute hours, or the current LOS if the existing LOS is worse than LOS D (i.e. LOS E of F). 3.6 Existing Level of Service Results Table 3-4 summarizes the existing peak hour service level calculations for the six (6) key study intersections based on existing traffic volumes and current street geometrics. Review of Table 3-4 indicates that one of the six (6) key study intersections currently operates at an unacceptable level of service during the PM peak hour. The intersection of Clark Avenue at Carson Street currently operates at unacceptable LOS E during the PM peak hour. The remaining five key study intersections currently operate at acceptable levels of service during the AM and PM peak hours. Appendix B contains the existing AM peak hour and PM peak hour level of service calculations for the six (6) key study intersections. LINSCOTT, LAW & GREENSPAN, engineers LLG Ref Pacific Pointe East, Long Beach N:\3400\ Pacific Pointe, Long Beach\Report\3437 Pacific Pointe East TIA doc
274 TABLE 3-3 LEVEL OF SERVICE CRITERIA FOR UNSIGNALIZED INTERSECTIONS Level of Service (LOS) Highway Capacity Manual Delay Value (sec/veh) Level of Service Description A 10.0 Little or no delay B > 10.0 and 15.0 Short traffic delays C > 15.0 and 25.0 Average traffic delays D > 25.0 and 35.0 Long traffic delays E > 35.0 and 50.0 Very long traffic delays F > 50.0 Severe congestion LINSCOTT, LAW & GREENSPAN, engineers LLG Ref Pacific Pointe East, Long Beach N:\3400\ Pacific Pointe, Long Beach\Report\3437 Pacific Pointe East TIA doc
275 TABLE 3-4 EXISTING PEAK HOUR LEVELS OF SERVICE Key Intersection Time Period Control Type ICU/HCM LOS Lakewood Boulevard at AM 8 Phase B Carson Street PM Signal C Lakewood Boulevard at AM 6 Phase A Conant Street PM Signal B Lakewood Boulevard at AM 8 Phase B Donald Douglas Drive/Wardlow Road PM Signal B Faculty Avenue at AM All-Way 11.3 s/v B Conant Street PM Stop 8.7 s/v A Clark Avenue at AM 8 Phase C Carson Street PM Signal E Clark Avenue at AM 2 Phase A Conant Street PM Signal A Notes: Bold ICU/LOS and HCM/LOS values indicate adverse service levels based on City LOS standards s/v = seconds per vehicle (delay) LINSCOTT, LAW & GREENSPAN, engineers LLG Ref Pacific Pointe East, Long Beach N:\3400\ Pacific Pointe, Long Beach\Report\3437 Pacific Pointe East TIA doc
276 3.7 Conant Street at Faculty Avenue Traffic Signal Warrant Analysis Per the direction of City staff, a traffic signal warrant analysis of Conant Street at Facility Avenue has been conducted based on existing traffic volumes, current intersection lane geometrics and controls, and the signal warrant criteria/guidelines contained in the California Manual of Uniform Traffic Control Devices (MUTCD). Faculty Avenue is a two-lane local street. At the intersection with Conant Street, Faculty Avenue provides one approach lane and one departure lane. The posted speed limit on Faculty Avenue is 30 mph. Eastbound and westbound traffic on Conant Street is controlled via a stop sign, as is southbound traffic on Faculty Avenue California MUTCD Policy/Criteria The justification for the installation of a traffic signal at an intersection is based on several guidelines, which include the warrants set forth in the California Manual of Uniform Traffic Control Devices (MUTCD). The warrants consider conditions involving traffic volumes on the intersecting streets, the difficulty of vehicles on a side street crossing a major street, the number of recorded accidents that may be correctable by a traffic signal, and special conditions that may be improved by a traffic signal. Other factors taken into consideration for the installation of a traffic signal include: approach conditions, driver confusion and comfort level, safety conditions, future land uses, and other indications demonstrating the need for right of way assignment beyond that which could be provided by stop signs. Traffic signals exert a significant influence on vehicle and pedestrian traffic flow. Traffic signals are designed to draw the attention of drivers approaching an intersection. Their main purpose is to safely assign the right-of-way to various traffic movements, and thus, may be notably advantageous. Some advantages include: Provide for the orderly movement of traffic, Can increase the traffic handling capacity of the intersection, Reduce the frequency of certain types of accidents (especially the right angle type), Can be coordinated to provide for continuous, or nearly continuous movement, of traffic at a definite speed along a given route, and Permit minor street traffic, vehicular or pedestrian, to enter, or cross, continuous traffic on the major street. LINSCOTT, LAW & GREENSPAN, engineers LLG Ref Pacific Pointe East, Long Beach N:\3400\ Pacific Pointe, Long Beach\Report\3437 Pacific Pointe East TIA doc
277 However, improper or unwarranted traffic control signals may also cause disadvantages. In some circumstances, traffic signals may cause more problems than it solves. Possible disadvantages include: Excessive motorist delays, Disobedience of the signal indications, Increased accident frequency (rear-end collisions may increase), and Reduce intersection capacity Existing Traffic Volumes Table 3-5 summarizes the existing hourly approach traffic volumes on Conant Street and Faculty Avenue. Existing daily traffic counts for this intersection were collected by Transportation Studies, Inc. in February Appendix A also contains the daily approach counts at this intersection Traffic Signal Warrant Evaluation This assessment is made on the basis of signal warrant criteria published in the California Manual on Uniform Traffic Control Devices (CA MUTCD). For the study intersection of Conant Street at Faculty Avenue, the need for signalization is assessed on the basis of the following traffic signal warrants as described in the CA MUTCD) using existing daily traffic volumes collected at this intersection. Warrant No. #1A: Warrant No. #1B: Warrant No. #2: Warrant No. #3: Minimum vehicular volumes warrant Interruption of continuous traffic warrant Four hour warrant Peak hour warrant The results of the traffic signal warrant analysis based on existing Year 2014 Traffic Conditions is summarized in Table 3-6. As shown, based on the existing traffic volumes and current intersection geometrics, the study intersection did not satisfy any of the applicable signal warrants identified above. Appendix A also the detailed traffic signal warrant worksheet for the Conant Street at Facility Avenue based on existing traffic volume conditions. As noted in Table 3-4, the unsignalized intersection of Conant Street at Faculty Avenue currently operates at LOS B during the weekday AM peak hour and LOS A during the weekday PM peak hour. LINSCOTT, LAW & GREENSPAN, engineers LLG Ref Pacific Pointe East, Long Beach N:\3400\ Pacific Pointe, Long Beach\Report\3437 Pacific Pointe East TIA doc
278 TABLE 3-5 EXISTING DAILY TRAFFIC VOLUMES FOR CONANT STREET AT FACULTY AVENUE 6 Conant Street (Major) Faculty Avenue (Minor) Combined Time Period EB WB Total SB Total 12:00 AM :00 AM :00 AM :00 AM :00 AM :00 AM :00 AM :00 AM :00 AM :00 AM :00 AM :00 AM :00 PM :00 PM :00 PM :00 PM :00 PM :00 PM :00 PM :00 PM :00 PM :00 PM :00 PM :00 PM Total 3,501 1,777 5,278 3,380 8,658 Note: Bold/Shaded figures represent highest eight (8) hours of traffic volumes. 6 Source: Daily traffic counts conducted by Transportation Studies, Inc. on February 11, LINSCOTT, LAW & GREENSPAN, engineers LLG Ref Pacific Pointe East, Long Beach N:\3400\ Pacific Pointe, Long Beach\Report\3437 Pacific Pointe East TIA doc
279 TABLE 3-5 EXISTING TRAFFIC SIGNAL WARRANT ANALYSIS SUMMARY FOR CONANT STREET AT FACULTY AVENUE Warrant Satisfied? California MUTCD Traffic Signal Warrant 7 Yes No Warrant 1A - Minimum Vehicular Volume 100% Satisfied 80% Satisfied X X Warrant 1B - Interruption of Continuous Traffic 100% Satisfied 80% Satisfied X X Warrant 2 - Four Hour Volume X Warrant 3A - Peak Hour Delay X Warrant 3B - Peak Hour Volume X Warrant 4 - Minimum Pedestrian Volume Pedestrian Data Not Available Warrant 5 - School Crossing Pedestrian Data Not Available Warrant 6 - Coordinated Signal System Not Applicable Warrant 7 - Crash Experience Data Not Available Warrant 8 - Roadway Network Data Not Available TRAFFIC SIGNAL IS NOT WARRANTED 7 Source: California Manual on Uniform Traffic Control Devices (MUTCD), Part 4 Highway Traffic Signals LINSCOTT, LAW & GREENSPAN, engineers LLG Ref Pacific Pointe East, Long Beach N:\3400\ Pacific Pointe, Long Beach\Report\3437 Pacific Pointe East TIA doc
280 4.0 TRAFFIC FORECASTING METHODOLOGY In order to estimate the traffic impact characteristics of the proposed Project, a multi-step process has been utilized. The first step is traffic generation, which estimates the total arriving and departing traffic on a peak hour and daily basis. The traffic generation potential is forecast by applying the appropriate vehicle trip generation equations or rates to the project development tabulation. The second step of the forecasting process is traffic distribution, which identifies the origins and destinations of inbound and outbound project traffic. These origins and destinations are typically based on demographics and existing/expected future travel patterns in the study area. The third step is traffic assignment, which involves the allocation of project traffic to study area streets and intersections. Traffic assignment is typically based on minimization of travel time, which may or may not involve the shortest route, depending on prevailing operating conditions and travel speeds. Traffic distribution patterns are indicated by general percentage orientation, while traffic assignment allocates specific volume forecasts to individual roadway links and intersection turning movements throughout the study area. With the forecasting process complete and project traffic assignments developed, the impact of the project is isolated by comparing operational (LOS) conditions at selected key intersections using expected future traffic volumes with and without forecast project traffic. The need for site-specific and/or cumulative local area traffic improvements can then be evaluated. LINSCOTT, LAW & GREENSPAN, engineers LLG Ref Pacific Pointe East, Long Beach N:\3400\ Pacific Pointe, Long Beach\Report\3437 Pacific Pointe East TIA doc
281 5.0 PROJECT TRAFFIC CHARACTERISTICS 5.1 Project Traffic Generation Traffic generation is expressed in vehicle trip ends, defined as one-way vehicular movements, either entering or exiting the generating land use. Generation equations and/or rates used in the traffic forecasting procedure are found in the Ninth Edition of Trip Generation, published by the Institute of Transportation Engineers (ITE) [Washington D.C., 2012]. Table 5-1 summarizes the trip generation rates used in forecasting the vehicular trips generated by the proposed Project and presents the forecast daily and peak hour project traffic volumes for a "typical" weekday. As shown in the upper portion of this table, the trip generation potential for the proposed Project was forecast using ITE Land Use Code 140: Manufacturing average trip rates and ITE Land Use 150: Warehousing average trip rates. Specifically, ITE Land Use Code 140: Manufacturing average trip rates were utilized to estimate the trip generation potential for Buildings 9 and 10 and ITE Land Use Code 150: Warehousing average trip rates were utilized to estimate the trip generation potential for Building 11. To provide a conservative assessment, no adjustment to the Project s trip generation forecast has been applied in this analysis to account for the Transportation Demand Management (TDM) Program required of Project by the City. As shown in the upper portion of Table 5-1 (i.e. below the trip generation rates), Buildings 9, 10, and 11 of the Project site are forecast to generate 1,827 daily trips, with 261 trips (205 inbound, 56 outbound) produced in the AM peak hour and 266 trips (87 inbound, 179 outbound) produced in the PM peak hour on a typical weekday. A comparison of the Project s 266 PM peak hour trips indicates that it is significantly less than the 5,503 PM peak hour trip threshold that is allowed within PD-19. To account for the truck trip potential of the proposed Project, truck traffic was forecast using the following daily, AM peak hour and PM peak hour truck percentages for manufacturing uses and warehouse uses based on information contained within the San Bernardino/Riverside County Warehouse/Distribution Center Vehicle Trip Generation Study (January 2005). A passenger car equivalent (PCE) of 2.5 was applied to each truck trip generation estimate. Manufacturing Truck Percentages = Daily: 12%, AM: 14% and PM: 9% Warehousing Truck Percentages = Daily: 16%, AM: 19% and PM: 12% Review of the middle portion of Table 5-1 shows that Building 9 is forecast to generate 649 daily PCE trips with 128 PCE trips forecast during the AM peak hour and 119 PCE trips forecast during the PM peak hour. Building 10 is forecast to generate 532 daily PCE trips with 105 PCE trips forecast during the AM peak hour and 99 PCE trips forecast during the PM peak hour. Building 11 is forecast to generate 1,024 daily PCE trips with 90 PCE trips forecast during the AM peak hour and 89 PCE trips forecast during the PM peak hour. Overall, as shown in the lower portion of Table 5-1, the trip generation potential for the proposed Project (i.e. Buildings 9, 10 and 11) totals 2,205 daily PCE trips, with 323 PCE trips (253 inbound, 70 outbound) forecast during the AM peak hour and 307 PCE trips (100 inbound, 207 outbound) forecast during the PM peak hour. LINSCOTT, LAW & GREENSPAN, engineers LLG Ref Pacific Pointe East, Long Beach N:\3400\ Pacific Pointe, Long Beach\Report\3437 Pacific Pointe East TIA doc
282 Project Description Trip Generation Rates: TABLE 5-1 PROJECT TRAFFIC GENERATION FORECAST 8 Daily AM Peak Hour PM Peak Hour Enter Exit Total Enter Exit Total 140: Manufacturing (TE/1000 SF) : Warehousing (TE/1000 SF) Trip Generation Forecast: Pacific Pointe East Lot D Building 9 - Manufacturing (144,000 SF) Building 10 - Manufacturing (118,000 SF) Building 11 - Warehousing (232,000 SF) Total Project Trip Generation Potential 1, Building 9 - Manufacturing (144,000 SF) Passenger Cars Trips Truck PCE Trips Building 9 Total PCE Trips Building 10 - Manufacturing (118,000 SF) Passenger Cars Trips Truck PCE Trips Building 10 Total PCE Trips Building 11 - Warehousing (232,000 SF) Passenger Cars Trips Truck PCE Trips Building 11 Total PCE Trips 1, Total Project Trip Generation (494,000 SF) Passenger Cars Trips 1, Truck PCE Trips Total Project PCE Trip Generation: 2, Notes: TE/1000 SF = Trip ends per 1,000 SF of development Source: Trip Generation, 9 th Edition, Institute of Transportation Engineers (ITE) [Washington, D.C. (2012)]. Manufacturing Truck Estimates: AM peak hour: 14% trucks, PM peak hour: 9% trucks, ADT: 12% trucks, P.C.E. = 2.5 vehicles per truck. Warehousing Truck Estimates: AM peak hour: 19% trucks, PM peak hour: 12% trucks, ADT: 16% trucks, P.C.E. = 2.5 vehicles per truck. LINSCOTT, LAW & GREENSPAN, engineers LLG Ref Pacific Pointe East, Long Beach N:\3400\ Pacific Pointe, Long Beach\Report\3437 Pacific Pointe East TIA doc
283 5.2 Project Traffic Distribution and Assignment Traffic distribution determines the directional orientation of traffic. It is based upon the location, intensity of use, accessibility of existing and planned residential areas, employment centers, and other commercial activities. Traffic assignment is the determination of specific trip routes, given the previously developed traffic distribution. Primary factors in route selection are the generalized travel direction, minimum time and minimum distance paths. The general, directional traffic distribution pattern for the passenger cars and truck components of the Project are graphically presented in Figure 5-1 and Figure 5-2, respectively. Project traffic volumes entering and exiting the project site have been distributed and assigned to the adjacent street system based upon the following considerations: the site's proximity to major traffic carriers (i.e. I-405 Freeway and Lakewood Boulevard), expected localized traffic flow patterns based on adjacent street channelization and presence of traffic signals and turn restrictions at the study intersections, existing intersection traffic volumes, ingress/egress availability at the project site, and existing truck routes in the area. The anticipated AM and PM peak hour project traffic volumes associated with the proposed Project are presented in Figures 5-3 and 5-4, respectively. Figure 5-4 also presents the daily project traffic volumes. Please note that the traffic volume assignments presented in Figures 5-3 and 5-4 reflect the traffic distribution characteristics illustrated in Figures 5-1 and 5-2 and the project traffic generation forecast presented in Table 5-1. It should be noted that the trip generation methodology and forecasts were approved by City staff prior to proceeding with further analyses. 5.3 Existing Plus Project Traffic Conditions The existing plus project traffic conditions have been generated based upon existing conditions and the estimated project traffic. These forecast traffic conditions have been prepared pursuant to the California Environmental Quality Act (CEQA) guidelines, which require that the potential impacts of a Project be evaluated upon the circulation system as it currently exists. This traffic volume scenario and the related intersection capacity analyses will identify the roadway improvements necessary to mitigate the direct traffic impacts of the Project, if any. Figures 5-5 and 5-6 present projected AM and PM peak hour traffic volumes at the six (6) key study intersections with the addition of the trips generated by the proposed Project to existing traffic volumes, respectively. Figure 5-6 also presents the existing plus project daily traffic volumes. LINSCOTT, LAW & GREENSPAN, engineers LLG Ref Pacific Pointe East, Long Beach N:\3400\ Pacific Pointe, Long Beach\Report\3437 Pacific Pointe East TIA doc
284
285
286
287
288
289
290 6.0 FUTURE TRAFFIC CONDITIONS 6.1 Ambient Traffic Growth Horizon year, background traffic growth estimates have been calculated using an ambient growth factor. The ambient traffic growth factor is intended to include unknown and future related projects in the study area, as well as account for regular growth in traffic volumes due to the development of projects outside the study area. The future growth in traffic volumes has been calculated at two percent (2%) per year. Applied to existing Year 2014 traffic volumes results in a four percent (4%) increase growth in existing volumes to horizon year Related Projects Traffic Characteristics In order to make a realistic estimate of future on-street conditions prior to implementation of the proposed Project, the status of other known development projects (related projects) in the area has been researched. With this information, the potential impact of the proposed Project can be evaluated within the context of the cumulative impact of all ongoing development. Based on our research, there are seven (7) related projects within a two-mile radius of the project that are either located in the or the City of Lakewood. These projects have either been built, but not yet fully occupied, or are being processed for approval. These seven (7) related projects have been included as part of the cumulative background setting. Table 6-1 provides the location and a brief description for each of the seven (7) related projects. Figure 6-1 graphically illustrates the location of the related projects. These related projects are expected to generate vehicular traffic, which may affect the operating conditions of the key study intersections. Table 6-2 presents the development totals and resultant trip generation for the related projects. As shown in Table 6-2, the related projects are expected to generate a combined total of 6,132 daily trips on a typical weekday, with 493 trips (380 inbound and 113 outbound) forecast during the AM peak hour, and 621 trips (207 inbound and 414 outbound) forecast during the PM peak hour. 6.3 Year 2016 Traffic Volumes Figures 6-2 and 6-3 present AM and PM peak hour cumulative project traffic volumes at the key study intersections for the Year 2016, respectively. Figure 6-3 also presents the daily related project traffic volumes. Figures 6-4 and 6-5 present future AM and PM peak hour cumulative traffic volumes at the key study intersections for the Year 2016, respectively. Figure 6-5 also presents the Year 2016 daily cumulative traffic volumes. Please note that the cumulative traffic volumes represent the accumulation of existing traffic, ambient growth traffic, and related projects traffic. Figures 6-6 and 6-7 illustrate Year 2016 forecast AM and PM peak hour traffic volumes with the inclusion of the trips generated by the proposed Project, respectively. Figure 6-7 also presents the Year 2016 daily cumulative plus project traffic volumes. LINSCOTT, LAW & GREENSPAN, engineers LLG Ref Pacific Pointe East, Long Beach N:\3400\ Pacific Pointe, Long Beach\Report\3437 Pacific Pointe East TIA doc
291 TABLE 6-1 LOCATION AND DESCRIPTION OF RELATED PROJECTS 11 No. Related Project Address Jurisdiction Description/Size Building 8 at Pacific Pointe South Urbana Medical Office Development Mercedes Benz West Coast Campus City of Lakewood 3865 Lakewood Boulevard Long Beach 3824 Schaufele Avenue Long Beach 3860 Lakewood Boulevard Long Beach 58,645 SF of industrial/warehouse space 91,560 SF of medical office space within two (2) buildings Renovation of 1,064,615 SF of existing warehouse space to accommodate: Vehicle Preparation Center (VPC) 45,745 SF /100 staff Learning and Performance Center (LPC) 48,140 SF/ 40 staff Regional Office (Western Region) 50 staff within 8,358 SF Classic Car Center 30 staff 4. Chuck E. Cheese 5151 Lakewood Boulevard Lakewood 2,000 SF expansion 5. Applebee s 4935 Graywood Avenue Lakewood 5,757 SF restaurant 6. Gymnasium 4007 Paramount Boulevard, #109 Lakewood 4,488 SF gymnasium 7. YMCA 5835 Carson Street Lakewood 9,554 SF gymnasium Notes: SF = Square-Feet 11 Source: Planning Department and City of Lakewood Planning Department. LINSCOTT, LAW & GREENSPAN, engineers LLG Ref Pacific Pointe East, Long Beach N:\3400\ Pacific Pointe, Long Beach\Report\3437 Pacific Pointe East TIA doc
292 No. / Related Projects Description 1. Building 8 at Pacific Pointe South 2. Urbana Medical Office Development 3. Mercedes Benz West Coast Campus TABLE 6-2 RELATED PROJECTS TRAFFIC GENERATION FORECAST 12 Daily 2-way AM Peak Hour PM Peak Hour In Out Total In Out Total , Warehouse (100 employees) Technical School (40 staff) Corporate Office (30 employees) City of Lakewood Museum (30 employees) Sub-Total 1, Chuck E. Cheese Applebee's Pass-by (Daily: 25%; PM: 44%) Sub-Total Gymnasium YMCA Total Related Projects Trip Generation Potential 6, Source: Trip Generation, 9 th Edition, Institute of Transportation Engineers (ITE) [Washington, D.C. (2012)]. LINSCOTT, LAW & GREENSPAN, engineers LLG Ref Pacific Pointe East, Long Beach N:\3400\ Pacific Pointe, Long Beach\Report\3437 Pacific Pointe East TIA doc


293