Utah Wind Working Group
|
|
|
- Grant Little
- 5 years ago
- Views:
Transcription
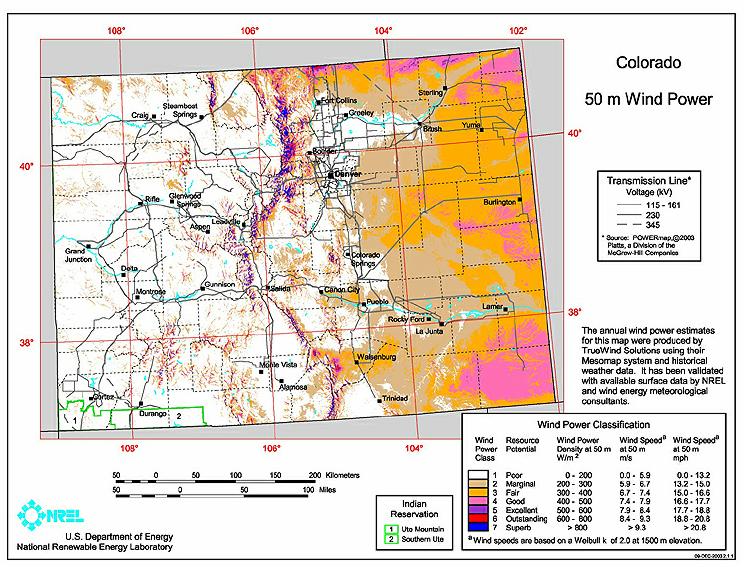
1 The Impact Of The Renewable Energy Standard In Amendment 37 On Electric Rates In Colorado Utah Wind Working Group Remarks of Ron Binz April 6, 2005
2 Energy and Telecom Policy Current and Recent Clients AARP WY, UT, ND, CO Colorado Energy Assistance Foundation Catholic Charities Colorado OCC Energy Foundation Homebuilders Association of Metro Denver Astaris, LLC Environment Colorado National Association of State Utility Consumer Advocates Missouri Office of Public Counsel Univance, LLC NASUCA members in CO, GA, ME, MO, MD, MI, OH, OR and PA Competition Policy Institute Qwest Communications Valor Telecom Oregon Citizens Utility Board Wyoming Industrial Electric Consumers BOMA Denver Georgia CUC


3 This presentation will be available on
4 2004 Colorado RES Report Available at
5 The Colorado RES Applies to utilities with >40,000 customers Defines renewables Solar requirement (4% of RES) in addition to general requirement REAs, Munis can self-certify (no solar requirement) Limits rate impact to 50 per month for residential customers Benchmark Date Renewable Energy Required (% of sales) 3% 6% 10% Solar Energy Required (% of sales) 0.12% 0.24% 0.40%
6 Study Method Estimate energy growth for 15 utilities to 2024 Estimate wind costs With and without Production Tax Credit Estimate capacity value Estimate solar costs to 2024 Central Station and Distributed Solar Estimate capital and operating costs of combined cycle plant to 2024 Estimate natural gas prices to 2024
7 Study Method Develop REC price model Model A37 compliance for each utility Calculate rate impact for each utility 9 scenarios: High, Med, Low gas prices; 3 cases for PTC continuance: none, to 2006, to Weight scenarios with probabilities Produce expected value Model gas price spike case to illustrate option value of wind, solar Discuss air, water and tax revenue externalities
8 Renewable Resources Required by Initiative Gigawatt-hours (Thousands) New Renewable Resources Existing Renewable Resources Non-Renewable Resources
9 Colorado Electric Generation By Fuel Type, % Renewables 19.8% Natural Gas 2.2% Hydro 0.1% Oil 77.6% Coal
10 Utah Electric Generation By Fuel Type, % Renewables 1.3% Hydro 3.8% Natural Gas 0.1% Oil 94.2% Coal
11 Colorado Retail Electricity Sales Megawatthours by Industry Sector, 2002 Rural Electric Coops 22% Investor- Owned 60% Municipal 18%
12 Colorado Utilities Subject to the Renewable Energy Standard in 2005 (by KWh sales) United Pow er Holy Cross REA Exempt Utilities City of Fort Collins Aquila Intermountain REA Colorado Springs Utilities Public Service Company The RES requirement will apply to 79% of Colorado electric power sales in 2005

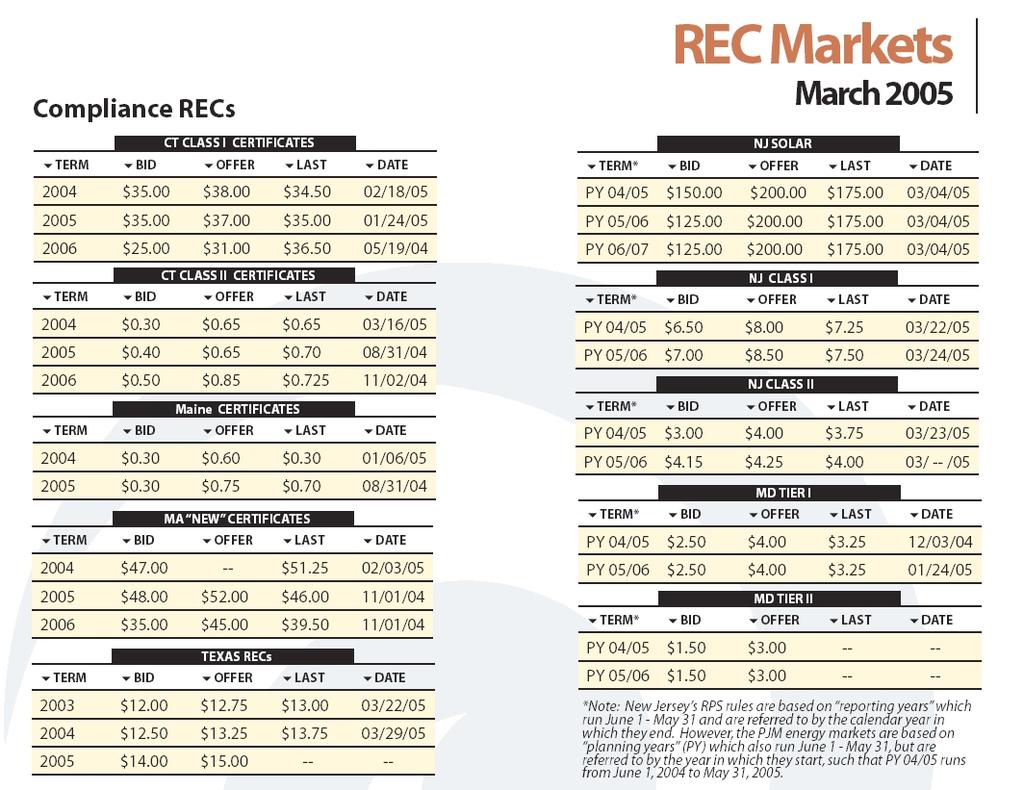
13 Renewable Standard in Other States
14 State Arizona California Connecticut Hawaii Iowa Maine Maryland Massachusetts Minnesota Nevada New Jersey New Mexico New York Pennsylvania Rhode Island Texas Wisconsin Adopted Renewable Energy Standard 1% in 2005; 1.05% in 2006; 1.1%/year 2007 to 2012 At least 1%/year; 20% by % by % in 2010; 15% in 2015; 20% in MWa, approximately 2% of 1999 sales 30% of sales including high efficiency cogeneration 7% by 2017 from non-hydro and non-wte renewables 4% new renewables on 7% base by 2009; 1%/year thereafter 10% of 2015 sales 5% in 2003, increasing to 15% of retail sales by % by % of sales by 2011 PSC in process of setting standard Limited renewable requirements for one utility 3% in 2007; 4.5% in 2010; 8.5% in 2014; 17% in MW by 2009, approx 3% of sales 0.5% by 12/31/01, increasing to 2.2% by 12/31/11
15

16
17
18 Natural Gas Wellhead Prices Energy Information Administration Actual ; Projected Dollars per MMBTU Actual Forecast
19 Generation Cost of Electricity in Colorado Advanced Combined Cycle Plant (2004$) Base Gas Cost Case Cents per Kwh
20 EIA Costs of Fossil Generation Costs Advanced coal 2010 Advanced combined cycle Advanced coal mills per kilowatt-hour Advanced combined cycle Capital Fixed Variable Incremental transmission Total
21 Natural Gas Price Scenarios Delivered Prices , Mountain Region $/MMBTU Base Gas Case High Gas Case Low Gas Case

22 US Insolation Map

23
24 Cost of Central Station Solar (Sargent and Lundy for NREL)
25 Apr-04 Jul Market Price of Solar Modules Survey of 230+ Vendors Jan-04 Apr-01 Jul-01 Oct-01 Jan-02 Apr-02 Jul-02 Oct-02 Jan-03 Apr-03 Jul-03 Oct-03 Jan-01 Oct-00 $ per Watt
26 Colorado Retail Electric Rates, 2002 Sector Residential Price/KWh Commercial Price/KWh Industrial Price/KWh Total State Investor-Owned Utilities Municipal Utilities Rural Cooperatives
27 Photovoltaic Generation by Time of Day and Month of Year Pueblo, Colorado -- Fixed Tilt System Jan Mar May Jul Sep Nov 1 AM 4 AM 7 AM 10 AM 1 PM 4 PM 7 PM 10 PM Kilowatthours Electricity 10 0 Hour of Day Month of Year
28 Scenarios used in Wind cost estimate Scenario Gas Price Assumption PTC Assumption Scenario 1A Base Gas Cost No PTC Extension Scenario 1B Base Gas Cost PTC to 12/31/2006 Scenario 1C Base Gas Cost PTC to 12/31/2009 Scenario 2A High Gas Cost No PTC Extension Scenario 2B High Gas Cost PTC to 12/31/2006 Scenario 2C High Gas Cost PTC to 12/31/2009 Scenario 3A Low Gas Cost No PTC Extension Scenario 3B Low Gas Cost PTC to 12/31/2006 Scenario 3C Low Gas Cost PTC to 12/31/2009
29 Rate Impact of Colorado RPS for : Nine Scenarios Xcel Total 20 Year Effect Impact on Average Residential M onthly Bill Scenario Senario Description Nominal NPV Overall Range Col A Col B Col C Col D Col E Col F 1A Base Gas Case, No PTC 390,461, ,905, B Base Gas Case, PTC to ,709,183 (1,944,066) (0.19) 1C Base Gas Case, PTC to 2010 (146,287,190) (43,740,649) (0.14) 0.04 (0.26) 2A High Gas Case, No PTC 245,618, ,278, B High Gas Case, PTC to 2006 (120,133,732) (44,570,536) (0.11) 0.03 (0.21) 2C High Gas Case, PTC to 2010 (291,130,104) (86,367,119) (0.27) 0.03 (0.45) 3A Low Gas Case, No PTC 535,304, ,531, B Low Gas Case, PTC to ,552,097 40,682, (0.16) 3C Low Gas Case, PTC to 2010 (1,444,275) (1,114,180) (0.00) 0.16 (0.16)
30 Scenarios used in model Scenario Probabilities Scenario 1A: Scenario 1B: Scenario 1C: Scenario 2A: Scenario 2B: Scenario 2C: Scenario 3A: Scenario 3B: Scenario 3C: Base Gas, No PTC Base Gas, PTC to 2006 Base Gas, PTC to 2010 High Gas, No PTC High Gas, PTC to 2006 High Gas, PTC to 2010 Low Gas, No PTC Low Gas, PTC to 2006 Low Gas, PTC to % 35% 10% 3% 21% 6% 2% 14% 4%
31 Xcel Energy -- Change in Average Residential Monthly Bill Due to Compliance with Amendment 37 Increase (Decrease) in M onthly Bill $0.15 $0.10 $0.05 $0.00 ($0.05) ($0.10) ($0.15) year average = $0.01/mo ($0.20)
32
33 Impact of the Colorado Renewable Energy Standard Proposed in Amendment 37 Impact on 20-Year Utility Revenue Requirements, by Utility Impact on Monthly Residential Bills, by Utility Utility Name 20-Year Impact on Total Retail Revenues Residential Monthly Bill Impact 20 Year Average Max in Any Year Min in Any Year Notes Public Service Company 12,600, (0.19) A, B City of Colorado Springs REC Strategy 29,730, C, J Wind Purchase Strategy (63,560,352) (0.33) (0.24) (0.42) D, J Combination Strategy (16,914,877) (0.09) 0.02 (0.16) E, J Intermountain REA (24,561,694) (0.45) (0.30) (0.54) F, J Aquila 542, (0.22) B, G City of Fort Collins H, J Holy Cross Electric Association (14,124,008) (0.48) (0.35) (0.61) F, J United Power 5,587, I, C, J City of Longmont (2,864,165) (0.09) 0.04 (0.15) E, J M ountain View Electric Association 3,752, I, C, J La Plata Electric Association 6,088, I, C, J Poudre Valley REA 4,733, I, C, J Delta M ontrose Electric Association 3,164, I, C, J Yampa Valley Electric Association (7,116,752) (0.39) (0.28) (0.50) F, J City of Loveland (1,889,240) (0.14) (0.06) (0.21) E, J San Isabel Electric Association 56, I,C, J Total State (14,028,808) Notes: A -- Uses Expected Value Assumptions for Natural Gas Prices and Status of Production Tax Credit B -- Solar Requirement Met 50% Central Station, 50% Distributed Resources C -- Assumes RES Met By Purchase of Renewable Energy Certificates (RECs) D -- Assumes RES Met With Wind Purchases Beginning 2006 E -- Assumes Combination Strategy; 50% RECs, 50% Wind Purchases F -- PSCo Full Requirements Customer; PSCo effect passed through wholesale rates G -- PSCo Partial Requirements Customer; PSCo effect passed through wholesale rates H -- Adheres to Own Renewable Energy Standard I -- TriState Member; Options Limited by Power Purchase Agreement J -- Assumes Self-Certification with No Solar Requirement
34 Natural Gas Wellhead Prices Actual ; Projected AEO 2004 with Assumed Price Spikes 7 Assumed Price Spikes 6 Dollars per MMBTU
35 Impact of RES on Consumptive Water Use Impact of RES on Consumptive Water Use RES Displacing Natural Gas Generation Impact of RES on Consumptive Water Use RES Displacing Coal Generation Total Impact Total Impact MWh Gallons Saved Acre-Feet Saved MWh Gallons Saved Acre-Feet Saved 84,904,806 21,226,201,572 65,164 84,904,806 41,603,355, ,722 Average Annual Impact Average Annual Impact MWh Gallons Saved Acre-Feet Saved MWh Gallons Saved Acre-Feet Saved 4,245,240 1,061,310,079 3,258 4,245,240 2,080,167,754 6,386
36 Conclusions RES will likely have minimal impact on rates; Varies by utility; Very unlikely to exceed 50 cap on residential rates; Wind savings offset solar costs Substantial air and water impacts Rural economic development impact
37 The End Thanks for the invitation.