Valuing Ecosystem Services: InVEST Tools. Adrian L. Vogl, Ph.D. The Natural Capital Project, Stanford University
|
|
|
- Gertrude Bell
- 5 years ago
- Views:
Transcription
1 Valuing Ecosystem Services: InVEST Tools Adrian L. Vogl, Ph.D. The Natural Capital Project, Stanford University 1

2 2
3 What is the Value of Nature? 3
4 Valuing Nature in Decisions 4

5 What policies can help promote green growth? 5

6 How do you get multi-agency cooperation? 6

7 How do you design efficient incentives? 7

8 How can communities adapt to climate change? 8


9 Which companies or projects meet safeguards? 9

10 How can we improve national accounts? 10


11 The Natural Capital Approach: Tools InSEAM InVEST Scenario Modeler 11
12 InVEST Map, quantify and value multiple ecosystem services 12


13 Spatially Explicit Ecological Production Functions Production function Ecological Production Function- an equation that relates the physical outputs of a production process to physical inputs 13
14 InVEST Model Structure Supply Service Value Ecological functions Ecosystem elements Supply + Location and activity of beneficiaries Service + Social preference 14
15 Why InVEST? Applicable across the globe Requires easily-available data Flexible scale Relevant to many kinds of decisions Biophysical and economic outputs Allows multi-service assessment Considers landscape context 15
16 Recent Advances Freely available 3.0 Framework ArcGISindependent Uncertainty assessment in carbon model Helper tools, Batch scripting Scenario generating tools Active development community 16
17 InVEST Software - Terrestrial InVEST Beta can map Biodiversity: Habitat Quality Water yield for hydropower production Erosion control: reservoirs and WQ Water purification: nutrient retention Carbon sequestration & storage Managed timber production Crop pollination 17 Coming Soon Agricultural Production

18 InVEST Software - Terrestrial InVEST Beta can map Biodiversity: Habitat Quality Water yield for hydropower production Erosion control: reservoirs and WQ Water purification: nutrient retention Carbon sequestration & storage Managed timber production Crop pollination 18 Coming Soon Agricultural Production
 Sediment Retention (Water quality, Avoided dredging) Flood Risk Mitigation Non-Timber Forest Products Marine Water Quality Habitat Quality/Risk")

19 InVEST Models & Linkages Crop Production Crop Pollination Managed Timber Production Carbon sequestration Nutrient Retention (Water quality) Water Yield (Hydropower, Irrigation, Drinking) Sediment Retention (Water quality, Avoided dredging) Flood Risk Mitigation Non-Timber Forest Products Marine Water Quality Habitat Quality/Risk Assessment Aquaculture Coastal Vulnerability Coastal Protection Fisheries (including recreational) Blue Carbon Wave Energy Aesthetic Quality Recreation Overlap Analysis Terrestrial/freshwater model: Tier 0 Terrestrial/freshwater model: Tier 0 Marine model: Tier 1 Marine model: Tier 0 Model coming soon! Optional model linkage Required model linkage 19

20 Hands-on Session 20
21 Model Architecture Land Use Soils Climate Water Yield Model Evapotranspiration Water Yield 21
22 Model Architecture Land Use Soils Climate Water Yield Model Water yield water consumed = water available for hydropower Evapotranspiration Water Yield Consumptive Use Water Supply Water Scarcity Model 22
23 Model Architecture Land Use Soils Climate Water Yield Model Water yield water consumed = water available for hydropower Evapotranspiration Water Yield Price Turbine Efficiency Dam Height Consumptive Use Water Supply Hydropower and Valuation Model Water Scarcity Model Energy Energy Value 23


24 Model Inputs Climate Precipitation, Potential Evapotranspiration, Zhang Watersheds Main and sub-watersheds for point of interest Soils Soil depth, Plant Available Water Content Water demand Land Use/Land Cover Root depth, Evapotranspiration coefficient $$ Economic Hydropower plant data, price of energy 24
25 Equations Water Yield Water Yield is the water depth (volume) that is NOT Evapotranspired: WY = P AET It is the sum of Surface flow, subsurface flow and groundwater flow: WY = SR + SubSR + GW Model: WY = P * (1 AET / P ) E(t) P(t) Q(t) AET P x xj = ω R + ω R x x xj + xj 1 R xj where ω x R xj = Zhang = kc ETo P x AWC P x x x 25
26 Energy production and value Energy produced outflow Total value of hydropower produced Sub-basin value for power produced 26

27 Model Outputs Actual Evapotranspiration mm/year Water yield mm/year Water supply m 3 /year Used in valuation Energy/value for hydropower Kw/currency over timespan 27

28 Hands-on Session 28
29 Nutrient Retention Model Based on runoff and export coefficients Includes geomorphology and climate Nitrogen and phosphorus Potential export from a parcel Precipitation - Evapotranspiration = Runoff (water yield) 29
 Soil Erodibility (K) USLE = R x K x LS x C x P Crop factor (C) = potential")
30 Sediment Retention Model Based on the Universal Soil Loss Equation (USLE) Slope (LS) c Erosivity (R) Conservation Factor (P) Soil Erodibility (K) USLE = R x K x LS x C x P Crop factor (C) = potential export 30
31 Hydrologic Connectivity F low d ir e c t ion load (N/P/sed) Corn Forest export Wheat Forest retention St ream to reservoir 31
32 Valuation Based on avoided costs (treatment or dredging) Service Loading Critical Loading Time 32


33 Outputs - Nutrient Nutrient Exported Kg/year Nutrient Retained Kg/year Used in valuation Value of Nutrient Removal for Water Quality Currency over time period 33


34 Outputs - Sediment Potential Soil loss Calculated from USLE Tons/year Sediment Retained Tons/year Used in valuation Sediment Exported Tons/year Value of Sediment Removal for Water Quality/Dredging + Total export to reservoir Sediment retention Currency over time period 34 High Low
35 35

36 Habitat Quality: Model Overview Biodiversity is not treated as an ecosystem service per se Instead, it s used to assess overlaps and tradeoffs InVEST models habitat quality and rarity as indicators of the status of biodiversity Areas with high quality are generally better able to maintain biodiversity 36

37 Habitat Quality: Model Overview Habitat quality depends on: Suitability of the habitat for the species of interest Does it prefer grassland, open canopy forest or closed canopy forest? Proximity and intensity of threats Proximity: how far away is the threat? Intensity: how severe a threat is it? 37

38 Habitat Quality: Threats Degradation of habitat depends on: Distance between habitat and threat Relative weight of threat Are highways a greater threat than dirt roads? Sensitivity of habitat to the threat Is forest more sensitive to roads than a grassland would be? How quickly the impact decays with distance Accessibility / Protection status 38
39 Data needs REQUIRED Current LULC map Threat information table Threat maps Habitat information and sensitivity table Half-saturation constant value OPTIONAL Future LULC map Baseline LULC map Accessibility and/or protected areas map 39

40 Model Outputs Habitat quality Habitat degradation relative to rest of landscape Habitat quality relative to rest of landscape Habitat rarity relative to baseline 40
41 Ongoing Work: GLOBIO We implement GLOBIO s methodology with several improvements: Can be used with high-resolution, local data Assign LULC sub-classes with more precision Based on high-res data rather than continent-wide aggregates Improved fragmentation and infrastructure effects The model quickly (1-click) calculates MSA for thousands of possible scenarios Identify thresholds Python script only (no interface) 41

42 42

43 InVEST Carbon Storage Model Carbon stock as a function of land use/land cover Storage indicates the mass of carbon in an ecosystem at any given point in time. Sequestration indicates the change in carbon storage in an ecosystem over time. Valuation is applied to sequestration 43
 = Value 44")
44 InVEST Carbon Storage Model Climate Atmosphere Atmosphere Land use history Aboveground biomass Species Harvested Wood Products Dead wood Decay Soil carbon Soil type, moisture Microbes, chemistry Belowground biomass Land management 5 pools x f(cost/ton) = Value 44
45 Sequestration and Value 2008 Δ in C Future Value 2058 Net Present Value 45
46 Input Data Required data: Land use / land cover (LULC) map Table of carbon pools (metric tons / hectare) 46

47 Approach to Valuation Net Present Value is a function of: Market discount rate Rate of change in the social value of carbon Social or market cost of carbon Carbon model is most appropriate for valuing the Social cost of carbon: What is the benefit to society from avoiding damage from CO 2 release? 47
48 Output Map of current carbon storage (Mg C / cell) Map of future carbon storage - If future land use provided Carbon sequestration map = (future - present storage) Map of economic value of carbon sequestered 48
49 Thank You! Adrian Vogl Program Manager, Freshwater Services Natural Capital Project, Stanford University 49
50 Application How much impact will a proposed infrastructure project have on ecosystem services? Who will lose which services? 50


51 Servicesheds Serviceshed: area that provides a specific benefit to a specific group of people Supply Physical access Institutional access C A R B O N P O L L I N A T I O N W A T E R 51

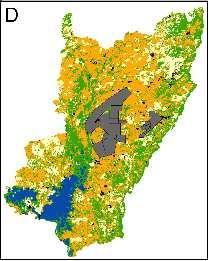
52 Proposed Road Lisa Mandle, Jerry Touval, Leandro Baumgarten, et al. 52
53 Beneficiaries 53


54 Services Towns as beneficiaries -ethnic groups tracked Carbon sequestration Drinking water quality regulation Nitrogen Phosphorus Sediment Wild product harvest 54
55 Who Will Lose Which Services? Carbon Loss Un-impacted city Impacted city 55

56 Who Will Lose Which Services? Carbon Loss Un-impacted city Impacted city Erosion Control Loss 56
57 Who Loses After Mitigation? All People (235,038) Erosion Control Nitrogen Regulation Phosphorus Regulation Carbon Sequestration 57
58 Who Loses After Mitigation? Indigenous People (15,344) Non-Indigenous People (219,694) All People (235,038) Erosion Control Nitrogen Regulation Phosphorus Regulation Carbon Sequestration 58


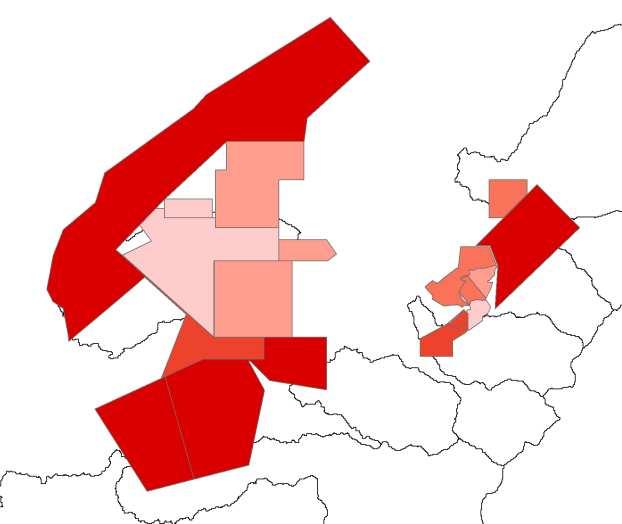
59 Which Permits Have the Most Impact? Population-scaled Impact High Low 59

60 Ongoing Work Application in Indonesia with Millennium Challenge Corporation and Rockefeller Foundation Application with Colombian Ministry of Environment, simple online tool for all sectors Aligning with biodiversity approach 60

61 Application Predicted water yield change , HADCM climate change model 61
62 Application Predicted per capita water yield change , HADCM climate change model 62