Ditches for Energy Efficiency and Improved Nitrogen Removal
|
|
|
- Priscilla Barber
- 5 years ago
- Views:
Transcription

1 Upgrade of the Big Gulch WWTP Oxidation Ditches for Energy Efficiency and Improved Nitrogen Removal Thomas G. Authors: Thomas E. Coleman, dtec Systems Bridges, Mukilteo Water & Wastewater District Bend, Oregon October 24-27, 2010 Mukilteo Water & Wastewater District
2 Introduction In 2008 and 2009 the Mukilteo Water and Wastewater District undertook a two phased project to upgrade the Big Gulch WWTP oxidation ditches. The project goals included: Improve oxidation ditch loading capacity Reduce aeration energy costs Increase nitrogen removal efficiency 2

3 Mukilteo Location Map 3

4 Big Gulch WWTF 4

5 Big Gulch WWTF Location 5
6 Olympus Terrace/Big Gulch WWTF History The original plant, built in 1970, included coarse bar screening of influent wastewater one 639,800 gallon oxidation ditch with two 40 HP brush rotor aerators one 58 foot diameter secondary clarifier, two 36 inch diameter screw pumps for RAS pumping chlorine injection equipment with no chlorine contact tanks There were no provisions for handling waste activated sludge. 6
7 Olympus Terrace/Big Gulch WWTF Upgrades The first upgrade was completed in 1984 of a 54 foot diameter secondary clarifier with the addition A major upgrade completed in 1989 included: A new headworks with grit removal A 1.07 million gallon oxidation ditch with four 30 HP brush rotor aerators One 54 foot diameter secondary clarifier, Aerobic Digesters, sludge pumping facilities, and dewatering equipment Chlorine contact tanks In 1993 In 2002 a submersible mixer was added to each ditch the plant converted from chlorine to UV disinfection 7
8 Big Gulch WWTF Layout 8

9 Big Gulch WWTF Aerial view 9

10 Big Gulch WWTF Neighbors 10
11 Design Criteria in the NPDES permit issued in November 2004 Average flow for the max. month: BOD5 loading for max. month: TSS loading for max. month: 2.61 MGD 4492 lbs/day 3605 lbs/day This permit expired in November 2009 and has not yet been reissued. 11


12 Influent Loading Data
13 Capacity Study and Engineering Report (Gray & Osborne, March 2008) Influent Loading Trends at MWWD Loading Rate (lbs/day) 10,000 8,000 6,000 4,000 2, Average Annual BOD5 Maximum Monthly BOD5 Average Annual TSS Maximum Monthly TSS 13
14 Capacity Study and Engineering Report Findings: Intermittent soluble BOD loading spikes in 2006 * New sampler revealed TSS loadings much higher than previously measured Long term trend of increasing loading rates Intermittent * soluble BOD and TSS loading spikes have continued to the present time (October 2010). 14
15 Capacity Study and Engineering Report Report Recommendations: Loading source investigations in collection system Grit removal improvements Activated sludge aeration capacity expansion Aerobic digester aeration capacity expansion 15
16 Activated sludge aeration capacity expansion Aeration system capacity determined to be a limiting factor in establishing the BOD design capacity. Evaluation of aeration system capacity upgrade alternatives: Upgrade brush rotor aeration system Replace rotors with diffusers and PD blowers Replace rotors with diffusers and turbo blowers 16
17 Evaluation of aeration system capacity upgrade alternatives The evaluation of aeration system alternatives considered capital and O&M costs. Incentives payments available from the utility (Snohomish PUD) for improvements which reduce electrical energy consumption and demand. Other operational factors also considered. 17
18 Energy Costs at a WWTP Aeration accounts for 50-75% of the total energy cost at a municipal wastewater treatment plant. Aeration Lighting Pumping HVAC Misc. 18
19 Comparison of Aeration Alternatives Oxidation Ditch A peak energy consumption Parameter Brush Rotors Aeration Method Diffused Aeration with PD Blower Diffused Aeration with Turbo Blower Actual Oxygen Demand (lb/day) 4,527 4,527 4,527 Standard Oxygen Demand (lb/day) 6,658 7,611 7,611 Diffuser Air Flow Rate (scfm) N/A 1,300 1,300 Max. Motor Power (hp) Max. Motor Power (kw) Power Savings at Max. Load vs. Brush Rotor (%) 48% 57% Power Savings at Max. Load vs. PD Blower (%) 17% 19
20 Comparison of Aeration Alternatives Oxidation Ditch A annual avg. energy consumption Parameter Brush Rotors Aeration Method Diffused Diffused Aeration Aeration with with Turbo PD Blower Blower Actual Oxygen Demand (lb/day) 2,440 2,440 2,440 Diffuser Air Flow Rate (scfm) N/A Average motor power req'd (hp) Avg. Annual Power Consumption (kwh) 380, , ,000 Annual Power Savings (kwh) 197, ,000 Annual Power Cost Savings ($) $13,800 $17,000 Annual Power Savings vs. brush rotor (%) 52% 64% Annual Power Savings vs. PD blower (%) 25% 20
21 Comparison of Aeration Alternatives Oxidation Ditch A annual O&M costs Item Quantity Unit Price Amount A. Brush Rotor Alternative Power 380,000 kwh $0.07 $26,600 Repair and Maintenance 1 LS $2,300 $2,300 Total $28,900 B. Diffused Air with PD Blower Alternative Power 183,000 kwh $0.07 $12,800 Repair and Maintenance 1 LS $2,100 $2,100 Total $14,900 C. Diffused Air with Turbo Blower Alternative Power 137,000 kwh $0.07 $9,600 Repair and Maintenance 1 LS $1,800 $1,800 Total $11,400 21
22 Comparison of Aeration Alternatives Oxidation Ditch A lifecycle cost comparison Alternative Total Construction Cost Annual O&M Cost Estimate 20-year Net Present Value Brush Rotor Alternative $261,000 $28,900 $808,000 Diffused Air with PD Blower Alternative $279,000 $14,900 $507,000 Diffused Air with Turbo Blower Alternative $321,000 $11,400 $490,000 22
23 Operational Considerations Operational Considerations Brush Aerators Brush Rotor Aeration Pros and Cons Pros Simple In-House Repair Submersible Mixer Not Needed Cons Fixed Hydraulic Level Damages Floc Structure Lubrication Required Create Aerosols Energy inefficient Difficult to Control D.O. Noise 23
24 Operational Considerations Turbo Diffused Blower Aeration With Pros Fine and Cons Bubble Pros Hydraulic Level can vary Diffusers Cons Needs Submersible Mixer No Shearing of Floc No Lubrication Required Minimal Maintenance Minimal Aerosols Proprietary Blower Technology* Diffuser Inspection/Repair Requires Dewatering of Basin *(in the case of Turbo Blowers) Energy Efficient Good D.O. Control Low Noise 24
25 Comparison of Aeration Alternatives Selected alternative: Diffused air with turbo blower Despite higher capital cost, energy efficiency resulted in a payback period of 4 years Lowest 20 year lifecycle costs (3% lower than PD blower) 65% energy savings compared to brush rotors 25% energy savings compared to PD blower 25

26 Turbo Blower Technology Single stage centrifugal blower with integrated high frequency VFD 26

27 Turbo Blower Cutaway View Image courtesy of K-Turbo Inc. Impeller directly mounted on motor shaft High-speed permanent magnet motor (up to 24,000 rpm) 27

28 Turbo Blower Air Foil Bearing Image from: 28
29 Turbo Blower Features Reduced maintenance: no maintenance required for seals, lubrication, etc. Low power at motor start Can run unloaded at 1% of rated power 29
30 Phase I Project Convert Oxidation Ditch A from brush rotor aeration to diffused aeration with a Turbo Blower 30

31 Demolition/Removal of Old Equipment Installation of Blower & Diffusers 31

32 Install Turbo Blower Installation of Blower & Diffusers 32

33 Front View of Turbo Blower 33

34 New diffusers in place in Ditch A 34

35 Oxidation Ditch A after upgrade 35
36 Electric utility rebate Snohomish County PUD No. 1 monitored electricity consumption before and after Ditch A project construction Rebate for construction costs equal of $0.17/kWH of annual electricity savings District received SNOPUD Incentive Rebate of $39,171 for Phase 1 36
37 Phase II Conversion of Ditch B Phase II of the project converted Oxidation Ditch B to diffused air with turbo blowers 35% reduction in annual energy consumption were estimated for the oxidation ditch system 37
38 Ditch B Conversion Energy Savings 38
39 Conversion of Ditch B Removal of four 30 hp brush rotors (120 hp total) Installation of two additional 50 hp turbo blowers (one duty, one standby) Installation of two new 6 hp submersible mixers Equipment was pre purchased Construction completed in March

40 Brush Rotors in Ditch B before upgrade 40

41 Conversion of Ditch B 41
42 Phase 2 Baseline Metering 42
43 Phase 2 Post Metering Results 43
44 Combined Results from Phase 1 and Phase 2 Before After 44
45 dnox System for Improved Denitrification Originally developed under an EPA Small Business Innovation Research (SBIR) Project at the Grand Coulee, WA WWTP. Patent # 5,582,734 process for oxidation ditch control Inventors: Coleman, Stensel, Denham, and Fleischman
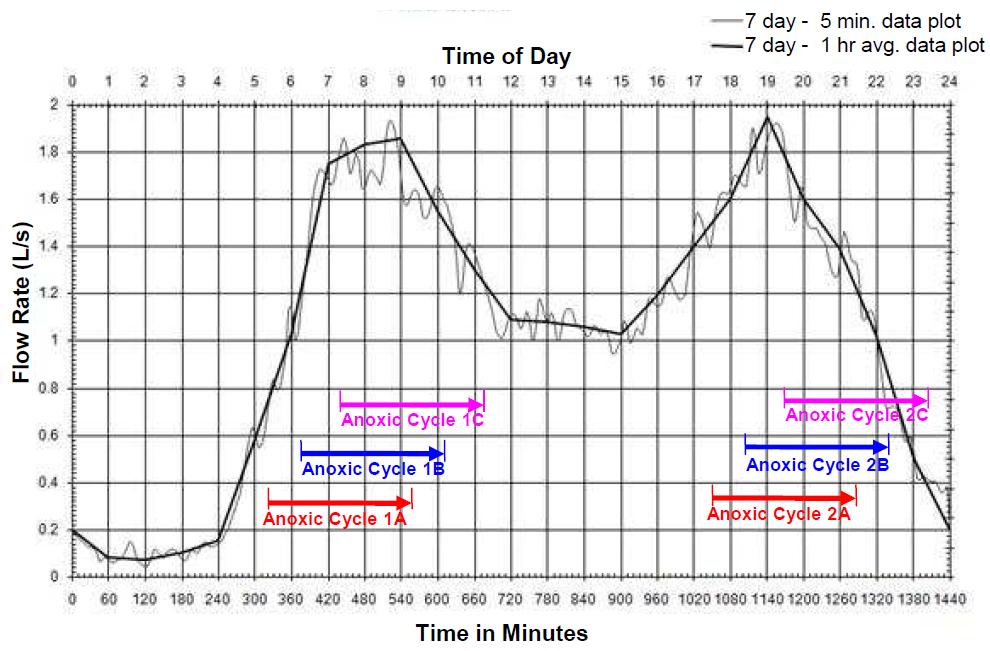
46 Process Flow Schematic for Oxidation Ditch with Cyclic Aerobic/Anoxic Operation WSEO funded mixer installations in the early 1990s. WAS The automated anoxic cycle control system was developed during the mid 1990s under an EPA SBIR research contract. The GC/EC WWTP has consistently achieved energy savings, good total nitrogen removal, and SVI control for over 15 years. 46
47 dnox System Description Detects ORP inflection point = reliable detection of nitrate/nitrite depletion in activated sludge processes Provides automated aeration control for oxidation ditches and other wastewater treatment processes such as SBRs and Aerobic Digesters
48 Nitrification Fundamentals Ammonia Oxidizing Bacteria (AOB) 2NH + + 3O 2NO H + + 2H O (Eq. 1) 2 Nitrite Oxidizing Bacteria (NOB) 2NO 2 + O 2 2NO 3 (Equation 2) Overall Reaction NH O 2 NO 3 + 2H + + H 2 O ~ 4.6 lb of O 2 required per lb of NH 3 -N oxidized 48
49 Denitrification NO 3 NO 2 NO N 2 O N 2 C 6 H 12 O NO H + 6CO N H 2 O ~ 2.9 lb of O 2 equivalent per lb of NO 3 -N reduced 49
50 ORP mv DO, NO3 -, NH3 + mg/l 50

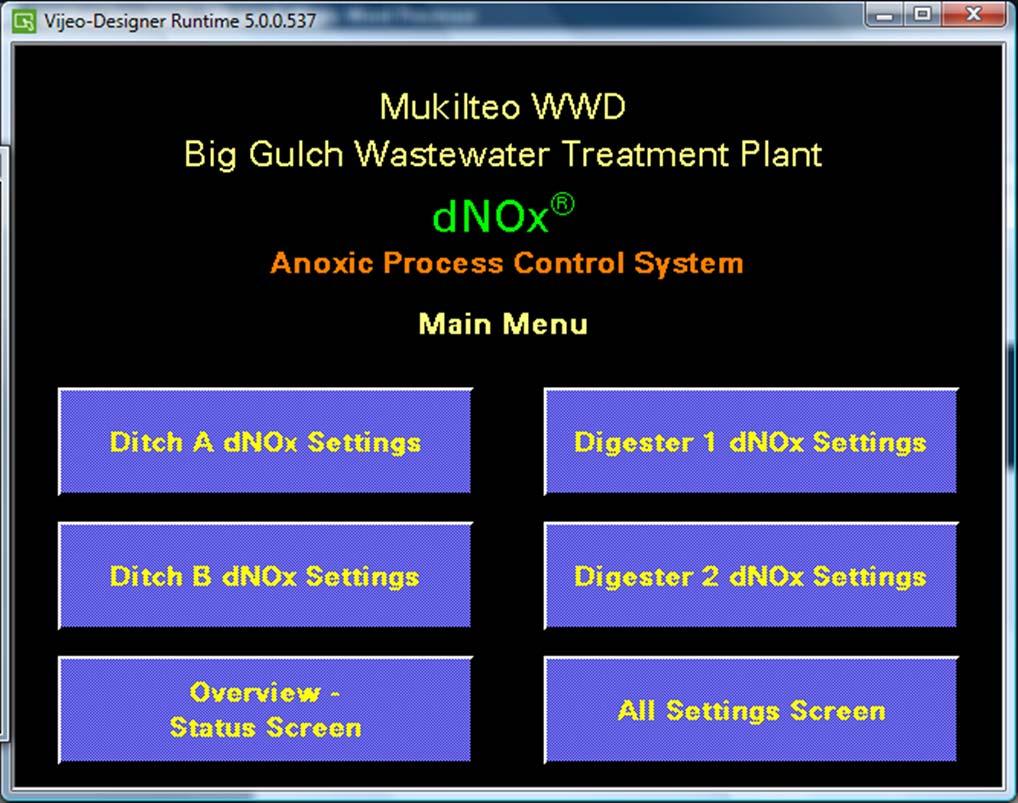
51 dnox Anoxic Control Panel _ 51
52 dnox Process Control Algorithm dnox control system algorithms utilizes IEC Compliant Structured Text and Function block diagrams The Structured Text uses a syntax similar to the Pascal programming language 52
53

54

55
56 dnox System Benefits Energy savings Reliable effluent nitrogen as low as 5 mg/l Quick installation, very little maintenance Fully automatic nitrification/denitrification cycles control Compatible with multiple wastewater processes Improved sludge settling Selective pressure against filamentous bacteria growth Alkalinity recovery
57 Nitrogen removal at Big Gulch During the first 6 months of operation using the dnox system to control anoxic/aerobic cycling in the oxidation ditches, a number of operational strategies have been evaluated. Currently the process has been optimized to consistently achieve less than 5 mg/l total inorganic nitrogen. 57
58 Next Phase of Improvements at the Big Gulch WWTF The next phase of improvements at the Big Gulch WWTF will include the upgrade of screening and grit removal at the Headworks and increasing the aeration capacity of the Aerobic Digester. A Selector Basin is also being designed into the Headworks upgrade. Depending on the amount of nitrate being returned to the selector it could be anoxic or anaerobic. If anaerobic, we can expect EBPR to occur. 58
59 Process Flow Schematic of Heyburn, ID WWTP (Recently upgraded to meet new P limits for discharge to the Snake River) WAS 59
")
60 Heyburn,ID WWTP (Bio-P removal) 60
61 Conclusions Blowers and diffused air may be advantageous for oxidation ditch operation: Significant energy savings Operational flexibility Turbo blowers may offer further energy savings in comparison with positive displacement blowers. An ORP based control system optimizing aerobic/anoxic cycling in an oxidation ditch can achieve additional energy savings and improved total nitrogen removal. 61

62 62
63 63
64 Electric utility rebate Pre Metering Results: Ditch A Week 2 Rotor 1 64

65 Electric utility rebate Pre Metering Results: Ditch A Week 2 Rotor 2 65

66 Electric utility rebate Post Metering Results: Ditch A Blower 66