Cascades to Coast GK12 Curriculum
|
|
|
- Charlene Richardson
- 5 years ago
- Views:
Transcription


1 Cascades to Coast GK12 Curriculum Chinook Salmon: A Columbia River Keystone Species Fellow: Gina Marchini Teacher: Paul Hanson (Liberty High School) Advisor: Mitch Cruzan Essential Question: How does removal of a keystone species influence community structure and population dynamics of co-occurring species? Learning Goals: Simulate a food chain to investigate how a keystone species such as the Chinook salmon (scientific name: Oncorhynchus tshawytscha) influence community structure. Learning Objectives: -Students will simulate a food chain of individuals of Chinook salmon and species from other tropic groups that inhabit the same communities as Chinook salmon -They will learn that removal of a keystone species can cause wild population fluctuations Target Grades: 9 th grade biology, 10 th grade honors biology Required Knowledge/Skills: To be completed during the ecology unit after students have been taught basic population dynamics. Can precede a trip to Tillamook Forest to observe spawning salmon. Activity Plan: Can be completed in one minute class period. Applicable Next Generation Science Standards: HS-LS2-2. Use mathematical representations to support and revise explanations based on evidence about factors affecting biodiversity and populations in ecosystems of different scales. HS-LS2-6. Evaluate the claims, evidence, and reasoning that the complex interactions in ecosystems maintain relatively consistent numbers and types of organisms in stable conditions, but changing conditions may result in a new ecosystem. Activity Materials:
2 Plastic or small paper bags Poker chips Stopwatch or watch with a second hand Life cards (Pictures of organisms) Vocabulary Terms: Keystone species- A species whose loss from an ecosystem would cause a greater than average change in diversity or abundance of other species, community structure, and/or ecosystem processes. Community- A group of interdependent organisms of different species growing or living together in a specified habitat. Trophic group- A position in a food chain or web occupied by a group of organisms with a similar feeding mode. Trophic groups for this activity Top Predator: Orca/Human Fisherman Tertiary Consumer: Chinook Salmon Secondary Consumer: Pacific Sand Lance Primary Consumer: Zooplankton Producer: Phytoplankton Procedure: 1. The teachers will divide class into four trophic groups. There will be 1 Orca, 3 Chinook Salmon, 9 Pacific Sand Lances, and everyone else will be a Zooplankton. The students in each trophic will each be given a species name tag that is their Life Card. 2. If weather allows, go outside to complete the rest of the activity! 3. Each student will each receive a food bag. Tell the students that they are going to imagine that the area where the poker chips are distributed as Liberty (or name of your choosing) River, the habitat in which they as organisms live. The poker chips represent phytoplankton, which have become abundant in the bright sunshine. Recently hatched, the Zooplankton are ravenous consumers of Phytoplankton (the poker chips). In our food chain, Zooplankton are the only ones that can eat Phytoplankton. 4. Each trophic level will now have 20 seconds to feed. The Zooplankton will feed on the Phytoplankton (the poker chips). The other trophic levels will feed by collecting Life Cards of the organisms they are feeding on.
3 5. Feeding will occur in the following order: Zooplankton -> Pacific Sand Lance -> Chinook Salmon -> Orca. Teachers will hold a timer and give you students instructions on when to start feeding so that it is sychronized. 6. After feeding has occurred, students will count the number of organisms eaten at each trophic level. Have them record this in a table in their notebooks. Figure out how many organisms of each species are still alive by subtracting the number eaten from the number of each species that we begin with. Students will give this table the title: Table 1: Chinook Salmon Keystone Species. Species Zooplankton Pacific Sand Lance Chinook Salmon Orca Starting # of Individuals # of Organisms Eaten # of Organisms Left 7. Now have the students start their second simulation. In this simulation, overfishing by human predators has resulted in the Chinook salmon going extinct. Assign the students who were Chinook salmon new Life Cards as different species. 8. Repeat steps 5 and 6 for our new simulation. Students will label the new table that they create for this simulation with Table 2: Chinook Salmon Absent Generation 1. Questions Have students answer the following questions in their lab notebooks: 1. Is a keystone species the species that is the top predator in an area? 2. How did the absence of Chinook Salmon affect the number of Pacific Sand Lances? 3. What do you expect to happen to the number of zooplankton if Chinook Salmon go extinct and why? Online Sources for More Information: Fish/Chinook-Salmon.aspx Species Life Cards (print and cut out to give to students)
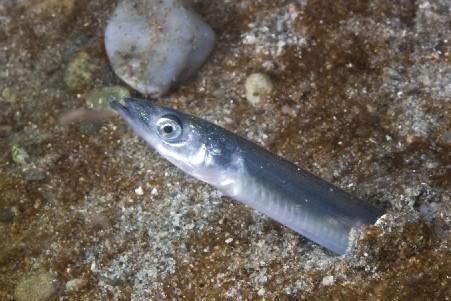

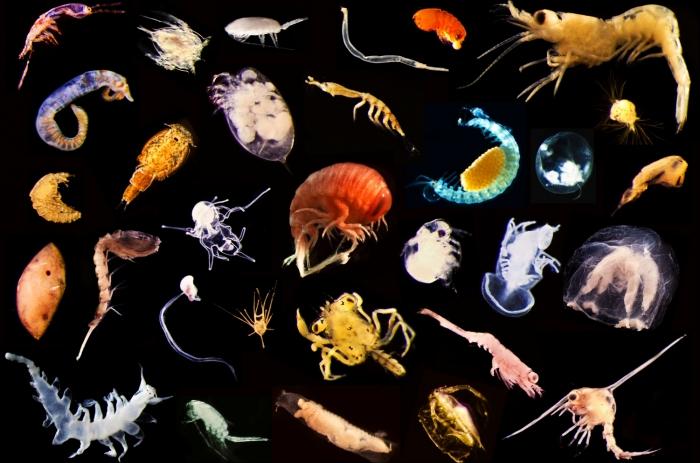
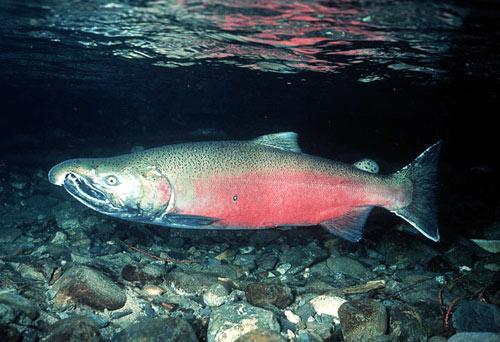
4 Phytoplankton Zooplankton Pacific Sand Lance Chinook Salmon
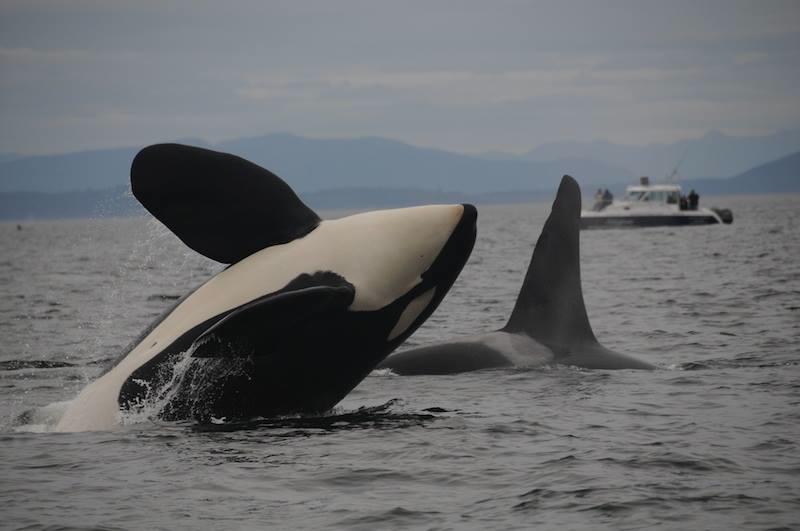
5 Orca