Seawater Air Conditioning for Hawaii
|
|
|
- Geoffrey Malone
- 5 years ago
- Views:
Transcription
1 Seawater Air Conditioning for Hawaii David Rezachek, Ph.D., P.E. Associate Development Director Honolulu Seawater Air Conditioning LLC Hawaii Energy Policy Forum (HEPF) October 25,
2 Presentation Overview Seawater Air Conditioning for Hawaii What It Is Why Its Needed Benefits of SWAC Where We Are How HEPF Can Help 2

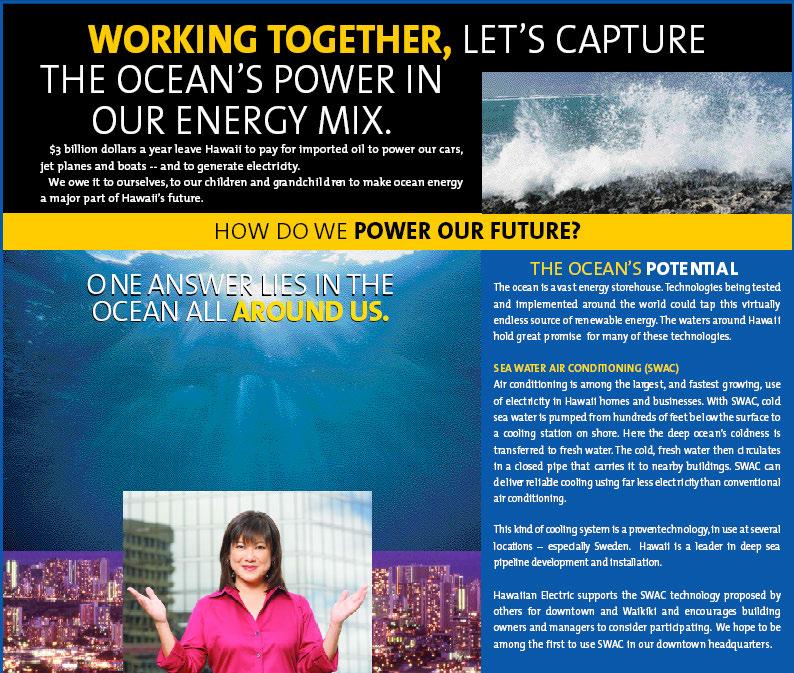
3 What is SWAC? 3
4 4
5 Why Its Needed - A Solution To Oahu s s Energy Crisis A Proactive Response to Energy Crises Reduces Need for New Fossil Fuel Generation Capacity Uses Renewable Energy Reduces Hawaii s s Dependence on Oil Reduces Fossil Fuel Air Emissions Saves Potable Water and Reduces Sewage Generation Provides Local Economic Development Benefits 5
6 Current Energy Crises World Oil Crisis Reserve Electricity Generation Capacity Crisis on Oahu Crisis for Hawaii s s Energy Users 6
7 World Oil Crisis Increasing Demand Demand Increasing Faster Than Production Excess Production Capacity at Record Lows New Discoveries Not Keeping Up With Demand Growth Supply Disruptions Due to Geopolitical Events Fears of Terrorism Weather Speculation 7
8 Increasing Demand Global Demand Now 84 Mbbl/d Nearly 1,000 Bbl/sec 30 Billion Bbl/yr Global Demand Increasing by 2%/yr >60% increase by 2030 China ~ 7%/yr; India ~30% over 5 yr 8
9 Demand Increasing Faster Than Production After Peak, Production Declines 3 to 6%/yr 54 of 65 Largest Producers Past Peak 5 More to Peak in Next Six Years U.S. Peak Lower 48 in 1970 Alaska in Late 1980 s World Peak
10 Excess Production Capacity at Record Lows 2006 ~ 1Mbbl/d ~ 1% of Demand Major Producers Already Pumping as Fast as They Can 10
11 New Discoveries Not Keeping Up With Demand Growth U.S. (Lower 48) Discovery Peak 1930 s Global Discovery Peak 1960 s 1960 s 47 Bbbls/yr 1970 s 35 Bbbls/yr 1980 s 24 Bbbls/yr 1990 s 14 Bbbls/yr Recent 4 Bbbls/yr Profits Going to Acquisitions and Shareholders NOT to Exploration 11
12 Supply Disruptions Due to Geopolitical Events Many Trouble Spots Many Are Major Oil Producers Venezuela; Russia; Nigeria; Saudi Arabia; Iran; Iraq; Wars Over Oil in Past Likely in Future 12
13 Fears of Terrorism Attacks on Oil Personnel and Facilities Nigeria; Saudi Arabia; Iraq Terror Premium = $5 to $7/Bbl (Some say much more) 13
14 Weather Gulf of Mexico Source of Much of U.S. Oil Site of Significant Refinery Capacity Record Number of Hurricanes in 2005 Likely to Increase With Global Warming Supply Disruptions Hurricane Ivan Hurricane Katrina 14
15 Speculation Yes Of Course Something Other Than Production Costs Average World Wide Production Costs - $5/Bbl OPEC - $1.50/Bbl Current Price ~$60 Oil Prices Convey the Market s s Evaluation of Scarcity Oil Becoming Scarcer and More Valuable 15
16 Bottom Line High Oil Prices are Here to Stay Much Higher Prices are Likely in the Future 16
17 Reserve Electricity Generation Capacity Crisis on Oahu HECO Has a Reserve Capacity Crisis Next Power Plant 2009 (at the Earliest) Opposition and Permitting May Delay This What Can We Do? 17
18 Crisis for Energy Users Increased oil costs leading to increased electricity prices Increased energy costs mean less for other needs 18
19 LSFO Prices - Historical Prices and Price Trends ( ) $300 Low Sulfur Fuel Oil (LSFO) Price ($/bbl) $250 $200 $150 $100 $50 $ Year HREA LSFO Nominal Price Trend HECO High LSFO Nominal Price Trend HECO Reference LSFO Nominal Price HECO Low LSFO Nominal Price Trend 19
20 HECO Commercial Electricity - Historical Rates and Trends ( ) $0.50 Commercial Electricity Cost ($/kwh) $0.45 $0.40 $0.35 $0.30 $0.25 $0.20 $0.15 $0.10 $0.05 $ Year HECO Commercial Electricity Rate (HSWAC LSFO Price Trend) HECO Commercial Electricity Rate (Reference LSFO Price) HECO Commercial Electricity Rate (High LSFO Price) HECO Commercial Electricity Rate (Low LSFO Price) 20
21 Benefits of SWAC to Hawaii Demand Side Benefits Increased Use of Renewable Energy Environmental Benefits Economic Development 21
22 Demand Side Benefits Reduces Need for New (Likely-to to-be-fossil- fueled) Generation Capacity 100,000 tons of SWAC will Displace Up to 63 megawatts of New Generation Equal to 86,000 Solar Water Heating Systems Equal to ~4 years of HECO s s Load Growth 22
23 Demand Side Benefits (cont d) Each ton of SWAC eliminates the need for more than 3,400 kwh/year of energy use 100,000 tons of SWAC will save 344 million kwh/year Equal to more than 123,000 residential solar water heating systems. 23
24 HECO s s Total DSM Program Costs With and Without SWAC Case Net Present Value of Total Program Costs Net System Energy Savings Net System Peak Demand Savings Net Present Value Cost Units million $ million kwh MW $/kwh $/kw HECO s Baseline DSM HECO s Baseline DSM + 25,000 tons of SWAC HECO s Baseline DSM + 100,000 tons of SWAC
25 Marginal Costs of Adding SWAC to HECO s s DSM Programs Case Increase in Net Present Value of Total Program Costs Increase in Net System Energy Savings Increase in Net System Peak Demand Savings Marginal Cost Units million $ million kwh MW $/kwh $/kw HECO s Baseline DSM + 25,000 tons of SWAC 7.4 (+3.4%) 45.9 (+8.2%) 6.7 (+4.2%) HECO s Baseline DSM + 100,000 tons of SWAC 18.9 (+8.5%) (+37.3%) 26.7 (+16.9%)
26 Increased Use of Renewable Energy Uses an Abundant, Indigenous, Renewable Energy Resource 22 billion year supply Helps Meet Renewable Portfolio Standard (RPS) Requirements 26
27 Increased Use of Renewable Energy (cont d) 100,000 Tons of SWAC Will Provide Renewable Energy Benefits Equal to: 187 MW of Photovoltaics 123 MW of Wind 60 MW of MSW Combustion 27
28 Renewable Energy Development Near-Term (0 (0 5 years) ( ) Solar Thermal (Water Heating/Process Heat) Wind SWAC Biomass (MSW & Co-Firing? & Biofuels?) Mid-Term (5 (5 10 years) ( ) Wave Residential Utility-Intertied PV on Neighbor Islands Commercial-Scale PV OTEC (5 10 MW module) Long-Term (10 ( years) ( ) OTEC (100 MW) Residential Utility-Intertied PV on Oahu Utility-Scale PV? 28
29 Learning Curve Analysis for Residential Photovoltaics on Kauai $0.70 Cost of Energy ($/kwh) $0.60 $0.50 $0.40 $0.30 $0.20 $ Year Lowest Cost of Energy Mid-Range Cost of Energy Highest Cost of Energy Lowest Avoided Cost Mid-Range Avoided Cost Highest Avoided Cost 29
30 Learning Curve Analysis for Commercial-Scale Photovoltiacs on Oahu $0.40 Cost of Energy ($/kwh) $0.35 $0.30 $0.25 $0.20 $0.15 $ Year Lowest Cost of Energy Mid-Range Cost of Energy Highest Cost of Energy Lowest Avoided Cost Mid-Range Avoided Cost Highest Avoided Cost 30
31 SWAC s Impact on Hawaii s s RPS Renewable Energy Potential on Oahu Projected for 2020 SWAC provides one-sixth of the 20 percent renewable energy requirement of the Oahu RPS Solar Thermal Photovoltaic Wind Wave OTEC Seawater Air Conditioning MWS + Biomass Co-firing 31
32 Renewable Energy Potential on Oahu 32
33 Environmental Benefits of SWAC Reduces the Annual Use of Imported Fossil Fuels by More Than 777,000 Barrels Reduces Associated Power Plant Emissions 33
34 Environmental Benefits of SWAC (cont d) Eliminates Cooling Towers Reduces Potable Water Use 1.3 billion gallons per year Reduces Sewage Generation 500 million gallons per year Eliminates Need for Water Treatment Chemicals 34
35 Local Economic Development Benefits Will Generate Millions Of Dollars In Construction Project Spending Long-term, Well-paid Jobs Also Created Local Economic Development Benefits Accrue from Money that Stays in Hawaii, and Not Used to Purchase Oil 35
36 Where We Are Significant Progress Has Been Made System Design Environmental Impact Assessment and Permitting Financing Customer Marketing Projected Startup Date Early
37 How HEPF Can Help Incorporate SWAC Into State Energy Planning Assist in Public Education Efforts Support SWAC-Related Legislation Special Purpose Revenue Bonds Inclusion in Enterprise Zones Non-Exclusive Franchise/Easements Priority Processing of State Permits 37

38 Aloha! 38