Use of Reasonable Assurance Plans as Alternatives to TMDLs. Florida Stormwater Association Winter 2017 Meeting 6 December 2017
|
|
|
- Shona Reed
- 5 years ago
- Views:
Transcription
1 Use of Reasonable Assurance Plans as Alternatives to TMDLs Florida Stormwater Association Winter 2017 Meeting 6 December 2017


2 Presentations by: Tony Janicki Julie Espy Tiffany Busby Judy Grim Brett Cunningham

3 Florida Reasonable Assurance Plans Julie Espy Florida Department of Environmental Protection Florida Stormwater Association Winter 2017 Meeting 6 December 2017
4 Florida s Requirements Section 303(d) of the Federal CWA Florida statute established the Florida Watershed Restoration Act in 1999 Surface Water Quality Standards Rule , F A.C. Impaired Waters Rule (IWR) , F.A.C.

5 Watershed Management Approach

6
7 Waterbody Identification Number - WBID Assessment Unit (waterbody) Blue Lake WBID Boundary Line for the stream WBID Assessment Unit (waterbody) and WBID line for lake WBID
8 Assessment Category Descriptions Category 1 - Attaining all designated uses Category 2 - Not impaired and no TMDL is needed Category 3 - Insufficient data to verify impairment (3a, 3b, 3c) Category 4 - Sufficient data to verify impairment, no TMDL is needed because: 4a A TMDL has already been done 4b Existing or proposed measures will attain water quality standards; Reasonable Assurance 4c Impairment is not caused by a pollutant, natural conditions 4d No causative pollutant has been identified for DO or Biology 4e On-going restoration activities are underway to improve/restore the waterbody Category 5 - Verified impaired and a TMDL is required
9 Descriptions of the Lists Planning list used to plan for monitoring Study List need additional study or information Master list includes ALL assessments for every waterbody Verified list impaired waterbodies, need a TMDL Delist list waterbodies that do NOT need a TMDL 303(d) list kept by EPA as the sum total of all waterbodies that do not meet surface water quality standards and/or designated uses
10 Pathways to Restoration Set Water Quality Standards Implement Restoration Monitor Water Quality TMDL development DEP BMAP implementation DEP Set Restoration Goals Assess Water Quality Reasonable Assurance Plan (4b) Stakeholders (temporary) Source Reduction Plan (4e) Stakeholders
11 DEP Watershed Restoration Process Assessment of Waters TMDL Development for Waters Verified as Impaired 1 year + for priority waters 5-10 years for others Development of Basin Management Action Plan (BMAP) 1-3 years Implementation of TMDL through BMAP 1-10 years +
12 Restoration Alternatives Two types of Restoration Alternative Plans 1) Reasonable Assurance Plan Assessment category 4b Not placed on the 303(d) list 2) Pollutant Reduction Plans Assessment category 4e Included on 303(d) list These plans are addressed in the Impaired Waters Rule in section , F.A.C.
13 Benefits of an Alternative Restoration Plan Provides a faster path to restoration Allows stakeholders to control their destiny Developing a plan prior to state or federal action provides the be way for stakeholders to plan for efficient and effective management Avoid TMDL-related regulatory requirements Acknowledges proactive efforts Stakeholders receive credit for pollutant reductions Benefits to downstream impaired waters Provides time for good targets to be developed Enhances public relations
14 Reasonable Assurance Plans Basic Requirements: Description of Impaired Waterbody Description of Water Quality or Aquatic Ecological Goals The water quality based targets or aquatic ecological goals (both interim and final) that have been established for the pollutant(s) of concern. Description of Proposed Management Actions To Be Undertaken Schedule for restoration projects, including funding sources Description of Procedures for Monitoring and Reporting Results Description of and Commitment to Proposed Corrective Actions
15 Reasonable Assurance Plans Reasonable Assurance plans (4b) provide an implementation schedule and resource commitments that there are, or will be, pollutant loading reductions that will result in the waterbody achieving water quality targets to attain and maintain the designated use. Main inclusions in a Reasonable Assurance Plan: a restoration target (e.g. water quality, pollutant load) a list of projects and/or activities that will achieve the restoration target an implementation schedule that can span multiple years funding commitments requires EPA approval
16 Tampa Bay RAP Tony Janicki Janicki Environmental Florida Stormwater Association Winter 2017 Meeting 6 December 2017


17 Tampa Bay - Fast Facts Florida s largest openwater estuary Open water: 400 sq miles Watershed: 2,600 sq miles Average water depth: 12 feet Population: > 3 million

18 Troubled Waters Half of Tampa Bay seagrasses lost by 1982 Half of Tampa Bay s natural shoreline altered 40% of tidal marshes destroyed White ibis populations plummeted by 70% Visibility reduced to 2 feet Fish kills common

19 A "poster child for polluted waters 60 Minutes segment brought national attention Poorly treated sewage Unrestricted dredging and filling Untreated stormwater runoff and industrial discharges

20 Citizens demanded action In 1978, State legislation required upgrades to all wastewater treatment plants By 1981, 90% reduction in nitrogen loading from treatment plants discharging to bay
21 The beginning of Tampa Bay s Collaborative Approach Public sector realized that nitrogen management goals were unattainable without private sector help. Private sector invited to participate with the public sector in the voluntary Nitrogen Management Consortium. Each partner contributed to nitrogen management goal as they were able - no requirements or allocations

22 The beginning of Tampa Bay s Collaborative Approach Public sector realized that nitrogen management goals were unattainable without private sector help. Private sector invited to participate with the public sector in the voluntary Nitrogen Management Consortium. Each partner contributed to nitrogen management goal as they were able - no requirements or allocations
23 Key Decision: Collaborative Management Strategy Consortium participants willing to work together to develop voluntary allocations (caps) for nitrogen loads, for agencies consideration. Decided they wanted to drive the bus
24 What s this about a TMDL DEP proposed a TMDL for Tampa Bay that was eventually adopted by EPA The voluntary TN load reductions morphed into this TMDL DEP recognized the work of the TBNMC and together created a mechanism that built on voluntary efforts DEP required TBNMC to provide reasonable assurance that the load reductions and water quality targets would be met That mechanism lead to the first Reasonable Assurance Plan
25 Tampa Bay RAP This RAP was developed by the Tampa Bay Estuary Program and members of the Tampa Bay Nitrogen Management Consortium in cooperation with EPA, DEP - accepted in 2002 The plan provided supporting documentation for site-specific alternative chlorophyll-a thresholds Since 2010, updates submitted to the Department that demonstrated that there has been reasonable progress towards attaining the designated uses of waterbody segments within the Tampa Bay

26 Adopted RAPs & DEP Support for New RAPs Tiffany Busby Wildwood Consulting Florida Stormwater Association Winter 2017 Meeting 6 December 2017
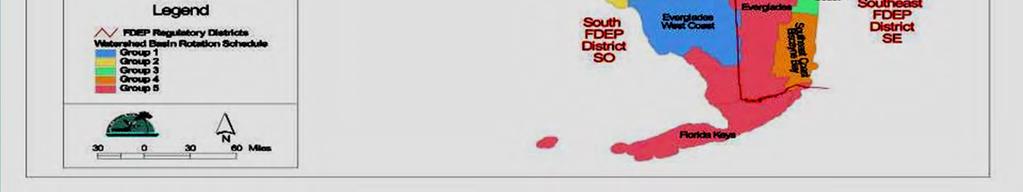
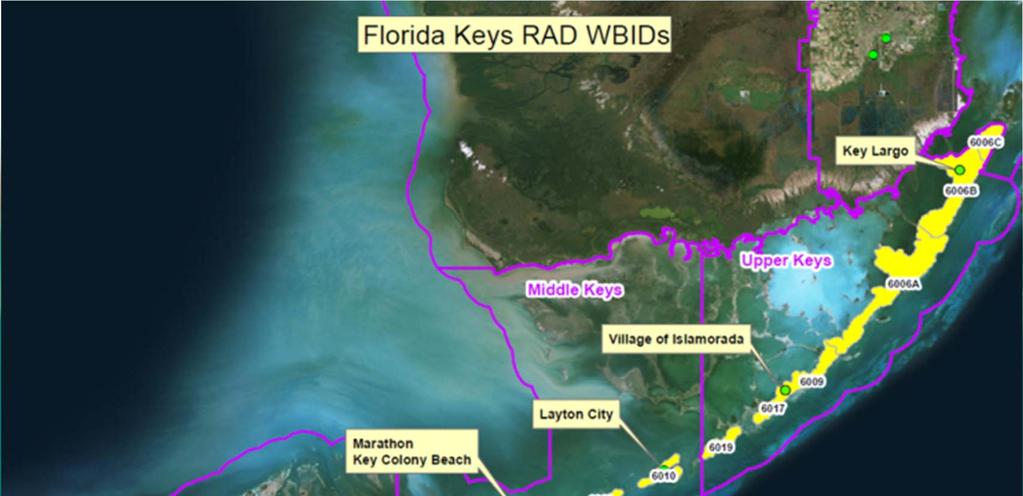
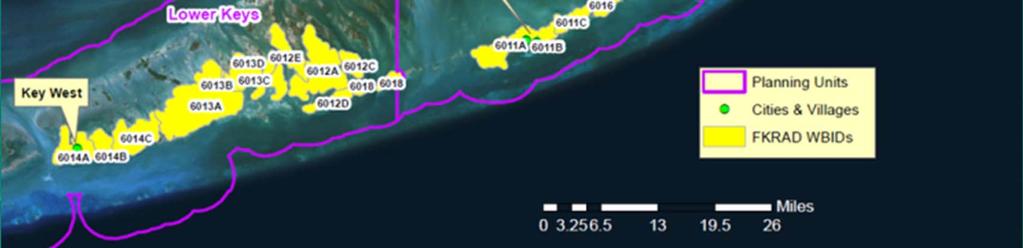
27 Examples of Completed RAPs Tampa Bay Shell, Prairie, and Joshua Creeks Lake Seminole Florida Keys
")
28 RAPs in Development Mosquito Lagoon Loxahatchee River Also, Florida Keys Reasonable Assurance Document (RAD ) Update
29
 New Smyrna Beach Oak Hill Volusia")
30 Mosquito Lagoon RAP Sponsors: Edgewater Florida Department of Transportation (FDOT) New Smyrna Beach Oak Hill Volusia County

31 Loxahatchee River RAP Sponsor: Loxahatchee River Coordinating Council
32

33 DEP Role in RAPs Guidance Feedback Adoption Transmit plan Support EPA approval Facilitation support

34 Role of Facilitation Neutral party Action items Meetings Plan document Feedback

35 Some Lessons Learned Time and project commitments are necessary Technical support is beneficial Data limitations often affect management decisions Valuable to have local control of the process
36 Mosquito Lagoon RAP A Stakeholder s Perspective Judy Grim, Director Volusia County Road and Bridge Florida Stormwater Association Winter 2017 Meeting 6 December 2017

37 Water Quality Workshop June 26, County Council hosts a water quality workshop Agenda: Priority Surface Waters Water Quality Overview - Surface Water Quality Monitoring - Common Pollutants and Sources Regulatory Protections of Water Bodies Volusia County Stormwater Management Wastewater/Septic Infrastructure City Presentations: Daytona Beach, Daytona Beach Shores, Deland, Deltona, Edgewater, Lake Helen, New Smyrna Beach, Orange City, Ormond Beach, Ponce Inlet, Port Orange, South Daytona


38 Priority Surface Waters Indian River/ Mosquito Lagoons Halifax River Tomoka River Spruce Creek St. Johns River - Blue Springs - Gemini Springs

39 Water Quality Monitoring Indian River/Mosquito Lagoons Tomoka River Halifax River Spruce Creek St. Johns River - Blue Spring -Gemini Springs

40 Water Quality Monitoring Collecting since Locations, quarterly or monthly Data is shared through the state and national database

41 Indian River Lagoon Mosquito Lagoon 156 miles long, 6 counties, 2 water management districts Algae blooms in 2011, 2012, 2013 Banana River Lagoon Indian River Lagoon 3 distinct sections - Mosquito Lagoon - Banana River - Indian River


42 Mosquito Lagoon 60 square mile sub-basin Includes the 4,740 acre Mosquito Lagoon Aquatic Preserve Class II shellfish harvesting waters Very shallow, extreme salinities, long retention time Water Quality Meets current criteria for chlorophyll, N and P May exceed proposed DEP criteria for chlorophyll, N and P
43 Volusia County Water Plan Identifies four primary ways to improve water quality: Eliminating septic tanks in watersheds/spring sheds of priority water bodies; Improving stormwater conveyance and treatment systems to reduce nutrient pollution; Developing meaningful education and outreach programs to inform citizens about water quality; Reducing nutrients from wastewater plant discharges to surface or ground water.
44 Stormwater Management Volusia County Stormwater Management Program: Drainage basin studies Stormwater Capital Improvements Program Improving stormwater conveyance and treatment systems to reduce nutrient pollution Grant procurement Staff training and education
45 Regulatory Protections Water Quality appears to be declining Pollutant sources: stormwater runoff; fertilizer; septic tanks; wastewater discharge Not considered impaired through the Total Maximum Daily Load (TMDL) regulatory process Implement proactive process to stop the decline and improve water quality
 was approved.")
46 Water Quality Plan Updates September 18, 2014 County Council adopts Resolution setting forth goals to improve water quality February 5, 2015 County Council adopts a Water Quality Plan with specific goals and actions to implement water quality improvements September 18, 2015 Funding for development of the Mosquito Lagoon Reasonable Assurance Plan (RAP) was approved.
47 Mosquito Lagoon RAP 2015 Water Quality Plan Goal 2: Develop a Reasonable Assurance Plan (RAP) for Mosquito Lagoon Process to improve a water body where a TMDL has not been established Local control over development and implementation of prevention and restoration activities Makes grant funding more accessible


48 Stakeholders within the Mosquito Lagoon Watershed: Volusia County City of Oak Hill City of Edgewater City of New Smyrna Beach Florida Department of Transportation And collaboration with: Stakeholders Florida Department of Environmental Protection Indian River Lagoon Council St. Johns River Water Management District and others
 in County 121 in NSB 125 in EW 168 in OH")
49 Mosquito Lagoon Area Land Area in Acres: County 10,022 (includes ROW in Cities) New Smyrna Beach 4,485 Edgewater 6,467 Oak Hill 2,608 FDOT Roads (approximately 492) in County 121 in NSB 125 in EW 168 in OH

50 Joint Project Agreement Requires participation and funding from all stakeholders within the Mosquito Lagoon Watershed Between Volusia County and the cities of Edgewater, New Smyrna Beach and Oak Hill Separate funding agreement between FDOT and County
51 JPA Elements Scope of work for consultant contract Governance and management - Designate project administrator and alternate for each party - Each party has one vote plus FDOT a vote - Simple majority rules Funding - Cost allocation for project - Provisions for funding additional work Responsibility of parties Terms, amendments and termination
52 RAP Budget Stakeholders agreed to cost share allocation Volusia County $190,000 City of Edgewater $93,000 City of New Smyrna Beach $63,000 City of Oak Hill $25,000 FDOT $7,000 Total funding $378,000 Cost share allocation based on percentage of land in watershed basin.

53 RAP Progress Joint Participation Agreement (JPA) - Agreements between the Cities and Volusia County is Complete -Volusia County and FDOT have a separate agreement Consultant selection through CCNA - Contract with Jones Edmonds Project began March 2016 Project scheduled to be completed by March 2018
54 Challenges Requires multiple sanctioning bodies to approve JAP and allocate funding RAP is very technical process and has a long duration Keeping parties on track Special interest groups
55 Results Successfully assessed and documented current water quality and biological conditions Established appropriate and measurable indicators, endpoints, goals, and targets Identified and prioritized appropriate prevention or restoration projects
56 Mosquito Lagoon Reasonable Assurance Plan Technical Approach Brett Cunningham Jones Edmunds & Associates Florida Stormwater Association Winter 2017 Meeting 6 December 2017
57 Technical Framework Select Watershed Model Determine Flows and Loads Develop Load Reduction Projects Establish Goals Determine Potential Pollutants of Concern Establish Water Quality Targets Determine Load-Response Relationship Determine Load Reduction Needed Develop RAP
 Possibly Biochemical Oxygen Demand (BOD) (Photo: CRAIG")
58 Potential Pollutants of Concern Total Nitrogen (TN) Total Phosphorus (TP) Possibly Biochemical Oxygen Demand (BOD) (Photo: CRAIG RUBADOUX)

59 Watershed Characteristics 36 Miles Long, 117 Square Miles Connected to Ponce Inlet and North IRL Watershed: Waterbody Small Subwatersheds Seasonal High Water Tables Mostly Sandy Soils
60 Importance of Transparency and Documentation
61 Pollutant Loading Model Selection Key Watershed Characteristics and Simulation Capabilities Surface Water/Groundwater Interactions Flows and Loads from Direct Runoff and Base Flow Flows and Loads from WWTPs, Septic Tanks, and Atmospheric Deposition Account for Stormwater Best Management Practices Continuous Simulation Spatially enabled

62 Watershed Model: SIMPLE Met criteria Transparency with Stakeholders Time-Enabled Data Flexible for Analyses of Options

63 Watershed Boundary LiDAR Stormwater Infrastructure Considered Closed Basins

64 Spatial Distribution Variability Across the Watershed
65 Spatial Distribution Station Name Ransom Road at NASA Ponce Inlet Weather Site at USCG Station Playalinda at Turtle Mound Parrish Park at Scottsmore Station Number Year Annual Rainfall Total (Inches) Average (Inches) Std Dev (Inches)
66 Spatial Distribution

67 Time-Aware Land Use Increases Credibility Removes Bias
68 Concentrations Land Use # Description BOD TN TP 1 Open Forest Pasture Agriculture Golf Courses Low-Density Residential Medium-Density Residential High-Density Residential Low-Intensity Commercial High-Intensity Commercial Light Industrial Heavy Industrial Wetlands Water Transportation Constituent TN TP BOD Concentration (mg/l)

69 Best Management Practices Spatial Coverage Type Year Built
70 BMP Removal Efficiencies Constituent Removal Efficiency BMP Type Volume TN TP BOD Baffle Box (Generation 1) Baffle Box (Generation 2) Exfiltration 1, Mosquito Impoundment Retention 1, Swale 1, Treatment Train 1 (swale, wet detention, and possibly baffle box) Treatment Train 2 (swale/retention and wet detention) Wet Detention
71 Point Sources Year Edgewater Surface Edgewater Reuse Annual Discharge Rate (MGD) New Smyrna Beach Surface New Smyrna Beach Reuse Volusia Southeast Reuse

72 Septic Systems ~2,800 Septic Systems Failure Rate Proximity to Waterbody Return Fraction
73 Atmospheric Deposition Four Rain Gages National Atmospheric Deposition Program Site FL99 at the Kennedy Space Center SJRWMD Site IRL141 (wet deposition) at Coconut Point in Sebastian Inlet Clean Air Status and Trends Network (CASTNET) (dry deposition) at the same location
74 Total Volume Results 8,000,000,000 Total Volume in cubic feet ( ) 7,000,000,000 6,000,000,000 5,000,000,000 4,000,000,000 3,000,000,000 2,000,000,000 1,000,000, Year ENR 1 (Ponce de Leon) ENR 2 (Oak Hill) ENR 3 (Southern Terminus)
75 Total lb/year Total Nitrogen Results TN in lb/year ( ) 310, , , , , , , , , , , , , , , , , , , , , ,000 90,000 80,000 70,000 60,000 50,000 40,000 30,000 20,000 10, Year ENR 1 (Ponce de Leon) ENR 2 (Oak Hill) ENR 3 (Southern Terminus)
76 Total Phosphorus Results 20,000 TP in lb/year ( ) 18,000 16,000 14,000 Total lb/year 12,000 10,000 8,000 6,000 4,000 2, Year ENR 1 (Ponce de Leon) ENR 2 (Oak Hill) ENR 3 (Southern Terminus)
77 North ENR Total Volume Results Total Volume for North Lagoon (ENR 1) ( ) 22% 3.0% 1% 45% 29% Atmospheric Deposition Baseflow Direct Runoff Point Source Septic
78 North ENR Total Nitrogen Results TN for North Lagoon (ENR 1) ( ) 8% 4% 20% 35% 33% Atmospheric Deposition Baseflow Direct Runoff Point Source Septic
79 North ENR Total Phosphorus Results TP for North Lagoon (ENR 1) ( ) 9% 4% 11% 40% 36% Atmospheric Deposition Baseflow Direct Runoff Point Source Septic
80 South ENR Total Volume Results Total Volume for South Lagoon (ENR 3) ( ) 17% 6% 77% Atmospheric Deposition Baseflow Direct Runoff
81 South ENR Total Nitrogen Results TN for South Lagoon (ENR 3) ( ) 37% 53% 10% Atmospheric Deposition Baseflow Direct Runoff
82 South ENR Total Phosphorus Results TP for South Lagoon (ENR 3) ( ) 20% 51% 29% Atmospheric Deposition Baseflow Direct Runoff
83 Mosquito Lagoon RAP Seagrasses NNC water quality targets Stressor-response relationships Loading targets
84 Seagrass
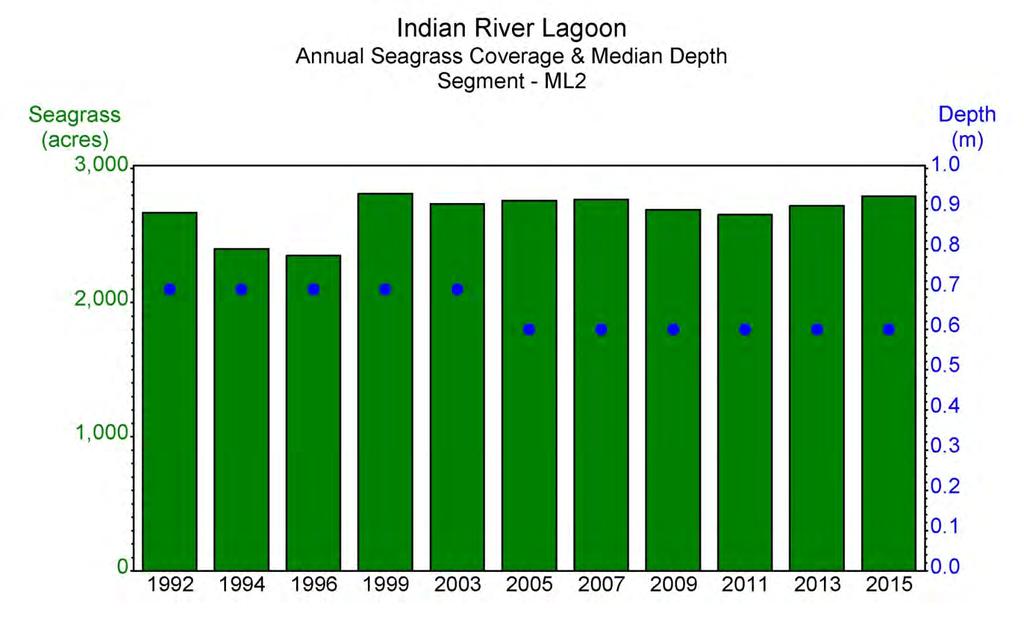
85 Seagrass
86 Seagrass
87 Water Quality Targets Establishment of water quality criteria that protect critical aquatic resources is a necessary element of the Reasonable Assurance Plan
88 Water Quality Targets Reasonable Assurance Plan provides focus for the management actions to restore and protect Mosquito Lagoon Important to neither fall short of the actions necessary to protect the Lagoon nor to exceed those actions adequate to protect the Lagoon Best science
89 Water Quality Targets In 2014, FDEP set criteria built on preliminary data analysis by the St. Johns River Water Management District (2010) Used a reference period of Did not include any data beyond 2008
90 Water Quality Targets Water quality targets in estuaries typically based on the protection of seagrasses and other aquatic life Seagrass health depends upon adequate light Water clarity driven by ambient water quality conditions including chlorophyll and nutrient concentrations
91 Water Quality Targets District seagrass show seagrasses were similar throughout the period and were not exceptionally greater during the Based on the seagrass data a reference period of , which is more representative of long-term meteorological conditions, has been proposed.
92 Water Quality Targets Using the methodology used by FDEP in 2014, revised criteria have been proposed for TN, TP and chlorophyll The proposed targets have been reviewed by FDEP and will require acceptance by both FDEP and EPA.
93 Water Quality Targets Comparison of current and proposed water quality targets Estuarine Nutrient Region North Central South Parameter FDEP (2014) Proposed TN (mg/l) TP (mg/l) Chlorophyll a (µg/l) TN (mg/l) TP (mg/l) Chlorophyll a (µg/l) TN (mg/l) TP (mg/l) Chlorophyll a (µg/l)
94 Loading Targets A primary objective in establishing a Reasonable Assurance Plan is to define the nutrient loading targets that are needed to restore and protect estuarine health
95 Loading Targets Definition of nutrient loading targets generally follows one of three alternative approaches Empirical Modeling Mechanistic Modeling Reference Period
96 Loading Targets Series of empirical relationships were examined using the available ambient water quality data and nutrient loading estimates Applied statistical techniques to define the relationships quantitatively for multiple temporal and spatial scales Confounding factors
97 Loading Targets Factors examined include: Nutrient (TN and TP) concentrations Nutrient (TN and TP) loadings Lag effects of nutrient loading Effects of residence time Effects of fluxes
98 Empirical Modeling
99 Empirical Modeling
100 Empirical Modeling
101 Empirical Modeling Conclusions No significant quantitative relationships between ambient water quality and nutrient loads were found It should not be inferred that chlorophyll is not dependent upon nutrient conditions Therefore, an alternative approach is needed to define nutrient loading targets
102 Other Approaches to Define Nutrient Loading Targets Current efforts to develop a mechanistic model building upon the existing EFDC hydrodynamic model are underway by the SJRWMD Given the complexity of Mosquito Lagoon this tool may be what is necessary to define the relationships between ambient water quality and nutrient loads
103 Other Approaches to Define Nutrient Loading Targets However, the timing of the availability of the model is uncertain Therefore, the Reference Period approach, i.e., the third commonly used alternative approach to establishing nutrient loading targets is recommended
104 Reference Period Approach A reference period approach was used to establish the current NNCs for Mosquito Lagoon That reference period was defined as Examine the nutrient loading for that period and compare to other potential reference periods
105 Reference Period Approach However, the timing of the availability of the model is uncertain Therefore, the Reference Period approach, i.e., the third commonly used alternative approach to establishing nutrient loading targets is recommended
106 Reference Period Approach Four criteria: Conservative, i.e., protective Avoids the bloom period Is not biased by excessively high or low rainfall If possible, be reflective of management actions that have already been achieved

107 Reference Period Approach North ENR Mean TN Loads Pre-bloom Post-bloom
108 Reference Period Approach Central ENR Mean TN Loads Pre-bloom Post-bloom
109 Reference Period Approach South ENR Mean TN Loads Pre-bloom Post-bloom
110 Proposed Nutrient Loading Targets (lbs/year) TN Loads ENR Baseline Target % Reduction North 110,059 93, Central 102,905 88, South 173, ,245 16
111 Proposed Nutrient Loading Targets (lbs/year) TP Loads ENR Baseline Target % Reduction North 12,370 10, Central 8,000 7,343 8 South 8,314 7,492 10
112 Treatable Loads Total nutrient loads are the sum of: Runoff Baseflow OSDS Point Sources Atmospheric Deposition Need to translate the % load reduction in terms of the portion of the total nutrient loads that can be treated locally as part of the RAP
113 Proposed Nutrient Loading Targets (lbs/year) Treatable TN Loads ENR Mean % Reduction Load Reduction North 77, ,564 Central 7, ,520 South 77, ,391
114 Proposed Nutrient Loading Targets (lbs/year) Treatable TP Loads ENR Mean % Reduction Load Reduction North 10, ,529 Central 6, South 6,
115 Mosquito Lagoon RAP Project Options and Steps Forward Florida Stormwater Association Winter 2017 Meeting 6 December 2017
116 Retrofit Sizing Unit costs can be much lower based on knee of curve Beyond the knee may better than next best option Often siteconstrained
117 Retrofit Sizing 45,000 40,000 35,000 30,000 25,000 20,000 15,000 10,000 5,000 Average Annual Total Nitrogen Load Reducted to the IRL (lb) Maximum Sottile Canal Flow Diversion Capacity (cfs) 30,000 25,000 20,000 15,000 10,000 5, Maximum M1-Canal Flow Diversion Capacity (cfs) Average Annual Total Nitrogen Loads Reduced to the IRL (lb)
118 Life-Cycle Costing Capital costs Annual load reductions projected over economic life ($/lb) Annual O&M costs Annual load reductions ($/lb) Capital + O&M ($/lb)

119 Project Options Overview Large Treatment Areas Economies of Scale Untreated Areas Spread Across Stakeholders Flexibility Lowest Life-Cycle Costs 31,500 lb/yr TN

120 Option 1: Diversion to Borrow Pit South Avoids Large Excavation FAA Concerns Base Flow and Runoff Treats 640 acres 1,300 lb/yr TN $20/lb TN

121 Option 2: 10th Street Treatment Facility Part of a Larger Project Base Flow and Runoff Treats 4,600 acres 5,600 lb/yr TN $20/lb TN

122 Option 3: Elizabeth Street Treatment Facility Fall back to Option 2 Expansion of Previous Design Treats 2,300 acres 4,300 lb/yr TN Base Flow and Runoff $20/lb TN

123 Option 4: East Indian River Boulevard Bioreactor Existing Swale and Wet Detention Treatment Treats 2,200 acres Mostly Base Flow Pumped System 3,900 lb/yr TN $50/lb TN

124 Option 5: Fern Palm Drive BAM Outfall Wet Detention Outfall Retrofit Part of Option 4 Fallback Treats 175 acres Base Flow and Runoff 630 lb/yr TN $35/lb TN

125 Options 6 and 7 Similar to Option 5

126 Option 8: Septic to Sewer 15 to 25 lb/yr TN for Close Proximity to Waterbody $900-$1,500/lb/yr TN w/no WWTP Upgrades Large Stormwater Projects ~$500 lb/yr TN 1000s of lb/yr TN Tied to Funding

127 Option 9: Aerial Canal Water Quality Improvement Retrofit of a Retrofit BAM Outfall Treats 1,500 Acres 1,300 lb/yr TN $90 lb/yr TN

128 Option 10: Lighthouse Cove Treatment Facility Base Flow and Runoff Treats 420 acres 760 lb/yr TN $80/lb TN
129 Option 11: Dragline Ditch Restoration Reviewed >>50 research papers Proposed: Difference between bare and vegetated denitrification rates Need site-specific research 1,300-acre restoration could be 13,000 lb/yr TN reduction
130 Option 12: Reduced Flux from North IRL TBD
131 Option 13: Programmatic Changes 3% Current Reduction: 2,100 lb/yr TN 1% for DOT 6% Reduction w/fyn: 4,100 lb/yr TN
132 Management Actions Large stormwater projects and progammatic solutions will account for 54% of the needed load reductions Select septic to sewer will likely be needed long-term Dragline ditch restoration could be significant Smaller projects will contribute to the solution

133 Monitoring Compliance and Annual Reporting Ambient water quality monitoring 5-Year Updates Nutrient loading Seagrass Project Tracking Progress in existing projects Identification of new projects

134 Adaptive Management Develop a series of what ifs and responses
135 THANK YOU DISCUSSION