OREGON PUBLIC UTILITY COMMISSION 2009 NATURAL GAS OUTLOOK WORKSHOP. July 7, :30 PM Main Hearing Room
|
|
|
- Donna Gregory
- 5 years ago
- Views:
Transcription
1 OREGON PUBLIC UTILITY COMMISSION 2009 NATURAL GAS OUTLOOK WORKSHOP July 7, :30 PM Main Hearing Room
2 Agenda Overview of expected PNW natural gas prices for Staff Five top natural gas issues Staff National PNW The national and international picture on natural gas supply, demand, and price Northwest Gas Association Utility presentations Avista, Cascade, Northwest Natural Gas purchasing picture Expected WACOG for the PGA Conservation, efficiency, and customer assistance programs 2 July 7, 2009 OPUC 2009 Natural Gas Outlook
3 Pacific Northwest Spot Natural Gas Price $/MMBtu $8.50 $8.00 $7.50 $7.00 $6.50 $6.00 $5.50 $5.00 Annual , $6.20 Winter , $5.86 Based on EIA Short Term Energy Outlook June 9, 2009 July 7, 2009 OPUC 2009 Natural Gas Outlook 3
4 Pacific Northwest Spot Natural Gas Price $/MMBtu $8.50 $8.00 $7.50 $7.00 $6.50 $6.00 $5.50 $5.00 $6.20 $ Based on EIA Short Term Energy Outlook June 9, July 7, 2009 OPUC 2009 Natural Gas Outlook Annual Winter Current Avista PGA WACOG Current CNG PGA WACOG Current NWN PGA WACOG 4
5 Five Top Natural Gas Issues National Unconventional production environmental issues and depletion rate Demand for electric generation Carbon costs and markets Price/Supply balance Record storage, over and over PNW Future of Canadian exports Future of Rockies supply Pipelines from the Rockies West LNG Energy efficiency and conservation 5 July 7, 2009 OPUC 2009 Natural Gas Outlook
6 NWGA and LDC Presentations NWGA Dan Kirschner Avista Corporation Kevin Christie Cascade Natural Gas Corporation - Mark Sellers- Vaughn Northwest Natural Randy Friedman July 7, 2009 OPUC 2009 Natural Gas Outlook 6
7 Policy Overview Climate Change: a political and policy reality Kyoto, Kyoto II, Waxman Markey, RGGI, WCI, State/Provincial Climate Change Offices Carbon Tax, Cap and Trade, Renewable Energy Requirements, Emission Standards Regional Implications: Acceleration of new and alternative technologies (e.g. energy resources, CCS, etc.) More gas fired generation Higher costs
8 Recent Gas Demand PNW Gas Deliveries (source: US EIA, StatCan) 1,000 Generation Industrial 800 Commercial 600 Million Dth

9 Demand Forecast by Case
 1.6% 1.")
10 Base Case Forecast by Sector (1%, 8.6%) 1.6% 1.9%


11 Capability (MWa) Geothermal Petroleum Wind Solar Natural gas Hydro Coal Biomass -200 Northwest Power and Conservation Council April, 2008
12 North American Supply Projected US Supply/Demand Balance (EIA Annual Energy Outlook 2005) Tcf Initial Alaskan gas reaches lower Year LNG Canada Domestic Total US Demand
13 35 North American Supply US Natural Gas Supply/Demand Balance (EIA AEO) 30 Tcf LNG is the marginal resource Alaska/Frontier Gas 15 Canadian exports to U.S. decline 10 5 LNG Imports Canadian Imports US Production US Demand 0

14 Rockies Supplies Growing

15 Last Year s WSCB Forecast

16 Source: Draft Final Report of the Oil and Gas Climate Action Working Group, Jan 2009

17 BC Production Growing
18 WCSB Gas Production- History and Forecasts (BCF/D) History Minimum Forecast Maximum Forecast

19 US Shale Gas Supply Areas BC Shale/Tight Gas Supply Areas Marcellus Shale Haynesville Gas shale deposits appear in basins from the east to the west coast across the United States. Although recovery percentages are low, total volumes are high. (Map from epmag.com, courtesy of Schlumberger)

20 Source: BMO Capital Markets

21 Source: American Clean Skies Foundation.


22 Pipelines Inland Pacific Connector Palomar East Sunstone Blue Bridge Ruby 22


23 LNG Terminals Kitimat LNG (export) WestPac LNG Oregon LNG Bradwood Landing LNG Jordan Cove LNG Pipelines Pacific Trail Pacific Connector Palomar West Oregon LNG Kitimat LNG WestPac LNG Oregon LNG Bradwood Landing LNG Jordan Cove LNG 23

24 Design Day Capacity

25 Capacity Utilization Low Hydro (Base Case, )
")
26 Capacity Utilization Cold Year (Base Case, )

27 Sumas Flow Actual
28 NWGA Conclusions Blue Bridge: ACES Demand growing Climate Change: NG will facilitate generation direct use Supplies promising Challenges improved technologies infrastructure/access required Uncertain public policy Conflicting objectives Localized opposition Prices Trends/movements continental Regional differences due to access/diversity


29 5335 SW Meadows Rd., #220 Lake Oswego, OR (503) NWGA Members: Avista Corporation Cascade Natural Gas Co. Intermountain Gas Co. NW Natural Puget Sound Energy Spectra Energy Transmission Terasen Gas TransCanada s GTN System Williams NW Pipeline

30 KZ1 OPUC 2009 Natural Gas Outlook Avista Corporation Kevin Christie July 7, 2009
31 Slide 30 KZ1 Ken Zimmerman, 6/29/2009
32 $12.00 $10.00 $8.00 $6.00 $4.00 $2.00 $0.00 Year over Year Price Comparison Gas Daily AECO Prices 2008 vs What a difference a year makes. Last year's daily price was $10.63, and this year the daily price is $2.53, that s a $8.00 difference. 29-Jan 5-Feb 12-Feb 19-Feb 26-Feb 5-Mar 12-Mar 19-Mar 26-Mar 2-Apr 9-Apr 16-Apr 23-Apr 30-Apr 7-May 14-May 21-May 28-May 4-Jun Jan 15-Jan 8-Jan 1-Jan $/Dth
33 $12.00 $10.00 $8.00 $6.00 $4.00 $2.00 $0.00 Year over Year Price Comparison cont. Nov '09 - Mar '10 AECO Price 2008 vs Forward prices were not immune to the price decrease. Last year's price was $11.27, and this year the same strip is $5.20, that s a $6.00 difference. 29-Jan 5-Feb 12-Feb 19-Feb 26-Feb 5-Mar 12-Mar 19-Mar 26-Mar 2-Apr 9-Apr 16-Apr 23-Apr 30-Apr 7-May 14-May 21-May 28-May 4-Jun 11-Jun 18-Jun 22-Jan Jan 8-Jan 1-Jan
34 Market Summary In the short-term low prices are likely to remain due to: US and Canadian storage balances storage at record levels Robust US production at record highs despite a major reduction in gas related drilling Decreasing industrial demand the recession has caused industrial demand to fall off dramatically Hurricane risk the impact in Gulf production isn t what it used to be Canadian imports have declined but not at the expected rate. Shale gas discoveries in British Columbia are very promising Recession global economy may not recover this year Factors trying to rally prices: Rig counts significant laying off of drilling rigs may have a delayed affect Oil and gas relationship may come back into play Financial investors in commodity markets Environmental issues put pressure on unconventional drilling activities
35 US Storage Balances
36 Baker Hughes Rig Counts 1,800 Rig counts are down 919 since the peak. That is a 64% drop. 1,600 1,400 Number of Rigs 1,200 1, Jul Aug Aug Sep Oct Nov Dec Jan Feb Mar Apr May Jun Month Previous Year Current Year
37 2009 Hurricane Forecast Historically, natural gas prices have been effected by hurricane s due to their impact on production. The Gulf of Mexico used to contribute approximately 25% of L48 production, now it contributes about 14%.
38 Market Continues It s Steep Contango AECO Prices as of 6/24/2009 $8.00 $7.00 $6.27 $6.71 $6.87 $7.20 $6.00 $5.00 $4.93 $4.00 $3.00 $2.94 $2.00 $1.00 $0.00 Current Spot W W W W W 13-14
39 Natural Gas Procurement Plan Objective Goal To provide reliable supply at stable and competitive prices in an expected volatile market Premise - Avista cannot accurately predict future natural gas prices, but market conditions and experience help shape overall approach The procurement plan incorporates a portfolio approach that is diversified in terms of: Components: The plan utilizes a mix of index, fixed price, and storage transactions. Transaction Dates: Hedge windows are developed to distribute the transactions throughout the plan. Supply Basins: Supplies come from the Rocky Mountain region and Alberta. Sumas will be used for supply and price optimization. Delivery Periods: Hedges are completed in annual, seasonal and monthly timeframes. Long-term hedges may be included Transactions are executed pursuant to a plan and process; however, the procurement plan allows Avista to be flexible to market conditions and opportunistic when appropriate.
40 Prompt Year Procurement Plan Storage Withdrawals 10% Index/Spot 32% Long-term - Previous Hedges 11% Executed Short Term Hedges 15% Executed Discretionary Hedges 10% Remaining Discretionary Hedges 5% Remaining Short Term Hedges 17%
41 Procurement Results to Date Executed 54% of planned hedges covering 37% of annual average load. Weighted average annual cost of hedges executed is $ % from prior years at a cost of $ % from current year at a cost of $4.94 Storage: 26% full at a WACOG of $2.82 Annual commodity WACOG currently in rates: Total Rate - $8.30 Hedges - $8.86 Storage - $7.82 Index - $6.70
42 2009 Gas Supply and Pricing Outlook Cascade Natural Gas Corporation Mark Sellers-Vaughn July, 2009
43 Cascade Natural Gas Corp. GAS SUPPLY AND PRICING OUTLOOK MEETING CUSTOMERS NEEDS Ensure All Core Customers Natural Gas Needs are Met - Through Disciplined Market Analysis, Long-term Contracts, and Prudent Storage Management Actively Promote Customer Conservation Mitigate Price Volatility for Customers - Through Multi-Year Hedging and a Diversified Portfolio EMPLOYING EFFECTIVE SUPPLY SIDE STRATEGIES Maintain a Rolling Five-Year Physical Supply Portfolio Firm, Diversified Supply Contracts Prices are Hedged with Multi-Year Financial Swaps for up to 3 years and through Fixed-price Physical contracts Utilize Market Area Storage: Jackson Prairie and Plymouth LNG Effectively Manage Wholesale Prices - Through Cost-Effective FOM and Day Gas Purchases By Participating in USA and Canadian Pipeline Rate Filings By Optimizing Pipeline Capacity and Other Core Resources Through Available Release Mechanisms
44 2009 HURRICANE SEASON There has been no appreciable change in the hurricane forecast. NOAA is still forecasting a normal season, with eleven named storms. Chris Hebert, Chief Meteorologist for Impact Energy (Entergy), has been recently quoted as forecasting ten named storms, with two expected to be major. Hebert said August and September will see a burst of activity, but it will be short-lived. Current atmospheric models are generally quiet in the Atlantic Basin. Prices will likely spike if hurricanes approach the Gulf, but at this point there does not appear to be cause for concern.
45
46
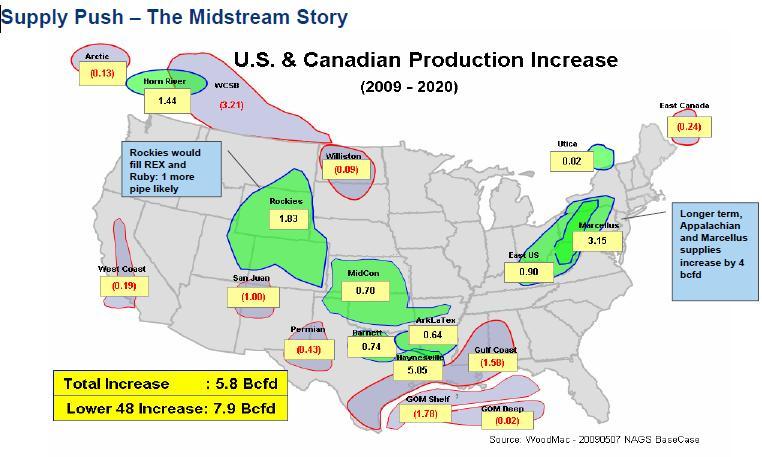
47 Some additional thoughts on production and supply availability While it is true that overall, Canadian exports will decline: Shale gas success has brought a shift in North American supply. Development of prolific unconventional plays is set to support production growth into the next decade. Strong upside exists in both emerging and prospective shales, which hold an estimated 1000 tcf of gas in place. Production in key shales Barnett, Arkoma, Haynesville, WCSB, and Marcellus is expected to rise to 15.4 bcfd by 2015 and 21.6 bcfd by In the outer years, Rockies production will likely respond to decrease in imports from Canada.
48
49 $14.00 $12.00 $10.00 $8.00 $6.00 $4.00 $2.00 $- NYMEX MONTHLY SETTLEMENT PRICE SINCE NOVEMBER 2007 Nov-07 Dec-07 Jan-08 Feb-08 Mar-08 Apr-08 May-08 Jun-08 Jul-08 Aug-08 Sep-08 Oct-08 Nov-08 Dec-08 Jan-09 Feb-09 Mar-09 Apr-09 May-09 Jun-09
50 Price Forecast $8.250 $7.750 $7.250 $6.750 $6.250 $5.750 $5.250 $4.750 Nov-09 Nov-10 Nov-11 Nov-12 Nov-13 Consultant 1 NYMEX (6/19/09) Consultant 2 WEIGHTED PLUS 5%
51 Natural Gas Price Factors It is still uncertain if the recession has leveled out. Demand for natural gas continues to be down due to the economy Rig counts are down, but stabilizing Canadian exports will decline in the long-term Shale will temper the decline Overall, prices are still relatively low compared to last year At this time, hurricane season is not impacting prices in the near term Market is in contango We still need a diversified portfolio
52 Typical Winter Day Supply Stack Plymouth (Storage) FOM/Day Gas (As Needed) Annual (365 days) Jackson Prairie (Storage) IMBALANCE STORAGE PEAKING Peaking (As Needed) Citygate (As Needed) CITYGATE BRITISH COLUMBIA ROCKIES ALBERTA Seasonal (Winter) Pipeline Imbalance Total Core Load in this example is 200,000 dths, with a system degree day of 42.
53 November 2009 through October 2010 Gas Supply Outlook and Strategies Peak events unlikely to occur based on most recent weather predictions Cascade has sufficient firm supplies flowing on our firm transportation to meet load requirements Firm peaking and citygate delivery contracts in place Storage accounts will be full by September 30, 2009 Recall released firm capacity, whenever required Pricing will continue to be volatile We will use financial derivatives and fixed-price physical supplies to minimize impact of price fluctuations Continual assessment of portfolio and market to seek out opportunities to minimize portfolio costs

54 Gas Supply and Pricing Outlook Randy Friedman Director, Gas Supply July 2009
55 Factors Being Watched Today u Economic recovery, especially Industrial Demand u Rig Count Reductions u Discount of Natural Gas versus Oil Prices u Coal to Gas Generation Switching and of course all the usual suspects: u Weather, Storage, etc. 54
56 Major New Natural Gas Pipelines Built Since Six intrastate header pipelines with in excess of 3.4 Bcf/d of capacity, primarily to transport coalbed methane gas to interstate pipeline interconnections Alliance Pipeline (2.0 Bcf/d) 2006 Grasslands Pipeline (0.1 Bcf/d) 2007 Cheyenne Plains Pipeline (0.8 Bcf/d) 2008 Rockies Express Pipeline (1.8 Bcf/d) 2002 Guardian Pipeline (0.7 Bcf/d) 2002 Horizon Pipeline (0.4 Bcf/d) 2000 Vector Pipeline System (1.0 Bcf/d) 2007 Rockies Express Entegra Pipeline (1.5 Bcf/d) 1999 Maritimes & Northeast 1999 Portland Natural Gas pipeline systems TransColorado Pipeline System (0.4 Bcf/d) 2008 Millennium Pipeline (0.5 Bcf/d) 2002 Questar Southern Trails Pipeline (0.1 Bcf/d) Capacity (million cubic feet per day) 15, North Baja Pipeline ( 0.5 Bcf/d) 9,000 3, Five intrastate pipelines from the Barnett Shale formation area to interconnections with interstate pipelines (more than 3 Bcf/d) 2008 Centerpoint Perryville Extension (1.2 Bcf/d) 1998 Destin Pipeline (1 Bcf/d) 2006 Independence Trail Pipeline (1 Bcf/d) 2008 Southeast Supply Header Pipeline (1.1 Bcf/d) 2002 = Direction = Gulfstream of of Flow Pipeline System = Bi-directional (1.1 Bcf/d 2007 Cypress Pipeline System (0.4 Bcf/d) Source: EIA 55
57 A Quick Comparison as of Last Year $/Barrel CRUDE OIL June NYMEX Futures Natural Gas CRUDE OIL Natural Gas $/Dth Source: Natural Gas Intelligence, June 2, As of the Last Week of May 0 56
58 A Quick Comparison - Updated $/Barrel June NYMEX Futures CRUDE OIL Natural Gas $/Dth , 2008 prices as of last week of May; 2009 prices from May 14 th settlements 57
59 Storage levels setting new records 58


60 What Some Experts Are Saying Source: Natural Gas Intelligence, May 11, 2009 Source: Natural Gas Intelligence, May 18,
61 Current Supply Sources 2008 Purchases British Columbia 25% Mist 1% Rockies 39% Alberta 35% 60
 British Columbia (Stn 2) 58,000 Alberta 115,000 2% 27% NWN Malin Stanfield Rocky Mountain Basin Rockies 110,000 Opal Jackson Prairie 10,000 Mist Storage 107,000")
62 Station 2 15% NW Natural Average Winter Day WCSB 29% Flowing Supplies Sumas AECo Storage Avg. Day Winter Supply Volumes (MMBtu) British Columbia (Stn 2) 58,000 Alberta 115,000 2% 27% NWN Malin Stanfield Rocky Mountain Basin Rockies 110,000 Opal Jackson Prairie 10,000 Mist Storage 107,000 Portland LNG 0 Newport LNG 0 Plymouth LNG 0 27% San Juan Basin Total 400,000 Assumes that storage is 100% full on Nov 1. Topock Permian Basin 61
63 Decisions with 2009/10 PGA Implications u Mist Recall 10,000 Dth/day additional deliverability u Recall arrangements 5,200 Dth/day capacity acq. ended by customer 8,000 Dth/day recallable supply/capacity under negotiation u Longer term Contracting 3 year financial swaps 62
64 WACOG Past and Present (Future?) $/Dth Alberta WACOG Rockies - Nov- 98 Nov- 99 Nov- 00 Nov- 01 Nov- 02 Nov- 03 Nov- 04 Nov- 05 Nov- 06 Nov- 07 Nov- 08 Nov