EOR Economics Research E O R I TA B M E E T I N G J A N
|
|
|
- Jodie Mason
- 5 years ago
- Views:
Transcription


1 EOR Economics Research BENJAMIN R. COOK E O R I TA B M E E T I N G J A N

2 1. CO 2 -EOR Economic Scoping Studies 2. Economic Screening Beyond CO 2 3. EOR Economic Impact Studies 4. Other Related Pure Research

3 Physical Screening for Suitable Reservoir Properties YES NO Policy Makers and CO 2 Devolpers Preliminary Economic Scoping for Profitability Business-As-Usual or Different EOR Technology YES NO CO 2 Available and/or Planned Business-As-Usual or Different EOR Technology YES NO Detailed Reservoir Modeling and Simulation Delay... Business-As-Usual or Different EOR Technology YES NO Development Plan and Detailed Economic Analysis Business-As-Usual or Different EOR Technology YES NO Final Contracting and Implementation Delay... Business-As-Usual or Different EOR Technology (i) (ii) (iii) (iv) (v) (vi)


4
(1 )")
 C ( Q )")


5 NPV p Q (1 )(1 ) p Q C ( Q ) C ( Q ) T eor o op, eor R SP c cm r cp o lp, eor eor t t t t t t t 1 (1 r) K
6 Incremental Oil Production (HCPV) Dimensionless Incremental Oil Production Analogs Lost Soldier Tensleep & Denver San Andres Denver San Andres Unit (DSA) Lost Soldier Tensleep Unit (LST) 17.4% % Cumulative CO2+Water WAG Injection (HCPV)
7 Incremental Oil Production (HCPV) Dimensionaless Oil Production Analog Curves Actual DSA (17.5% HCPV) % % % Scaled DSA (Monte Carlo Distribution) Cumulative CO2+Water WAG Injection (HCPV)
8 Cum. Produced/Injected (HCPV) Wasson-Denver San Andres Dimensionless Analog Location: West Texas Source: KM San Andres Model Water Injected CO2 Injected CO2 Produced Incremental Oil % Cum. CO2 + Water Injection (HCPV)
9 Cum. Produced/Injected (HCPV) Lost Soldier-Tensleep (S.Wo) Dimensionless Analog Location: Central Wyoming Source: Shaochang Wo Projected to 2.98 HCPVs Water Injected CO2 Produced CO2 Injected Cum. CO2 + Water Injection (HCPV) Incremental Oil 11.11% 12.39%
10 Oil (Mmbo) CO2 and Incremental Oil Incremental Oil Production (Mmbo) CO2 Injected (Bcf) CO2 Purchased (Bcf) CO2 (Bcf) Project Term (Years)
11 Oil (Mmbo) CO2 and Incremental Oil Incremental Oil Production (Mmbo) CO2 Injected (Bcf) CO2 Purchased (Bcf) CO2 (Bcf) Project Term (Years)


12
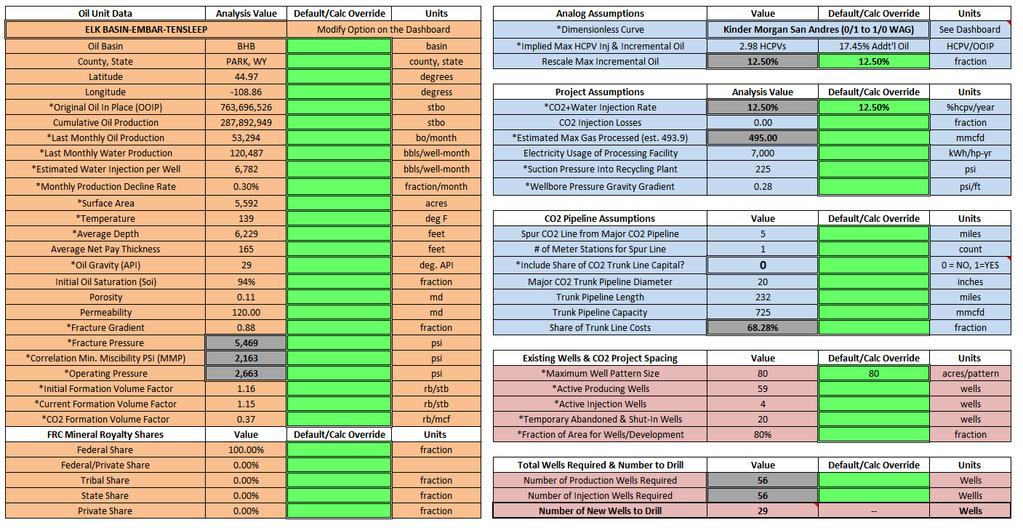
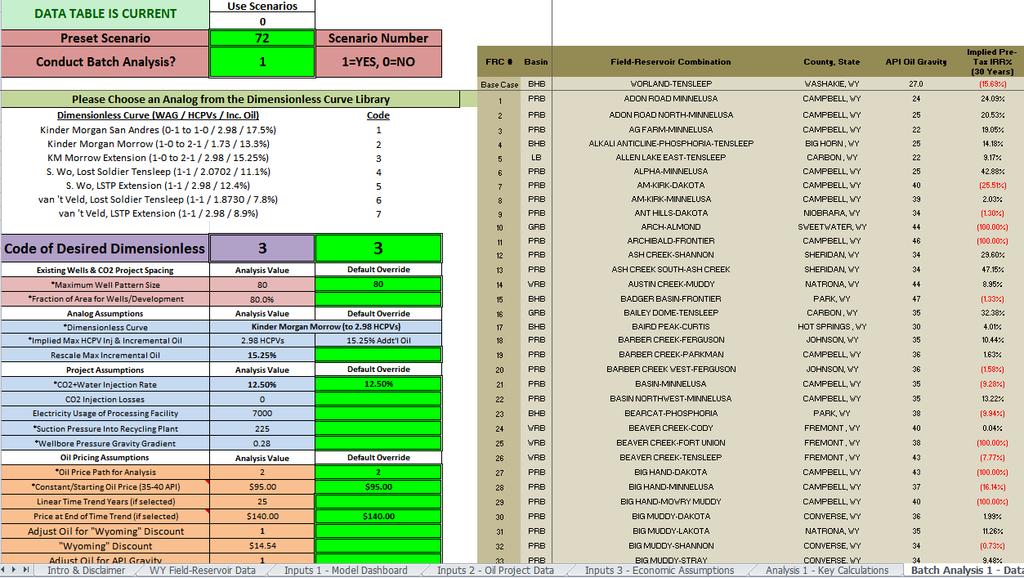
13 Excel Demonstration

14
15

16

17
18
19
20 Cum. Incremental Oil Production (HCPV) 0.20 Dimensionless Curves (HCPV) Analog Library % 15.3% % 11.1% 12.4% % 8.9% Kinder Morgan San Andres (17.5%) Kinder Morgan Morrow (13.3%) KM Morrow Projected (15.3%) S. Wo, Lost Soldier Tensleep (11.1%) S. Wo, LSTP Projected (12.4%) van 't Veld, Lost Soldier Tensleep (7.8%) van 't Veld, LSTP Projected (8.9%) Cum. CO2 + Water Injection (HCPV)
21 Oil (Mmbo) CO2 and Incremental Oil Incremental Oil Production (Mmbo) CO2 Injected (Bcf) CO2 Purchased (Bcf) CO2 (Bcf) Project Term (Years)
22 Jobs / Annual Person-Years WY Employment Contribution from CO2-EOR Operations Total Project Life Job-Years 3,893 GRIEVE-MUDDY Induced (Govt/Royalties) Induced Jobs (Industry) Indirect Jobs Direct Jobs Avg (First 10 Years) Up-Front Capital Investments 0 CO2-EOR Extraction Operations (first 30 years)


23

24


25 WTI Oil Price ($ per barrel) $250 $240 $230 $220 $210 $200 $190 $180 $170 $160 $150 $140 $130 $120 $110 $100 $90 $80 $70 $60 $50 $40 Low-Baseline $80 WTI Oil 897 MMstbo Cumulative Economic CO 2 -EOR Incremental Oil Wyoming's Miscible Main Pay Zones Mid-Baseline $110 WTI Oil 1,008 MMstbo LSTP-van 't Veld* 8.9% Inc. Oil High-Baseline $140 WTI Oil 1,053 MMstbo LSTP-S.Wo* 12.4% Inc. Oil KM-Morrow* 15.3% Inc. Oil KM-San Andres* 17.5% Inc. Oil 25-Acre Wells, 15% HCPV/Year 40-Acre Wells, 12.5% HCPV/Year Cumulative Economic Incremental Oil (Mmstbo)

26


 Anthropogenic $5.00/Mcf CO2 4.")


27 CO2 Price ($/Mcf) $8.0 $7.5 $7.0 $6.5 $6.0 $5.5 $5.0 $4.5 $4.0 $3.5 $3.0 $2.5 $2.0 $1.5 $1.0 $0.5 $0.0 Cumulative CO2 Purchase Demand Wyoming's Miscible Main Pay Zones $80 WTI Oil $110 WTI Oil $140 WTI Oil LSTP-S.Wo* (25-Acre Wells, 15% HCPV Inj/Yr, 12.4% Inc. Oil) Anthropogenic $5.00/Mcf CO2 4.4 to 5.5 Tcfs 834 to 992 Mmstbo Low-Baseline $2.10/Mcf CO2 4,713 Bcfs 897 MMstbo High-Baseline $3.30/Mcf CO2 6,032 Bcfs 1,053 MMstbo Mid-Baseline $2.70/Mcf CO2 5,667 Bcfs 1,008 MMstbo Cumulative CO2 Purchased (Bcf)

28 BHB PRB WRB OTB SB GRB HB LB DB
29 Apply Monte Carlo Analysis New database, new cost estimates Peer-Reviewed Journals Extend to other EOR Technologies Nitrogen, Methane, Chemical flooding.
30 Immiscible or Alternate Gas Injection Should be able to adapt the CO 2 model Same process technical screen economics Immiscible reduces technical threshold Immiscible CO 2 could yields another Mmbo (Wo et al., 2009) CO 2, Nitrogen, Natural Gas or Flue Gas Natural gas currently cheaper than anthropogenic CO 2 CO 2 supply constraint easier to get N 2 or CH 4?
31 Adapting the CO 2 Analog Approach Many costs are likely similar, but... Need injection profiles and productivity relationships! Also information on how these types of floods would be designed: well requirements, compression facilities? Need information on the cost of supplying Nitrogen Collaboration with Praxair, Linde, and AirProducts


")


32 Barrels of Oil Produced (Monthly) 400, , , , , , ,000 50,000 Painter Reservoir East - Nugget (Production=73.5 MMbo, Depth=11,000 feet, API=52) August 1991 OGC Nitrogen Values Incremental ~7.9 MMstbo (10-11%) Stopped Injecting? Stopped Reporting? Nitrogen Injection (Millions (cu. feet?) Month

33 CH4 EOR Embar/Tensleep, 30 o API, 6250ft, 138 o F Madison, 30 o API, 5500ft, 140 o F Frontier, 43 o API, 2000ft, 85 o F Sundance: Gas, 4450ft, 115 o F Dakota: Gas, 3600ft, 105 o F ~5.65 MMbbl
34 Oil (bbls) and Water (bbls) Gas (Mcf) 1/1/1976 2/1/1978 3/1/1980 4/1/1982 5/1/1984 6/1/1986 7/1/1988 8/1/1990 9/1/ /1/ /1/ /1/1998 1/1/2001 2/1/2003 3/1/2005 4/1/2007 5/1/2009 6/1/2011 Price per Mcf ($) 350, , ,000 CH4 EOR 12,500 ft, 230 o F Frontier, 42 o API, Frontier-Dakota 38 o API Muddy 48 o API + Gas Sand Dunes Field $12 $11 $10 $9 $8 $7 $6 $5 $4 $3 $2 $1 $0 US Average NG well head price NG well head price (nominal) NG well head price (2011 $) Date 1,400,000 1,200,000 1,000, , , ,000 Oil Bbls Gas Mcf Gas Inj Mcf Water bbls 800, , ,000 50, , Date
35 Resource Management Plans National Environmental Policy Act (NEPA) How will lands be managed Mineral development and economic impacts Current versus Future Impact What is the current economic contribution of EOR? What is the potential future economic contribution?
36 Royalty and Severance Revenues ($MM) Sources: WY CREG (Oct. 2012) DOE-EIA Mineral Prices $1,400 $1,200 $1,000 $800 $600 $400 $200 $0 WY Crude Prices (Mcfe) WY Gas Prices (Mcf) Wyoming Mineral Royalties & Severance Taxes Contribution of Oil and Gas Federal Mineral Royalties & Coal Bonus Severance Taxes Down 16-23% from 2008 NG Severance Oil Severance $16 $14 $12 $10 $8 $6 $4 $2 $0 Oil/Gas Price ($/Mcfe)
 3,269,495 2,154,691 10,699,231 Lost Soldier/Wertz (80s) 1,960,419 1,915,272 65,806,478 Totals 7,866,664 6,592,427 86,446,181")
37 CO2 Project 2011 Production 2011 Incremental Cumulative Incremental Beaver Creek Madison ( 08) 1,373,661 1,270,471 2,459,387 Patrick Draw Monell ( 03) 1,263,089 1,251,992 7,481,084 Salt Creek - WC2 ( 04) 3,269,495 2,154,691 10,699,231 Lost Soldier/Wertz (80s) 1,960,419 1,915,272 65,806,478 Totals 7,866,664 6,592,427 86,446, % 12.1%
38 Contribution of Incremental Oil Extraction IS included? Est. Value of Incremental Oil Est. Value of Purchased CO 2 Royalties, Severance & Ad Valorem NOT included (for now)? Capital Infrastructure i.e. Greencore Pipeline (~$325M) Ad Valorem on the CO 2 Pipelines Sales & Use Taxes
39 Direct Impacts Jobs, incomes, and value added within the oil & gas industry. Indirect Impacts Jobs, income, and value added occurring throughout the supply chain for the oil & gas industry. Induced Impacts Jobs, income, and value added from household spending of income earned. Government spending also report as induced.
40 Fiscal Item Beaver Creek Patrick Draw Salt Creek Lost Soldier & Madison Monell Unit Wall Creek 2 Wertz Totals Est. Incremental Oil Est. Oil Price $83.45 $83.45 $83.45 $83.45 $83.45 Incremental Revenue $ $ $ $ $ Estimated CO2 Purchases 36 MMcfd 41 MMcfd 114 MMcfd 30 MMcfd 221 MMcfd CO2 Delivery Cost $2.17/Mcf $2.17/Mcf $2.17/Mcf $2.17/Mcf $2.17/Mcf CO2 Supply Cost $28.51 $32.47 $90.29 $23.76 $ Royalties to Fed Gov t $1.45 $3.69 $9.08 $5.25 $19.46 Royalties to WY $15.30 $3.73 $11.23 $4.84 $35.10 Private Royalties to HHs $0.00 $8.58 $4.32 $14.84 $27.73 Severances to WY $5.36 $5.31 $9.31 $8.09 $28.07 Ad Valorem to Counties $6.47 $6.41 $10.84 $9.85 $33.57 Total Mineral Payments $28.57 $27.72 $44.77 $42.87 $ State/Local Education $10.25 $6.09 $12.04 $9.04 $37.41 State/Local General $12.06 $6.08 $13.00 $8.85 $39.99 State/Local Investment $2.68 $1.16 $2.62 $1.67 $8.14 Private HHs k $0.00 $2.23 $1.12 $3.86 $7.21 In-State Mineral Payments $24.98 $15.57 $28.78 $23.42 $92.75 Share Spent In-State 87.45% 56.15% 64.29% 54.62% 64.44%


41 Fiscal Item Beaver Creek Patrick Draw Salt Creek Lost Soldier & Madison Monell Unit Wall Creek 2 Wertz Totals Est. Incremental Oil Est. Oil Price $83.45 $83.45 $83.45 $83.45 $83.45 Incremental Revenue $ $ $ $ $ Estimated CO2 Purchases 36 MMcfd 41 MMcfd 114 MMcfd 30 MMcfd 221 MMcfd CO2 Delivery Cost $2.17/Mcf $2.17/Mcf $2.17/Mcf $2.17/Mcf $2.17/Mcf CO2 Supply Cost $28.51 $32.47 $90.29 $23.76 $ Royalties to Fed Gov t $1.45 $3.69 $9.08 $5.25 $19.46 Royalties to WY $15.30 $3.73 $11.23 $4.84 $35.10 Private Royalties to HHs $0.00 $8.58 $4.32 $14.84 $27.73 Severances to WY $5.36 $5.31 $9.31 $8.09 $28.07 Ad Valorem to Counties $ $3.99 M $6.41 to PWMTF $10.84 $9.85 $33.57 Total Mineral Payments $28.57 $27.72 $44.77 $42.87 $ State/Local Education $10.25 = $96.74 $6.09 Million $12.04 $9.04 $37.41 State/Local General $12.06 $6.08 $13.00 $8.85 $39.99 State/Local Investment $2.68 $1.16 $2.62 $1.67 $8.14 Private HHs k $0.00 $2.23 $1.12 $3.86 $7.21 In-State Mineral Payments $24.98 $15.57 $28.78 $23.42 $92.75 Share Spent In-State 87.45% 56.15% 64.29% 54.62% 64.44%
42 Type of Impact Beaver Creek Madison Patrick Draw Monell Unit Salt Creek Wall Creek 2 Lost Soldier & Wertz Totals Total Contribution Employment Labor Income $20.92 M $17.1 M $33.47 M $23.81 M $95.29 M Income per Job $54,097 $55,859 $56,524 $55,206 $55,527 Value Added $ M $ M $ M $155.8 M $ M Multipliers Employment Labor Income Income per Job Value Added


43 Type of Impact Beaver Creek Madison Patrick Draw Monell Unit Salt Creek Wall Creek 2 Lost Soldier & Wertz Totals Total Contribution Employment Labor Income $20.92 M $17.1 M $33.47 M $23.81 M $95.29 M Income per Job $54,097 $55,859 $56,524 $55,206 $55,527 Value Added $ M $ M $ M $155.8 M $ M Multipliers ~0.60% of NF Employment Employment Labor Income NFE = 285, Income per Job Value Added Jobs 1.25/ 1 Million 1.24Barrels
44 Revise the 2011 Report Lower CO 2 Price Overriding Royalties on Fed Lands Complete a New Report for 2012 Survey EOR companies for capital expenditures (will they respond???) Waiting for OGC to publish production numbers Use Scoping to Assess Future Contribution Make assumptions about the timing of the projects? More straight forward to estimates 30 year average
45 Subsidies, Taxes and Bargaining Lab experiments suggest that bargaining outcomes may change depending on which side of the market is taxed or subsidized. Who benefits from CO 2 incentives? Limited (or no) funds from EORI at this point, but we do have some SER grant money to help with this. Owen Phillips, Ben Cook, Dale Menkhaus, Chris Bastian, and John Strandholm

46 Tying Contracts Under what conditions is it optimal to enter into contracts where the cost of the production input (CO 2 ) is tied to the price of the output (oil)? We are also seeing these contracts in value-added activities such as Gas-to-Liquids Favored explanation is that tying contracts mitigate the price risk of producers allowing projects with high sunk costs to come online faster than otherwise. Klaas van t Veld, Owen Phillips, Shen Gao, Ben Cook

47