Low Carbon Society Development towards 2030 in Gyeonggi, Korea
|
|
|
- Virgil Hall
- 5 years ago
- Views:
Transcription


1 The 18th AIM International Workshop, NIES, JAPAN Low Carbon Society Development towards 2030 in Gyeonggi, Korea DongKun LEE, Chan PARK Seoul National University, National Institute of Environmental Research
2 Index LCS for Gyeonggi province - Background - Scope - Method - LCS vision - LCS Measures - GHG emission - Mitigation Contribution - Future plan Researches in NIER - LCS for Seoul - Food mileage(carbon footprint)


3 Background National GHG reduction goal - 30% reduction below BAU projection by 2020 Role for Local Government - Main carbon emitters and the key force to solve the problems - Carbon emission reduction targets Me First : low carbon life style - Research needs to quantify the impacts of low carbon life style Forecasting the GHG emission and assessment of potential GHG reduction in Gyeonggi province 3
 Temperature : 11 13 (annual average) Precipitation : 1,100mm (annual average) Population :12 million-people (rapid increase in population)")
4 Background(Gyeonggi province) Location : Western central region longitude : 126 ~ 127 latitude : 36 ~ 38 Area : 10,138 Km 2 (10% of Korea s territory) Climate : continental climate (severe differentiation of temperature between summer and winter) Temperature : (annual average) Precipitation : 1,100mm (annual average) Population :12 million-people (rapid increase in population) Economy : 169 billion-krw(2005) / 20.3% of total GDP 4

5 Background(Gyeonggi province) Landuse, 0.9 Waste, 0.9 GHG emission : 26.5(2005) MtC Annual Growth rate : 6.5% Process, 4.0 Industrial process > Waste > Energy Energy, Annual Growth rate Energy Process Landuse Waste Total % 8.1% 7% 3.1% 100% % 15.2% 3.3% 3.3% 100% 7.9% 25.1% -1.1% 9.7% 8.8% 5

 Building")


6 Background(Gyeonggi province) High urban development pressures and Deforestation (2010 ~ 2020) Building permission : 25 km 2 /1 year Construction : 150,000(household) / 1 year Settlement Field Forest Grassland Wetland Bareland Water Urban Renewal Promoting Site (Source : Gyeonggi province) 6

 Impact Factor: Human Activity, Climate Change,")
7 Scope Emissions : CO 2 Regions : Gyeonggi province, South Korea Base year : 2005 Target year : 2030 Sectors : Industrial, Residential, Commercial/public, Transport, Land use (Soil, Vegetation) Impact Factor: Human Activity, Climate Change, Land-use change 7
8 Methods 8
9 LCS vision To be a sustainable low carbon city in line with national policies Ready for future and resilient to change Conservation and green orient for quality of life Economic and social competitive clean and green industries Efficient transport system Community participation in city development Reduction Target (Gyeonggi Province) 30% of 2020 BAU Emissions 9
10 The Scenarios Business As Usual (BAU) scenario - The present trend in Gyeonggi has been considered with existing technology and prevailing economic and demographic trends. - The BAU scenario for future energy consumption and emissions projection, and capture forecast for various economic, demographic, land use and energy use indicators. Low Carbon Society (LCS) scenario - The energy consumption trajectory / emissions trajectory are drawn in all the sectors that would result from aggressive policies to promote demand side management, energy efficiency, development of renewable energy, and other policies to promote sustainable development. 10
11 Socio-economic Scenarios BAU 2030/2005 Population(million) 10,6 14, Number of households(million) GRDP (billion KRW) Industrial structure Primary Secondary Tertiary Passenger transport demand(b.p.km) Freight transport demand(b.t.km) Settlement Land use (Km 2 ) Rice field Crop field Forest Grassland Bare land Other
12 Climate Change Scenario Average

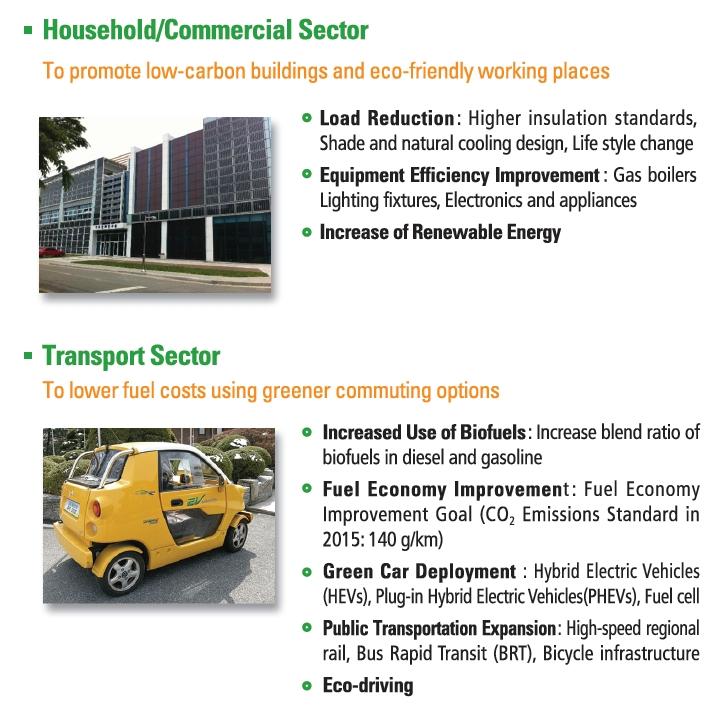
13 LCS measures 13
14 LCS measures Measures Factors Quantification Energy-efficient devices Technological efficiency increased Renewable Energy Passenger transportation structure Building insulation Heat energy demand decreased 5% Electric power production Energy Mix Geothermal houses Heating fuel composition changed 1% Solar heat Heating fuel composition changed 5% Transportation demand decreased Expansion of public transportation methods Technological efficiency improvement Reduction in traffic per day 10% Transportation method changed 10% High-efficiency, eco-friendly car increased 20% Compact city structure Transportation distance reduced 5% Freight transportation structure Energy conservation action Utilization of freight trains Transportation methods changed 10% Technological efficiency improvement High-efficiency, eco-friendly car increased 3~10% Household Decreased demand for energy service 10% Commercial Decreased demand for energy service 5% 14
15 GHG emissions CO 2 emission (MtC) Base year BaU CM CO 2 emission (MtC) Residential Commercial Industry Passenger Freight Emission by sectors Landuse change Freight transport Passenger transport Industry Commercial Residential Base year BaU CM 15
16 GHG Emissions by GRDP / per Capita Base year BaU CM Residential Residential Commercial Industry Passenger Freight tc/person tc/household tc/krw(10billion) tc/krw(10billion) tc/person tc/krw(10billion) 16
17 Mitigation Contribution 2030 BAU vs 2030 CM RES COM IND PTS FTS GI Park Forest Energy-efficient device Modal share Carbon intensity Energy-efficient device Energy saving behavior Carbon intensity Energy-efficient device Carbon intensity Energy-efficient device Energy saving behavior Carbon intensity Energy-efficient device Energy saving behavior CO2 emission (MtC) Residential & Commercial Sectors Efficiency Improvements in End Use Devices Fuel Switch Behavioral Changes New Technology Adoption & Retrofitting Improved Material Efficiency in Buildings Change in the Nature of Power Supply Transport Sector Technology Efficiency Improvements Fuel Switch Improved Traffic Management Shift to Public Transport Implementing Integrated Transport Industrial Sector Technology Efficiency Improvements Fuel Switch 17
18 Mitigation Contribution CO2 emission (MtC) (10.00) 22 Reductions potential Forestry % Modal share 3% Carbon intensity 8% Energy-efficient device Energy saving behavior Emission by sectors Landuse change Freight transport Passenger transport Industry Commercial Base year BaU CM Residential 4% 7% 18
19 Future plan Developing Road Map for LCS Actions Establish reduction target by sector and implementation target action plans Propose the detailed countermeasures and action plan Perform follow-up actions to establish detailed reduction amount by sector Suggest the methodology to local Authorities for development of LCS vision 19
20 LCS for Seoul Socio-economic Scenarios - Population : 2010 (10.0 million people), 2020 (10.1 million people) - Household : 2010 (3,445 thousand household), 2020 (3,798 thousand household) - GRDP : 2010 ~ 2016 (4.2%), 2017 ~ 2020 (3.9%) Population Household 3,900 3,800 3,700 GRDP (billion KRW) ,600 3,500 3,400 3, , Million 가구 Population 인구 Household ( 명 ) Population : Statistics Korea GRDP growth : Korea Development Institute 20
21 LCS for Seoul Million Metric Tonnes CO2 Equivalent Business As Usual Household 60 Commercial 50 Transport Industry 40 Waste 30 LULUCF Industriral Process 20 Agriculture % 37 % Avoided vs BAU Household Commercial Transport Industry Industriral Process Agriculture Waste LULUCF BAU 소극적시나리오 CM1 적극적시나리오 CM2 Emission : 1.2 times (Vs 2007) Reduction potential (Gyeonggi Province) 18% of 2020 BAU Emissions(CM1) 37% of 2020 BAU Emissions(CM2) 21
22 Food mileage CO 2 emission per person - Korea : 2001 (122 kg CO 2 /person) Vs 2010 (167 kg CO 2 /person) Korea Japan France England Food mileage(t km ) = (Q i,j D i ) Q i,j : cargo volume (ton) D i : distance ( km ) CO 2 emission( kg )=Food mileage (t km ) CO 2 emission factor( kg /t km ) Korea Japan England France 22
23 23


24 Thank you 24