Groundwater Recharge Permits Past, Present, Future
|
|
|
- Meghan Parker
- 5 years ago
- Views:
Transcription
 Hoover Ng, Water Replenishment")
1 Groundwater Recharge Permits Past, Present, Future January 22, 2008 Southern California Alliance of POTW (SCAP) Hoover Ng, Water Replenishment District
2 Presentation Outline WRD Past - Montebello Forebay (MF) Groundwater Recharge Project Present MF, Other Projects Future Pending Regulations New Organic Carbon Study Conclusions
3 What is the WRD? Formed in 1959 to protect groundwater basin from overdraft. Serves 4 million people in 43 cities in southern Los Angeles County Uses local runoff, recycled water and imported water for replenishment and protection against seawater intrusion. Groundwater basins produce 250,000 afy, 40 percent of total water supply

4 Water Rec. Plants + Pomona WRP Rio Hondo Spreading Grounds San Gabriel Spreading Grounds Seawater Barriers
5 Montebello Forebay Groundwater Recharge Project with Recycled Water First permitted use of recycled water by percolation 1960, California Regional Water Pollution Control Board No. 4, Los Angeles Region, issued Resolution No , 10 mgd of disinfected secondary effluent, Whittier Narrows WRP. Monitor plant effluent and receiving waters (not specified) 1972, Ca RWQCB, Los Angeles, Order No mgd of disinfected secondary effluent, San Jose Creek WRP Monitor plant effluent Monitor one or more wells a limit of 32,700 afy was established 1987, CA RWQCB, Los Angeles, Order No ,700 to 50,000 afy of disinfected tertiary effluent in steps Monitor plant effluent and receiving waters Maximum percent of recycled water 50 percent
6 Montebello Forebay - Current Permit 1991 CA RWQCB, Los Angeles, Order No year average 50,000 afy, 35 percent recycled water 1 year maximum 60,000 afy, 50 percent recycled water 3 year period maximum 150,000 afy and 35 percent. Disinfected tertiary effluent < MCLs No measurable increase in organics in groundwater. Monitor effluent, headworks to spreading basins, 6 shallow monitoring wells, 19 production wells Monitor for Title 22, and selected NLs.


7 Rio Hondo Spreading Grounds 570 acres San Gabriel Spreading Grounds 130 acres

8 LACSD Treatment Process Since 1977
9 Groundwater Replenishment Forebay (unconfined aquifers) Pressure Area (confined aquifers) Surface Recharge Spreading Basin Ocean Aquifer Bedrock (Pico Formation) Aquifer Aquifer

10 6 monitoring wells 19 production wells

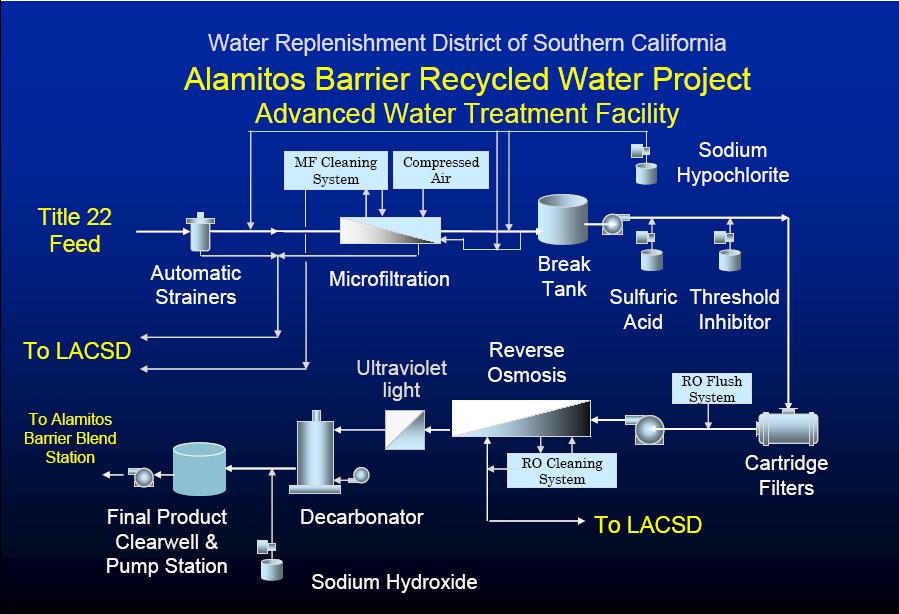
11 Alamitos Barrier Recycled Water Project
12

13 Nearest Drinking Water Well, 4500 feet


14
15 Seawater Intrusion Barrier Coastal Aquifer - Barrier Injection Imported & recycled water Ocean Sea Level Brackish Brackish Water Water Fresh Water Fresh Water Fresh Water
16 Seawater Intrusion Barrier Coastal Aquifer - Barrier Injection Imported & recycled water Sea Level Ocean Brackish Brackish Water Water Fresh Water Stranded Brackish Water (Saline Plume)
17 Agency WRD LADWP/ WRD WRD WBMWD OCWD IEUA Project Montebello Forebay Harbor/ Dominguez Gap Alamitos Barrier West Coast Barrier GWRS Chino Basin Date RWQCB Order R R R R R Type Spreading Injection Injection Injection Injection/ Spreading Spreading Capacity Percent RW Treatment 50,000 afy, 3 yr avg 60,000 afy, 1 yr 5500 afy 3360 afy 35 percent, 3 yr avg 50 percent, 1 yr 50 percent 50 percent Disinfected Tertiary Tertiary + MF, RO, Chlorination DW Standards Notification Levels Total nitrogen TOC Turbidity, ph Basin Objectives Disinfected Tertiary + MF, RO, UV DW Standards Total nitrogen TOC Turbidity, ph Conductivity Basin Objectives initial, 14,000 afy ult, 17,500 afy Initial 75 percent Ultimate 100 percent Secondary Effluent + MF, RO, AOP w/uv, H2O2 DW Standards Total nitrogen TOC Turbidity, ph Conductivity Basin Objectives 78,400 afy Initial 75 percent Ultimate 100 percent Secondary Effluent + MF, RO, AOP w/ UV, H2O2 DW Standards Total Nitrogen TOC Turbidity, ph Oil and Grease Recycled Water Quality Limits DW Standards Diluent Water Quality Limits when blended, NO2, NO3 NO2, NO3 NO2, NO3 NO2, NO3 Groundwater Quality Wells Constituents Monitored Buffer Zones No measurable increase in organics 2 headworks 6 shallow wells 19 production wells Title 22 selected NLs 7 wells, 3 mo travel, 3 zones 5 wells, 1/4 distant, 5 zones 3 wells, 1/2 distant, 3 zones Title 22 NLs Priority Pollutants Pharm, EDC (RW only) TIC (RW only) 4 wells, 3 mo travel, 4 zones 4 wells, 1/4 distant, 4 zones 9 wells Title 22 NLs Priority Pollutants Pharm, EDC (RW only) TIC (RW only) Zone A, 2000 feet Zone B, 9000 feet 2000 feet 2000 feet Nearest Production Well <100 feet 9000 feet 4000 feet 7400 feet Other reqts Tracer study, Groundwater model Comparison of Water Recycling Permits Tracer study, Groundwater model Title 22 Unregulated Chemicals Priority Pollutants Pharm, EDC (RW only) TIC (RW only) Same as RW. injection, 19 wells spreading, 5 wells Title 22 Unregulated Chemicals Priority Pollutants Pharm, EDC (RW only) TIC (RW only) Initial, 8000 afy Ult, 22,000 afy 20 percent Disinfected Tertiary DW Standards TDS Total Inorg Nitrogen Turbidity, ph Oil and Grease Total Nitrogen Other Nitrogen limits TOC 7 new wells 13 production wells Title 22 Unregulated Chemicals Priority Pollutants Pharm, EDC (RW only) TIC (RW only) 6 months, spreading 2000 ft, 12 mos, injection 500 feet, 6 months Spreading, 5400 feet Injection, 3000 feet 679 feet Expert Panel Groundwater Model Tracer study Expert Panel Groundwater modeling Non permit Groundwater model update tracer study
18 Future Regulations DPH draft, 1/4/07 Recharge/DraftRegulations.pdf Effluent Water Quality Disinfected tertiary Control Nitrogen compounds < MCL Drinking Water Standards < MCLs Diluent Water Quality NO2 and NO3, < MCL Baseline must meet drinking water standards Groundwater Total Nitrogen Total Organic Carbon Extensive Monitoring, inc. emerging contaminants If > 50 percent, Expert Panel required
19 Future Regulations (cont d) - Must provide adequate disinfection, nitrogen removal acute health risks TOC is a surrogate for chemicals of concern, emerging contaminants, future risks For New projects or Expansion of Existing Projects
20 Future Regs Endnote 5, Additional Constituent Monitoring, 9/18/07 Health effects are still unclear, but prudent to start monitoring Use best available analytical methods Suggested constituents for monitoring: Pharmaceuticals acetaminophen amoxicillin azithromycin carbamazepine ciproflaxacin cilantin gemfibrozil ibuprofen lipitor meprobamate sufamethoxazole trimethoprin salicylic acid Industrial endocrine disruptors bisphenol A nonylphenol nonylphenol polyethoxylate octylphenol octylphenol polyethoxylate polybrominated diphenyl ethers Personal Care Products triclosan N,N-diethyl-m-toluamide (DEET) Other caffeine iodinated contrast media tris (2-chloroethyl) phosphate (TCEP)

21
22 Shortcomings of TOC Overall measure of organics from oxidation of all organics in water Unable to partition out chemicals of concern TOC is 3 6 orders of magnitude higher than emerging contaminants, trace organics Drinking water and storm water sources have wide range of TOC Local groundwater 1 2 mg/l Imported surface water 2 3 mg/l Local storm water - 15 mg/l Uncertainty regarding what is appropriate limit for TOC.
23 Findings from Other Studies TOC removal rates Project Montebello Forebay Mound Monitoring USGS, Montebello Forebay Sweetwater Northwest WRP Initial TOC/ DOC mg/l mg/l 4 6 mg/l TOC after soil aquifer treatment mg/l mg/l 2 5 mg/l 2 3 mg/l Percent Removal percent percent percent percent TOC decreases to <4 mg/l in most cases. Montebello Forebay removal rates are better than other studies at <2 mg/l. Residual TOC resemble naturally occurring matter (NOM) typically found in drinking water.

24 Organic Carbon Studies Montebello Forebay, USGS Sweetwater, Tucson, AZ

25 Other Studies Fox, etal, Northwest Water Reclamation Plant, Mesa, Az
26 Need for New Investigation for Spreading Projects Desire to determine amount of organic carbon removed when only recycled water is percolated. Characterize residual organic carbon naturally occurring matter (NOM) vs. effluent derived organics, mostly biodegradable. If residual organic carbon mostly resembles NOM, then the effluent derived organics have been removed or biodegraded.

27 Recent Study Completed Dr. Jörg Drewes, Colorado School of Mines In November 2006, filled test basin with only recycled water and collected samples on pond surface, after 10 feet and 25 feet of percolation Also, compared results of other water sources through Soil Column tests, 12 feet total Recycled Water, 2 sources Imported water Analyzed samples and characterized nature of organics and compared similarities and differences between water sources.

28 Results of New TOC Study Recycled Water Drinking Water TOC after percolation is same as drinking water and also resembles drinking water TOC.
29 Naturally Occurring Matter (NOM) Characterization Drinking Water contains mostly NOM. Size exclusion chromatography Molecular size distribution Aromaticity 3-dimensional fluorescence excitation/ emission spectroscopy Distinguish between protein-like and humiclike organic carbon groups


30 Recycled Water Drinking Water Surface 1 m 4 m Similar
31 Summary and Conclusions Studies show that TOC of recycled water after percolation decreases to <2 mg/l and resembles drinking water. TOC removal in soil is robust and sustainable. Biodegradation is primary mechanism. Better surrogate than TOC is Biodegradable Dissolved Organic Carbon, BDOC = ΔTOC. In lieu of TOC limit, better to measure BDOC, which will vary at each site. As analytical methods become available, monitor also for trace and emerging contaminants. CDPH is reviewing this new information and will consider BDOC as an alternative to TOC in future regulations for spreading projects.
32 Questions and Comments Contact Hoover Ng, (562)