Energy Availability and the Future of the Fertilizer Industry. Rayola Dougher API Senior Economic Advisor
|
|
|
- Barnard Cannon
- 5 years ago
- Views:
Transcription

1 Energy Availability and the Future of the Fertilizer Industry Rayola Dougher API Senior Economic Advisor

2 Energy: the engine of our economic growth
3 Quadrillion BTU The U.S. will require 10 percent more energy in 2040 and more than half of it will be met by oil and natural gas Hydro Renewables Nuclear Coal Natural Gas Oil 0 Source: EIA
4 U.S. oil and natural gas production is increasing as a result of technological innovations U.S. Crude Oil Production (millions of barrels per day) U.S. Natural Gas Marketed Production (billions of cubic feet per day) Note: Bars in orange show EIA s Short-term Energy Outlook forecast. Source: Energy Information Administration.
5 Shale resources are widely dispersed across the U.S.

6 New technology allows for additional access to resources

7 The technology is designed to protect the environment
8 What Administration officials have to say about hydraulic fracturing Former Interior Secretary Ken Salazar (Sept 2013) Hydraulic fracturing is creating an energy revolution in the United States. I would say to everybody that hydraulic fracturing is safe. Former Energy Secretary Steven Chu (Sept 2013) Drilling for shale gas can be done safely. Then-EPA Administrator Lisa Jackson in 2012: In no case have we made a definitive determination that the fracking process has caused chemical contamination of groundwater.

9 Shale production is offsetting declining production from other U.S. oil and natural gas resources
10 Jan-07 Jan-08 Jan-09 Jan-10 Jan-11 Jan-12 Jan-13 Nov-13 Price Index: January 2007 = 1.0 The price of natural gas has fallen relative to crude oil Changes in the price of crude oil and natural gas Crude Oil (WTI) Natural Gas (Henry Hub) 0.0 Source: EIA
11 $/Mmbtu Rising US natural gas output pushed natural gas prices to record discounts against international gas prices Japan LNG German Import Price U.K U.S. Henry Hub 2 0 Source: BP Statistical review of World Energy 2013.
12 Dollars per material short ton Average US farm prices of selected fertilizers $900 $800 $700 $600 $500 $400 $300 $200 $100 $0 Anhydrous ammonia Nitrogen solutions (30%) Urea 44-46% nitrogen Ammonium nitrate Sulfate of ammonium Super-phosphate 44-46% phosphate Diammonium phosphate ( ) Potassium chloride 60% potassium Source: USDA
13 Industrial production expands in response to competitive advantage of low natural gas prices Industrial production benefits from strong growth in shale gas production Lower natural gas prices lower costs of both raw material and energy Chemical and fertilizer facilities are seeing increased utilization with lower natural gas prices Energy-intensive industry can be more competitive in the global market
14 Shale energy can lead to American prosperity American consumers annual savings due to lower gas prices resulting from shale energy development (IHS Global Insight)
15 EIA estimates of Midwest expenditures for heating fuels Share of Midwest homes by primary space heating fuel 2% Natural gas Last winter $638 $703 This winter 1% 8% 21% 68% Natural gas Heating oil Propane Heating oil Propane Electricity $953 Electricity Wood $971 $1,333 $1,469 $2,092 $2,006 Source: EIA


16 Shale development equals more jobs Construction Industry Drilling Industry Chemical Industry Trucking Industry Hospitality Industry Steel Industry
17 Oil and natural gas jobs pay well (average annual wages) Oil and natural gas extraction $152,101 Pipeline transportation $111,080 Drilling oil and gas wells Support activities for oil and gas Oil and gas pipeline construction U.S. average $90,252 $80,003 $66,542 $49,289 Source: U.S. Quarterly Census of Employment and Wages, 2011.

18 Shale development equals more government revenue Contributed $74 billion in 2012 and expected t grow to $126 billion by On cumulative basis, estimated to generate $1.6 trillion in tax revenue between
19 Henry Hub $/MMBTU EIA forecasts relatively low natural gas prices for decades Forecast Source: EIA
20
21 Dollars per gallon $5.00 Changes in gasoline and diesel prices mirror changes in crude oil prices Average prices as of December 5, 2013 Crude Oil $2.32 Gasoline $3.26 Diesel $3.85 $4.00 $3.00 $2.00 $1.00 $- Sources: NYMEX (WTI crude oil) and AAA (gasoline and diesel)

22 Many factors affect the price of oil, but in the end it comes down to supply and demand Source: EIA
23 Thousands barrels per day Estimated unplanned OPEC crude oil production outages (thousands barrels per day) 3,000 2,500 2,000 1,500 1, Iraq Nigeria Libya Iran 0 Jan 2011 Jul 2011 Jan 2012 Jul 2012 Jan 2013 Jul 2013 Source: EIA, Short-term Energy Outlook, November 2013
24 World crude oil and liquid fuels production growth million barrels per day 2.0 Forecast OPEC countries North America Russia and Caspian Sea Latin America North Sea Other Non-OPEC Source: Short-Term Energy Outlook, November 2013
25 United States Canada China Colombia Russia Brazil Malaysia Vietnam Kazakhstan Other North Sea Gabon Oman Egypt Australia India Sudan Mexico Azerbaijan Norway United Kingdom Syria Non-OPEC crude oil and liquid fuels production growth (million barrels per day) Source: Short-Term Energy Outlook, November 2013
26 For the first time since 1949, the U.S. became a net exporter of petroleum products in Source: EIA
27 70% 60% 50% 40% 30% 20% 10% 0% Crude oil and petroleum product imports have declined as a share of consumption Source: EIA
28

29 87% of federal offshore acreage is off-limits to development

30 Development of Canadian oil sands would benefit the U.S. economy


31 FILLING AMERICA S TANK Within 11 years Canada & U.S. can provide all our liquid fuel needs Sources of liquid fuel supply: % 10% 13% 53% Oil from rest of world Biofuels Oil from Canada US oil production 10% 18% 72% EIA forecast Potential Sources: EIA; Wood Mackenzie
32
33 Voters voice strong support for increased domestic oil and natural gas development Harris Poll Results on Increased U.S. Oil and Natural Gas Development 94% 91% 86% 75% 73% 69% 68% Importance of energy security Lead to more jobs Help lower energy costs Support building Keystone XL pipeline Support O&NG development Support offshore development Increasing energy taxes may hurt consumers Source: Harris Interactive telephone poll, November 6, 2012
34 For more information visit:

35 Why does gasoline fuel cost what it does? 71% 13% 11% 5% Crude Oil Excise Taxes Retailing Refining Source: EIA, based on average October price of $3.34 per gallon
, October")
36 Gasoline prices can vary by state because of the difference in state taxes Combined local, state and federal gasoline taxes (cents per gallon), October 2013
37 Second Quarter 2013 Earnings by Industry (cents of net income per dollar of sales) Pharmaceuticals Beverage & Tobacco Chemicals Computers Electrical Apparel & Leather All Manufacturing Machinery Oil & Natural Gas Furniture Food Textiles Motor Vehicles Iron & Steel


38 Who owns U.S. oil and natural gas companies? Answer: tens of millions of Americans Pension Funds Source: Who Owns America s Oil and Natural Gas Companies, SONECON, October

39 The oil and natural gas industry is one of the most heavily taxed industries in America
40

41 Number of refineries declines but capacity expands

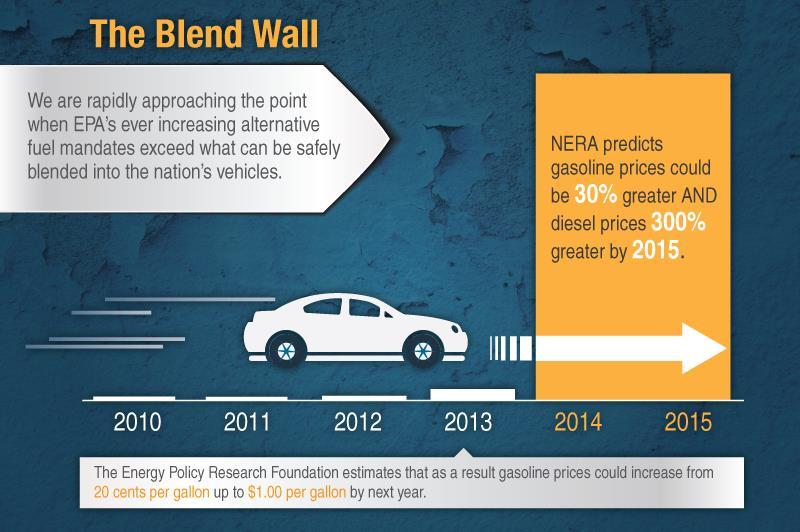
42 Expanding alternative fuels for transportation: current laws
43