Committee on Water. Water Trading and Other Unique Approaches to Addressing Water Shortages and Shifts in Demand
|
|
|
- Geraldine Neal
- 5 years ago
- Views:
Transcription
1 Committee on Water
2 Committee on Water Water Trading and Other Unique Approaches to Addressing Water Shortages and Shifts in Demand


3 Interstate Cooperation to Protect the Colorado River System NARUC Summer Policy Summit July 18, 2017 Chuck Cullom CAP Colorado River Programs

 Lake Powell 1/1/2000 91% Full (25 MAF)")
4 Backbone of the Colorado River System Lake Mead and Lake Powell: 1/1/ % Full (21.3 MAF) 07/17/17 64% Full (15.5 MAF) Lake Powell 1/1/ % Full (25 MAF) 07/17/17 38% Full (9.9 MAF) Lake Mead


5 Central Arizona Project Delivers water to 5 million people in Arizona Provides water for cities, tribes, & irrigation

6 Water Supplies vs Demands A Growing Gap Colorado River Water Supply and Demand Study
 9.")
- 9.6 MAF Evaporation Balance - 0.6 MAF -1.")
7 Annual Imbalance Between Supplies & Demands = Structural Deficit Normal Inflow (Release from Lake Powell plus smaller rivers) 9.0 MAF Normal Outflow (Deliveries to AZ, CA, NV, and Mexico + downstream regulation and gains/losses)- 9.6 MAF Evaporation Balance MAF -1.2 MAF Approximately 12 foot decline in normal year
8 Impacts of the Structural Deficit Results in a decline of 12+ feet in Lake Mead every year when releases from Powell are normal (8.23 MAF) Results in a decline of 4 feet in Lake Mead every year when releases from Powell are balancing (9.0 MAF) Drives Lower Basin to shortage CAP forced to bear obligations of others Evaporation and other system losses Lower Basin s half of Mexican Treaty obligation
9 Consequences of Lake Mead Decline Arizona takes 320 KAF shortage Arizona takes 400 KAF shortage reduction Reductions in hydropower generation Arizona takes 480 KAF shortage reduction Uncertainty about what actions Secretary will take to protect Lake Mead Potential loss of hydropower generation and instability in the electrical grid Active storage in Lake Mead is less than CA s allocation (~4.3 MAF) Run of River operations insufficient storage to meet deliveries to AZ, CA, NV and MX Dead pool; only 2 MAF in storage
10 Lake Mead Elevation (ft) AWBA 1996 P 1,220 1,210 1,200 1,190 1,180 1,170 1,160 1,150 1,140 1,130 1,120 1,110 1,100 1,090 1,080 1,070 1,060 1,050 1,040 1,030 1,020 1,010 1, Interstate Agreements and Projects to Address Declining Reservoir Elevations Lake Mead Elevation (EOM Jan 2000 March '16 and Projected 24 Months) Surplus Guidelines CA QSA (CA to 4.4 MAF) Shortage Sharing (AZ-NV shortages) Brock Reservoir YDP Pilot Run Minute 319 (MX Shortage Sharing) Basin Study Phase Pilot System Conservation 2014 LB Reservoir Protection MOU 2015 Drought Contingency Plan???? 242 Wells Month 2018 Observed Elevation Projected 24 Month First Shortage Level Tier 2 Tier 3
11 Lake Mead Elevations Treading Water! Conservation

12 Pilot Drought Response Action MOU Voluntary development of water in Lake Mead To reduce risks of reaching critically low elevations in Lake Mead Creation of Protection Volumes in MOU USBR = 50 kaf SNWA = 45 kaf MWD = 300 kaf CAP = 345 kaf 9 12
 4 Cities Glendale Peoria Phoenix")
13 CAP Cooperative MOU Programs 12 Ag Participants Tonopah IDD Roosevelt WCD Queen Creek IDD New Magma IDD Hohokam IDD Maricopa-Stanfield IDD Central Arizona IDD Kai Farms BKW Farms Maricopa Water District Salt River Project Yuma Mesa IDD (on-river) 4 Cities Glendale Peoria Phoenix Scottsdale
14 MOU: Ag Forbearance Programs Ag Forbearance 1 CAP agricultural districts in Central Arizona To qualify, a district must have accepted full delivery of their Ag Pool Water during Must agree to forbear at least 23% of their Ag Pool Water but less than 75% or 20 kaf, which ever is less In exchange for accepting a reduced delivery, the district would receive a reduced pumping energy charge for any remaining Ag Pool deliveries For 2015, a savings of $17 per AF For 2016, a savings of $19 per AF CAP modified its policy to not re-market forborne water ADWR stated this forbearance does not impact a district s ability to serve as a Groundwater Savings Facility

15 MOU: Ag Forbearance Programs Ag Forbearance 3 Forbearance of remaining Ag Pool Water by some districts in 2016 Policy flexibility through these Forbearance programs Allowed access to less expensive water sources GSF water These additional forbearances would be at no cost to CAP

16 MOU: Supply Replacement Program Glendale Peoria Phoenix Scottsdale No cost to CAP Received a local supply in lieu of a portion of their CAP allocation This local supply was CAP credits that were stored in the SRP system 16
17 MOU: CAGRD-YMIDD Fallowing Farmers paid to voluntarily fallow lands that would otherwise be farmed Total fallowed land ~ 1,500 acres (~10% of irrigated acres within District Qualified land must have produced crops in 4 out of 5 previous years Enrollment capped at 15.7% of total irrigated acres (10% for large landowners) Conserved water saved as System Water in Lake Mead Pilot project lessons learned: Identification of legal land ownership issues Method for quantification of conserved water Proof that temporary agricultural to urban water transfers could be possible Fallowing programs can have System benefits 17


18 MOU: Intentional Creation of System Water Unused on-river water Water that that is available to be diverted by CAP CAP deferred this diversion to create System Water Unused CAP water Water ordered but not taken by a CAP customer CAP elected to not re-market this unused water CAP deferred this diversion to create System Water 18
19 Pilot System Conservation Program Determine whether system conservation programs can be effective to partially mitigate drought impacts Water users would be compensated for voluntary reductions in water use Partners make monetary contributions to implement the program Funds can be expended across the Basin 19
20 PSCP Funding and Basin Support Phase 1: BOR = $3M CAP = $2M SNWA = $2M MWD = $2M Denver Water = $2M Phase 2: BOR = $5.2M CAP = $1M SNWA = $1M MWD = $1M Total = $11M $8.25M for Lower Basin $2.75M for Upper Basin Total = $8.2M $7.2M for Lower Basin $1.0M for Upper Basin 20
21 PSCP: Key Factors in Project Selection Geographic diversity Upper and Lower Basin $/AF proposal to create system conservation Diversity in sector Ease of implementation Minimal 3 rd party impacts Degree of conservation certainty and ability to verify Opportunities to test new approaches 21

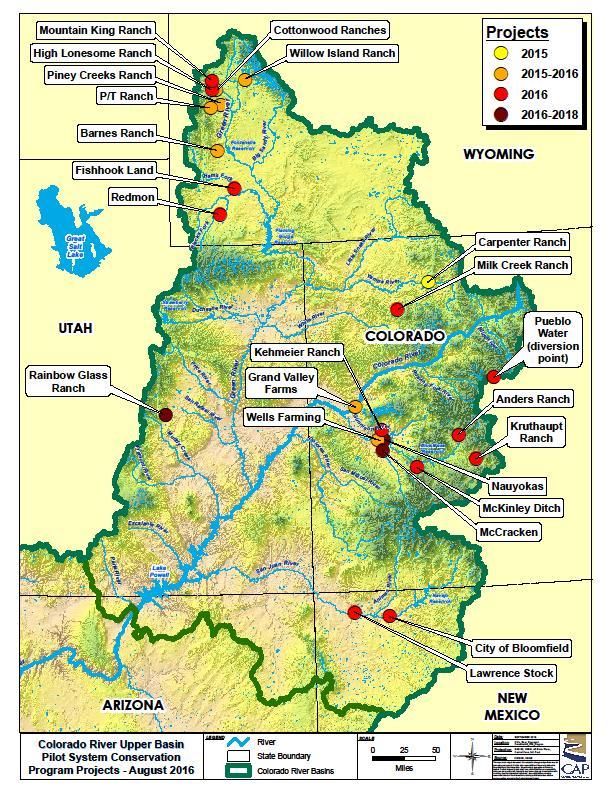
22 Pilot System Conservation Projects 22
23 Lake Mead Elevations Treading Water! Conservation
24 Conclusions Successful Programs! The MOU and PSCP have helped to protect the reservoir elevations and change the slope Broad range of participants From Upper and Lower Basins Different institutional frameworks Agricultural, Municipal, Industrial and Tribal participants Federal and State agencies and water provider agencies from Upper and Lower Basins Projects of different scales Still more that needs to be done

25 Questions 25

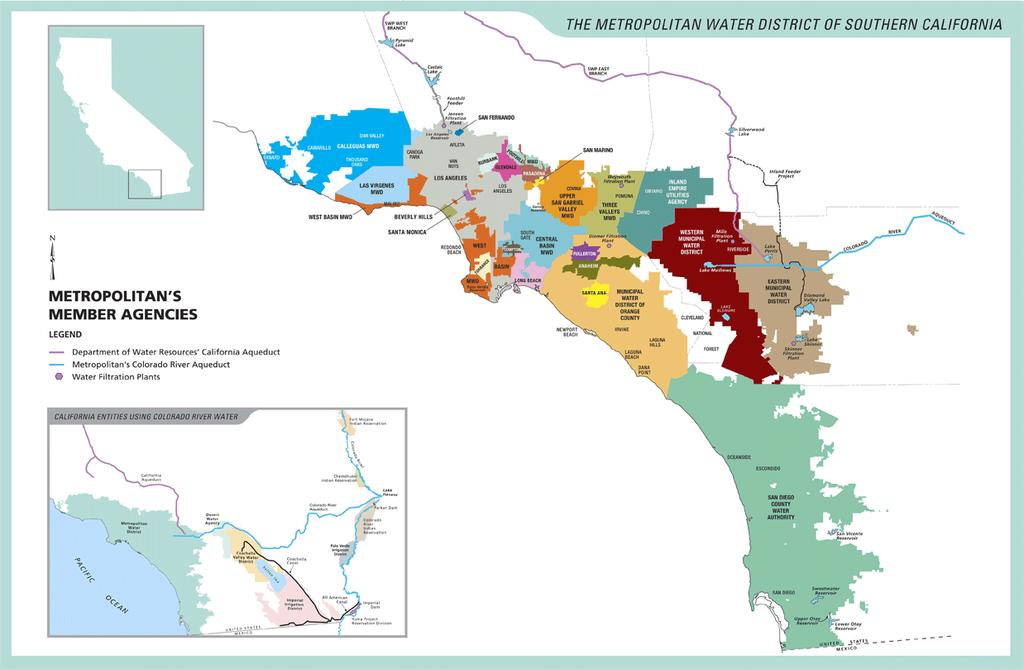
26 Metropolitan Water District of Southern California Regional water wholesaler to 6 counties 5,200 square mile service area 26 Member Agencies 19 million residents Retail demand: 4 million acre-feet Metropolitan provides about one-half of demands
27
28 3,000,000 Metropolitan Water Deliveries 2,500,000 2,000,000 1,500,000 1,000, ,
29 Colorado River Water Rights CA apportionment = 4,400,000 afy MWD junior priority = 550,000 afy MWD Aqueduct = 1,250,000 afy 700,000 af shortfall covered by unused AZ and NV apportionment through 1990s MWD currently relies on banking/transfer programs to provide Colorado River supplies
30 Colorado River Programs 1988 Imperial Irrigation District conservation = 105,000 afy 1999 Interstate Banking regulations = 330,000 af 2003 Quantification Settlement Agreements = 278,000 afy 2004 Palo Verde Irrigation District fallowing = 130,000 afy 2007 Intentionally Created Surplus = 85,000 af Total additional supply ~ 500,000+ afy
31 State Water Project Rights MWD contract entitlement = 1,911,500 afy MWD average deliveries = 1,200,000 afy Annual deliveries vary dramatically: 2003/04 fiscal year = 2,200,000 af 2014/15 fiscal year = 635,000 af MWD relies on banking/transfer programs to provide State Water Project supplies

32 Department of Water Resources Sierra Snow Survey May 1, 2014
33 State Water Project Programs Banking programs provide groundwater storage: Total storage capacity = 950,000 af 2014/15 withdrawals = 104,206 af Water transfer programs: SWP Multi-Year Water Pool among contractors Non-SWP transfers from Sacramento Valley 2014/15 transfer volume = 15,842 af

34
35 WATER TRADING Why Trade? The Policy Paradigm and Case Studies Scott S. Slater, Water Trading Panel NARUC Summer Policy Summit July 18, 2017, San Diego, CA 35
36 WHY? Anti Beijing Needs Water: Beijing Takes Water The Duty of Water Requires More People Aren t Necessarily Where the Water Is The Alternative to Build More, Bigger and Better Stuff Necessity 36
37 Governor s Commission to Review California Water Rights Law: Clifford Lee, Staff Paper #5 Water Transfers Definite and certain water rights. Legal: protection against unlawful acts of others Physical: climate / supply variability Tenure: lawful acts of others Must be sufficiently flexible (not rigid) Availability to the broadest number of users The Final Report issued in December of 1978 Recommended Legislative Changes 37
38 Legislative Acts Conservation-based transfers (Water Code 1011) Authorized short-term (Temporary) transfers Long-term transfers Wheeling (Water Code 1810 et seq) Feds Join / CVPIA Reform 38
39 SWRCB Guide to Water Transfers (1996) Working Group Report on Water Transfers (2002) Acknowledges Importance of Water Transfer Maximizing Public Welfare State and Federal Participation Local Agency Participation One Component of Water Supply Solution Groundwater Banking 39
40 OZ Experience: Council of Australian Government Reforms For Efficiency Over-allocated water resources: (unsustainable levels of use) Aging water delivery infrastructure Environmental concerns 40

41
42 Framework for Solution Tariff pricing Water trading Environment and water quality Institutional structures Public consultation Murray-Darling Cap 42
43 National Water Initiative 2004 / From Efficient to Necessity Comprehensive and transparent water pricing Water supply certainty Environmental outcomes Investment certainty Enhanced water markets and trade 43
44 National Water Implementation (On Reflection) Property rights are clear and secure Processes for determining allocation are transparent, inclusive and cost-effective Water is able to be traded to its highest value use Environmental management is efficient and effective Urban and rural services are provided efficiently 44
45 Case Studies in California Groundwater Conservation-Based Transfer 45
46
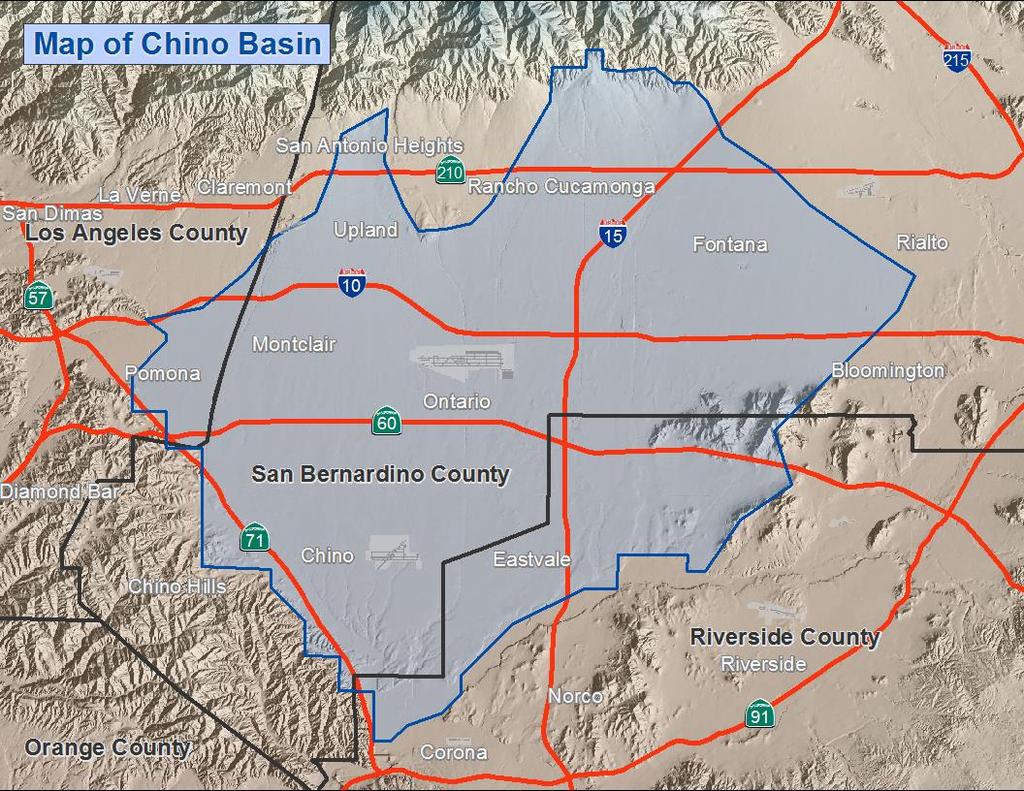
47 Chino Basin Safe (sustainable yield) Set on long-term hydrologic record Not impacted by annual hydrology Sets Environmental baseline Certain Annual Entitlements Clear Transparent Rules Water Open for Trading to All within the Geography of the Judgment Saved water may be traded or stored 500,000 AF presently under storage 300,000 acre-feet cumulatively traded 47
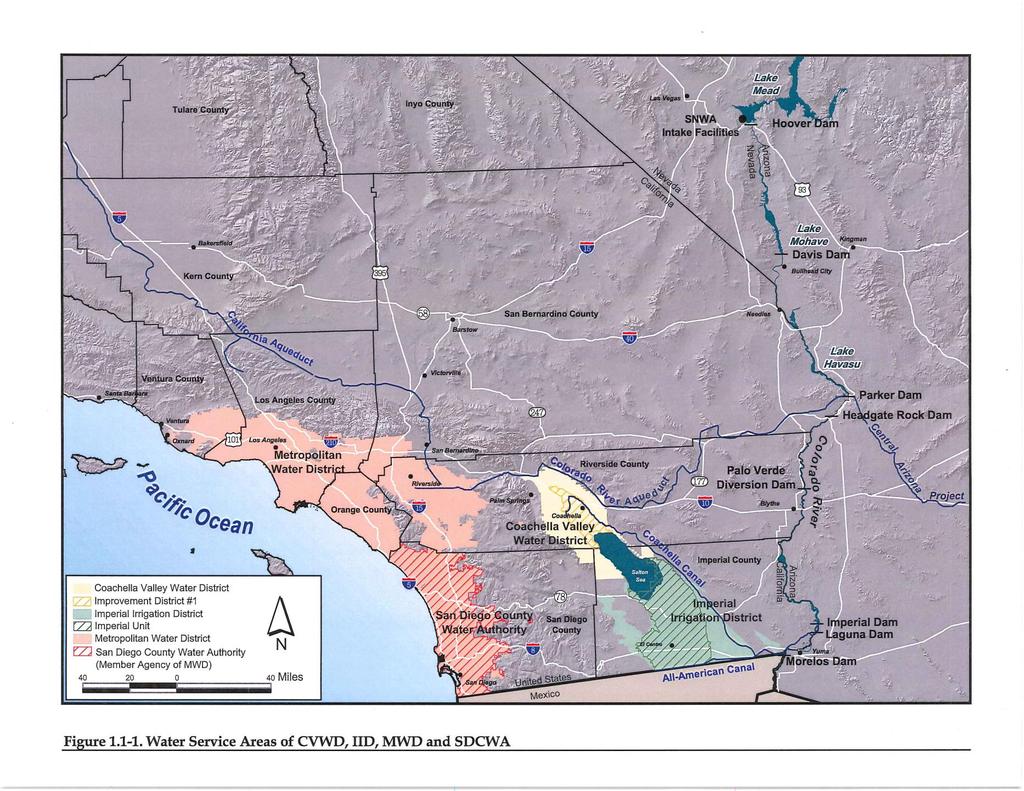
48 San Diego Water Authority / Imperial Irrigation District Transfer District and farmer conservation of 200,000 acre-feet (Water Code 1011) Transfer through Colorado River Aqueduct (Wat. Code 1810 et seq.) Socio-economic impacts (Third-party) addressed. $50 million Environmental impacts mitigated Lining of All-American Canal 77,000 AF 48
49 49
50 San Diego Water Authority / Imperial Irrigation District Transfer Required quantification of Colorado River priorities between states and in California 26 separate agreements SWRCB approval Environmental compliance Transaction costs and degree of difficulty high 15 years in the books without interruption January 17 50
51 Committee on Water