By Kimberly D. Peterson. Rob Van Kirk, Brian Apple, Brad Finney
|
|
|
- Molly Hopkins
- 5 years ago
- Views:
Transcription

1 An Analytical Model of Surface Water/Groundwater Interactions in a Western Watershed Experiencing Changes to Water and Land Use Upper Teton Watershed, Idaho By Kimberly D. Peterson Rob Van Kirk, Brian Apple, Brad Finney
2 Outline Introduction Study Area Objectives Methods Results Conclusions
3 Introduction Changes in irrigation practices lead to changes in hydrology Earthen canals being lined, placed into pipes, or abandoned These impact human water use and ecological processes Important to conjunctively manage limited water supply Both surface flow and groundwater levels
4 Water Table Height (ft) Introduction Conversion from flood to sprinkler irrigation and/or replacement/abandonment of earthen canals can lead to decreased groundwater recharge Future changes could affect recharge /1/ /1/ /1/ /1/ /1/ /1/2001

5 Map of Upper Teton Valley Watershed Henry s Fork Crosscu t Canal T.R. nr. St. Anthony T.R. nr. Tetonia Badger Cr. T.R. ab. S Leigh Darby Cr. N Active Gaging Stations Inactive Gaging Stations SNOTEL Stations 10 miles Pine Cr. Pass Phillips Bench


6 Study Area: Irrigation History Late 1800s: European settlement and agriculture Earthen conveyance systems developed on the alluvial fans Alluvium is highly permeable, canals lose water to the aquifer on these fans Pre-1960s, water was applied by flooding fields 1970s-1990s: A conversion to sprinkler systems
7 Study Area: Diagram TETON RIVER ET TETON RANGE SPRINGS TRIBUTARY TOTAL SUPPLY GROUNDWATER CANAL CROP ET
8 Objectives Investigate effect of changing water management on hydrology Develop model to estimate total water budget for tributaries and irrigation systems under: Natural system Flood irrigation Actual conditions 90% sprinkler irrigation Place system in pipes


9 Methods: Seepage Models Channel loss rates: canals versus streams Designated reaches with no surface in/outflow Measured discharge at top and bottom of reach Wetted area: maps, satellite imagery, field work Loss rate is difference in discharge divided by wetted area 3.66 ft/day for canals; 3.34 ft/day for streams
10 Methods: Seepage Models Stream channel loss modeled by and are empirically determined Solve analytically for
11 Methods: Seepage Models Total loss = evaporative loss + vegetation ET + groundwater recharge Evaporation loss = evaporation rate wetted area ET loss = ET rate riparian area Groundwater recharge = Total loss Evaporation loss ET loss
12 Methods: Seepage Models Canal seepage calculated similar to stream channel seepage Historic canal system: 90 miles of canal 105 acres of surface area Current canal system: 80 miles of canal 89 acres of surface area Note: 90 acres 3.66 ft/day = 329 acre-ft/day ET rates didn t vary much across crop type
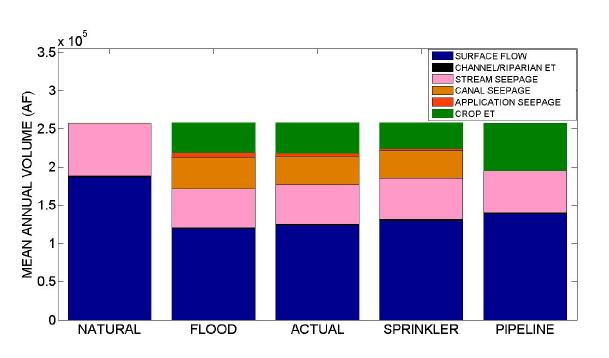
13 Results
14 Results Mean annual water budget: Surface flow : 46% supply under flood irrigation (lowest) Surface flow : 73% under natural scenario (highest) Diversion: 62,100 acre-feet under pipeline (lowest) Diversion: 87,000 acre-feet under flood (highest) Application seepage very low Channel and vegetation ET less than 1% Irrigation efficiencies: 45% to 48% for 3 irrigation scenarios, 100% pipeline scenario
15 Results: Surface Flow Trail Creek and Teton Creek: mean number of days surface flow continuous across losing reach
16 Results: Groundwater Recharge
17 Results: Groundwater Recharge Total groundwater recharge, under all scenarios, was increasing function of water supply
18 Results: Groundwater Recharge The variation across scenarios was an increasing function of water supply
19 Conclusions Irrigation practices have lead to an increase in groundwater recharge Placing canals in pipes could Leave more water in the tributaries Increase water delivered to crops Greatly decrease groundwater recharge Whether changes are good or bad depends on the resources being considered Native aquatic species versus downstream irrigators


20 Thank You!!!