Porous Asphalt Pavement Performance In Cold Regions
|
|
|
- Rodney Horn
- 5 years ago
- Views:
Transcription
1 Porous Asphalt Pavement Performance In Cold Regions LRRB INV 878 Task 6 report Submitted by: Office of Environmental Stewardship Minnesota Department of Transportation MS 620, 395 John Ireland Blvd. St. Paul, Minnesota February 2011 Mn/DOT Personnel Brett Troyer, P.E. Brett.troyer@state.mn.us 1
2 ACKNOWLEDGEMENTS The author would like to express appreciation to the Local Road Research Board for providing the financial support on this project and to the Minnesota Department of Transportation for their support of this research. Special thanks are offered to Marilyn Jordahl-Larson and Buffy Peterson (Environmental Services) for technical support and guidance. 2
3 TABLE OF CONTENTS CHAPTER 1 INTRODUCTION Background... 5 CHAPTER 2 SITE CONDITIONS Site Description... 7 CHAPTER 3 ENVIRONMENTAL CONDITIONS Introduction Rainfall Groundwater Overland flow CHAPTER 4 WATER QUALITY Introduction Sampling methods Groundwater test results Surface water testing Filtration Testing Temperature Monitoring CHAPTER 5 CONCLUSIONS Filtration Water Quality Tipping Buckets
4 APPENDICES APPENDIX A Test Cell Cross Sections & Layout APPENDIX B Rainfall and Tipping Bucket Data for APPENDIX C Water Quality Testing Results APPENDIX D Water Quality Standards LIST OF TABLES Table 2-1 Thermal Conductor Depth Table 3-1 Cell Areas Table 3-2 Tipping Bucket Capacities Table 3-3 Runoff Volumes LIST OF FIGURES Figure 2.1 MnROAD Facilities Layout... 6 Figure 2.2 Porous Cell Layout... 7 Figure 2.3 Tipping Bucket Assembly... 8 Figure 2.4 Tipping Bucket Installation... 8 Figure 2.5 Cells and Tipping Bucket Locations... 9 Figure 2.6 Cell 86 Sample Port (SP86) Figure 2.7 Cell 88 Tipping Bucket Sampling Port Figure 2.8 Groundwater Well Locations Figure 3.1 October 2 Rainfall Chart Figure 3.2 October 2 Tipping Bucket Chart Figure 4.1 Sampling for Cell 86 SP Figure 4.2 August 2009 Air and Pavement Temperatures Figure 4.3 October 2009 Air and Pavement Temperature Figure 4.4 October 6, 2009 Pavement Temperature at 0.5 in Figure 4.5 October 6, 2009 Pavement Temperature at 11 in
5 CHAPTER 1 INTRODUCTION 1.1 Background Porous asphalt pavement consists of bituminous asphalt pavement with greatly reduced fine aggregate particles and a relatively high (20%) void content. The surface permeability and high porosity allows water to pass directly into the base material underneath the pavement. The base material aggregate typically used is clean, uniformly graded, and deep enough to allow sufficient water storage while allowing infiltration into the subgrade soils. Environmental permits from Minnesota Pollution Control Agency [1] and Capital Region Watershed District [2] that require stormwater runoff to be treated will be including requirements to retain, at a minimum, the first ½ inch of runoff. Practices include the direct infiltration of stormwater. This portion of the porous pavement research is to monitor and measure the environmental effects of stormwater runoff as it passes through the pavement profile and into the subgrade soils. Monitoring and measuring will be done both electronically (capturing rainfall and temperatures) and manually (collecting water samples and temperatures). Outcomes from the data gathering and water sampling will help provide tools to meeting Best Management Practices for stormwater treatment prior to discharge to resource waters. Using information from research in other countries will help confirm and add to our data to developing good practices. This information will be provided in the final report. Storm water retention, infiltration, and runoff rates will be monitored monthly, and after major rain events, as well as quality and extent of water treatment observed. Temperature of the rainfall as it flows through the filter layers be measured thru electronic monitoring and at the outfall when water samples are taken. For comparison, the adjacent nonporous, impermeable pavement section will have the same water testing and monitoring protocol. Water sampling plan is to take samples after 1 inch or greater rain events. The water quality samples are taken by Mn/DOT personnel and sent to a laboratory for testing. The tests to be done on all water samples are: total solids, suspended solids, suspended volume solids, PH, total Chloride, total Phosphorous, total Kjeldahl Nitrogen, total Nitrates+nitrite, total Zink, 5
6 total Lead, and total Mercury Adjustments to the sampling plan can be made to reduce the amount of samples taken in a given year to spread the costs of the tests over time rather getting all test don in a given year. Samples from some ports could not be taken since there was no water to take samples. We have limited our sampling to these ports this next year and modified the time to take samples to during a storm event which will rely on Mn/ROAD staff to get the samples. Surface cleaning and/or vacuuming will be performed on the porous pavement periodically to maintain permeability. Comparison to the impermeable adjacent section will help define the required surface cleaning or vacuuming maintenance rate. The maintenance method used, and any resulting change in permeability will be documented. 6

7 CHAPTER 2 SITE CONDITIONS 2.1 Site Description Research is taking place at MnDOT s MnROAD facility located in Central Minnesota. The site is along Interstate 94 near Albertville and Monticello Minnesota. Our test sections are located on the low volume loop road adjacent to the westbound lanes of Interstate 94. (Figure 2.1) Figure 2.1 MnROAD Site Location 7

8 Weather information gages are located at each end of the MnROAD facility and data is electronically provided every 15 minutes. Data helpful for our use include air temps and rainfall. The test sections are located at the western end of the loop road and about 1 mile from each of the weather stations. The cells are numbered from west to east; porous asphalt cell number 86 is the western most of the cells and has sand as the subgrade. Cell 87 is the nonporous bituminous pavement, and is the control section. Porous asphalt cell 88 has clay as the sbgrade. Figure 2.2 provides the layout view. Appendix A provides a cross sectional view of each section and the location of the cells on the Low volume road. Figure 2.2 Porous Cell Location Each test section is equipped with a tipping bucket that captures surface runoff. Each tip of the bucket is electronically collected and has a monitoring port to collect water samples. Figure 2.3 and Figure 2.4 shows the tipping bucket assembly and installation. 8


9 Figure 2.3 Tipping Bucket Assembly Figure 2.4 Tipping Bucket Installation 9

10 The original plan provided for lysimeters to capture runoff as it passes thru each of the porous sections to measure volume and also provide an opportunity to obtain water samples. During construction of the sections the lysimeters were not installed due to some constructability issues. To provide opportunity to gather storm water runoff as it filters through the porous pavement, water sample ports were installed at the end of each porous pavement section. These are labeled Port 86 and Port 87. These were used to take samples of water for water quality testing. Figure 2.5 provides the relative location of each of the porous pavement sections along with the tipping bucket and water sampling ports. Figure 2.6 shows the field location of the sample port for cell 86. Figure 2.7 provides the field location of the tipping bucket for cell 88. Figure 2.5 Cells & Tipping Bucket Locations 10


11 Figure 2.6 Cell 86 Sample Port Figure 2.7 Cell 88 Tipping Bucket Sample Port 11

12 Ground water wells are located on the project to provide background data. These are labeled T3MW (Well Number 1) and T4MW (Well Number 2) in Figure 2.8. Figure 2.8 Groundwater Monitor Wells The last of the instruments for monitoring environmental effects are thermocouples to measure pavement temperature. Cell 19 is the baseline section. Cells 86 and 88 also have these installed. Table 2-1 provides the label and depth of each thermocouple sensor in each of the cells. 12
13 Table 2-1 Thermocouple Sensor Locations Cell 19 Cell 86 Cell 88 Depth from surface (in) 101 SEQ 17 SEQ SEQ 18 SEQ SEQ 18 SEQ SEQ 20 SEQ SEQ 21 SEQ SEQ 22 SEQ SEQ 23 SEQ SEQ 24 SEQ SEQ 25 SEQ SEQ 26 SEQ SEQ 27 SEQ SEQ 28 SEQ SEQ 29 SEQ SEQ 30 SEQ SEQ 31 SEQ SEQ 32 SEQ Changes that occurred from our initial scope found in task report 1 and 2 are as follows: Locations of the test cells were moved further away from the baseline ground water wells, therefore further analysis will be needed to determine direct correlation to contaminants into the ground water. However we can still provide information of the contaminant levels of each cell. Demonstrations of porous asphalt pavement vacuuming were performed on November 9, 2009 and September 6, Porosity tests were conducted before and after vacuuming. Since vacuuming was done at prescribed times, further analysis will be needed to determine maintenance intervals for vacuuming. Lysimeters were not installed as planned due to constructability issues. These were going to be used to determine infiltration rates and provide water sampling to determine filtration capabilities of the pavement or leaching of chemicals from the pavement. However using the porosity tests before and after vacuuming will allow us to analyze the infiltration rates. Sampling ports were installed at the end of each section. Installing these sampling ports provided us with the water sampling capabilities. 13
14 CHAPTER 3 ENVIRONMENTAL CONDITIONS 3.1 Introduction Data obtained from this research will provide more information regarding the environmental benefits of porous pavement roads in cold climates both for structural and water quality purposes. The Mn/Road facility provides excellent opportunities to meet these goals. 3.2 Rainfall Total rainfall for 2009 was 26.5 inches and for 2010 the rainfall total was 27.7 inches. The months that had more significant rainfalls were June, August, October of 2009; and May, June, July, August of Rain events of 1 inch or greater in a 24 hour period were used for analysis. During the 2009 and 2010 there were 10 events that met this criterion. Rainfall information taken from the weather station measurements will also be used to calculate the expected volume runoff of the porous sections. These events will be compared to the tipping bucket volumes in the same 24 hour events. Comparing these results will help determine when porous sections start to clog. Water samples were also taken to compare water quality. Figure 3.1 shows the October 2, 2009 event which had 1.2 inches in a 24 hour event. Figure 3.1 Rainfall Event 14
15 Figure 3.2 shows the same rain event triggering tipping bucket for Cell 86 (porous over sand), Cell 87 (standard pavement), and Cell 88 (porous over clay). Figure 3.2 Tipping Bucket Event 3.3 Groundwater The groundwater elevations were measured for Well Number 1 at feet and Well Number 2 at feet. This is a quite large gradient since the distance between the wells is 30 feet. Further investigation will be needed to determine the differences. Ground water elevations taken from cell 86 will be compared to see if there are changes to ground water elevations under pavements and to help determine ground water flow. Samples were also taken for water quality. 3.4 Overland flow Drainage areas of each cell will be from the rain falling on each section with no other overland flow occurring from adjacent areas. Runoff volumes were measured from the surface of each test section, including the control section which is an impervious dense graded bituminous surface. Runoff data was calculated two ways and comparisons made. The expected volume of water for each cell was calculated using the rainfall events and the surface areas of each cell. The actual runoff volume of water from each cell was calculated from the tipping buckets. Table 3-1 shows the area of each cell, 15
16 both porous and non porous. Table 3-2 shows the capacity of each tipping bucket. Table 3-1 Cell Areas AREA (ft 2 ) Percentage Area Acreage Cell Porous Non Porous Total Porous Non Porous Porous Non Porous Total % 19.5% % 100.0% % 19.5% Table 3-2 Capacity of each bucket: Gallons per tip Gallons Tip 16 1 As shown in Appendix B there are some inconsistencies with the outcome of the data. For the non porous pavement, cell 87, expected and actual should match up more closely than shown. February 2010 shows no readings for the tipping buckets when there was actual rainfall that occurred. To make a more complete analysis we will need to physically check that the tipping buckets work on a weekly basis in order to get consistent data and to make conclusions regarding runoff verses infiltration volumes. Also we will need to calibrate each of the tipping buckets to verify the volume of each tip. For purposes of this report we have selected October 2, 2009 rainfall event to compare data gathered as shown in Table 3-3 and Figure 3.1 and Figure 3.2. Table 3-3 Runoff Volumes (gallons) Day Rainfall Cell 86 surface runoff Cell 87 surface runoff Cell 88 surface runoff Expected tips Actual Expected Tips Actual Expected Tips Actual Oct 2,
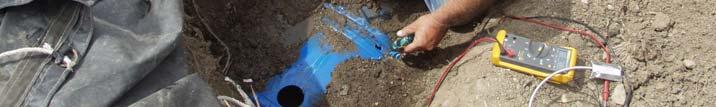
17 CHAPTER 4 WATER QUALITY 4.1 Introduction Minnesota waters are broken up into beneficial use categories and there are different water quality standards for each of these categories. The beneficial uses of waters are taken from Minnesota Rules Chapter 7050 and are grouped into 7 classes. Below are general definitions of each class: Drinking water - Class 1 Aquatic life and recreation - Class 2 (sometimes shortened to fishing and swimming ) Industrial use and cooling - Class 3 Agricultural use, irrigation - Class 4A Agricultural use, livestock and wildlife watering - Class 4B Aesthetics and navigation - Class 5 Other uses - Class 6 Limited Resource Value Waters - Class 7 Each of the classes may be broken into subclasses and each has specific water quality standards. For our purposes results will be compared to Class 2a and 2b waters. 4.2 Sampling Methods Water quality samples were taken based in the sampling and analysis plan. Samples were taken from ground water wells; Well 1 and Well 2, tipping buckets; TB86, TB88, and Sample Ports; SP86, SP88. Samples were taken using an ISCO well pump (Figure 4.1). Four water samples were taken from each sampling tube; 1 liter for general, 250 ml for nutrients, 250 ml metals, and 125 ml mercury. Mn/DOT water quality and testing unit personnel measured water temperature, turbidity, dissolved oxygen, ph, and specific conductance. Samples were also sent to the Department of Health for additional tests. The Department of Health tests include: turbidity, conductivity, suspended volatile solids, suspended solids, total volatile solids, total solids, chloride, nitrogen, phosphorous, cadmium, chromium, copper, iron, lead, mercury, nickel, and zinc. 17

18 Figure 4.1 Sampling for port 86 (SP86) Groundwater Test Results Baseline groundwater samples were taken at 3 different dates during Comparing test samples with water quality standards for class 2 waters, the ground water was above standards for copper, lead, and suspended solid. This data will be compared to runoff and groundwater sampling of the test sections to measure the effectiveness of the porous surface system and underlying soils. Surface runoff samples from the control section will need to be taken to be used as baseline information. The groundwater testing results and water quality standards are attached in Appendix E. These results will be used to monitor concentrations in the surface water runoff, how the porous pavement system filters these contaminants and if, or how, they impact the groundwater levels. Preliminary results show that background concentration levels fall within the water quality standards. Runoff from the pavement is typically lower in concentrations of the tested parameters than the ground water. The data is inconclusive for filtering capabilities of the porous pavement of the tested parameters. 18
19 4.2.2 Surface Water Testing Water quality samples were taken from the tipping buckets from cell 86 and 88. These are labeled TB86 and TB88 in Figure 2.5. We will need to collect surface runoff for cell 87 (TB87) to make final conclusions. Preliminary results show that surface runoff has no measurable impacts to ground water. Test data is shown in Appendix E. 4.3 Filtration Testing Originally the samples were going to be taken from lysimeters but due to construction issues these could not be installed. Instead sampling tubes were installed at the end sections of each cell. Water quality samples were taken at cell 86 and 88 but only two samples were taken in cell 88 since there was no water observed at the other times. Sampling methods need to be adjusted at cell 88 to provide proper analysis. We will need to take samples from cell 88 immediately after rainfall events happen. This data will give us better opportunity to analyze and develop conclusions. Since Cell 86 sampling port is in ground water directly below the porous pavement we can make some good comparisons with the background tests for Well 1 & Well 2. Test samples taken for Cell 86 (SP86) shows that the turbidity, copper and lead are higher than water quality standards for class 2 waters and background levels in Well 1 and Well 2. Surprisingly the concentrations of chlorides increased with each sample. These were below water quality standard for chlorides but did generate some concerns as to why the increase. Further monitoring and investigation will be completed this next year to help answer the high concentrations of these parameters. Test data is attached in Appendix E 4.4 Temperature Monitoring Temperature probes are located in Cell 86 (porous over sand), Cell 23 (standard pavement), and Cell 88 (porous over clay). The probes range in depth from 0.5 inches to 72 inches. Electronic conductance measurements were taken at 15 minute intervals and these measurements were translated to temperatures. These are temperatures of the ground and not the storm water as it flows through the soil, but one can assume that as the water passes thru these layers of soil that the water will be approaching these temperatures. For these purposes we will look at the temperatures for August and October Figure 4.1 and Figure 4.2 shows the pavement temperatures 0.5 inches below the surface for cell 23 and cell 88 for August and October of Note that the porous surface shows more moderate temps vs. the non porous surface. Figure 4.3 and Figure 4.4 show temperatures of October 6, 2009 during a storm event that had 1.41 inches of rainfall in a 24 hour period. Comparing the air temperatures to the pavement sections shows that the porous sections are consistently higher than conventional pavements. We would like to include similar comparisons for warmer months with similar rain events but did not have that for 2009 since some of the instrumentation was not working properly. This will be added in the 19


20 final report. We would like to assume that the underlying depths of the porous pavement are cooler than air temps and surface temps. This would show that the air voids in the porous sections act as a thermal layer providing warmer temps in cooler climate conditions and cooler temps in warmer climate conditions. During summer months the porous pavement sections could be used as part of a treatment train to cool storm water prior to discharge to resource waters. This theory will be proven or dismissed after further study. Figure 4.2 August 2009 Air & Pavement Temperatures 20


21 Figure 4.3 October 2009 Air & Pavement Temperatures Figure 4.4 October 6, 2009 Temperatures Figure 4.5 October 6, 2009 Temperatures 21
22 CHAPTER 5 CONCLUSIONS 5.1 Filtration We will need to take samples from cell 88 immediately after rainfall event happens. 5.2 Water Quality Concentrations of Chlorides were of concern. Since the runoff concentrations were around.5 mg/l and the concentrations were increasing in the ground water at cell 86 and at levels in of 70 mg/l and higher. Further monitoring and investigation will need to be completed this next year to help answer the high and increasing concentrations. Surface runoff samples from the control section will need to be taken. This data will be used as baseline information. Water depths in SP 88 will need to be monitored soon after a storm event and samples taken when there is sufficient water depth to take samples. 5.3 Tipping Buckets The expected vs actual stormwater runoff indicates a significant discrepancy in measurement. We will need to physically check that the tipping buckets work on a weekly basis in order to get consistent data and to make conclusions regarding runoff verses infiltration volumes. We will need to calibrate each of the tipping buckets to verify the volume of each tip. 22


23 Appendix A Pervious Cells Cross Section & Layout 23


24 Porous Cell Sample Wells 24

25 25
26 Appendix B Rainfall and Tipping Bucket Data for Month Rainfall Cell 86 surface runoff Cell 87 surface runoff Cell 88 surface runoff Expected tips Actual Expected Tips Actual Expected Tips Actual Jan Feb Mar Apr May Jun Jul Aug Sep Oct Nov Dec Jan Feb Mar Apr May Jun Jul Aug Sep Oct
27 APPENDIX C Water Quality Testing Results Sample Ports (SP 86 & SP 88) Cell 88W (West Well # Cell 86 (East end in middle) SP 86 end in middle) SP88 Sample date 05/11/09 06/10/09 06/17/09 07/21/09 08/17/09 08/20/09 10/02/09 8/13/ /10/09 07/21/09 Time 10:57 12:22 10:41 12:17 11:00 10:05 9:00 11:00 12:38 12:30 Pre-sample depth to water (ft.) N/A Conductivity (umhos/cm) Turbidity (NTU) Suspended Vol. Solids (mg/l) Suspended Solids (mg/l) Solids, Total Volatile (mg/l) Solids, Total (mg/l) Nitrate+Nitrite Nitrogen, Total (mg/l as N) Kjeldahl Nitrogen, Total (mg/l) Phosphorus Total, LL (mg/l as P) Chloride, Total (mg/l) Cadmium LL (ug/l) < <0.10 <0.10 Chromium LL (ug/l) Copper (ug/l) Iron HL, Tot (ug/l) Lead (ug/l) <1.0 < Mercury (ug/l) N/A <0.01 < Nickel LL (ug/l) Zinc HL (ug/l) <10 <10 < <10 Temp (deg C) PH
28 Runoff Water Quality Sample Port # TB Cells 88 & 89 TB Cells 86 & 87 Sample date 6/9/2010 8/13/2010 6/9/2010 8/13/2010 Time 10:10 11:30 10:15 11:20 Pre-sample depth to water (ft.) Conductivity (umhos/cm) Turbidity (NTU) Suspended Vol. Solids (mg/l) < Suspended Solids (mg/l) Solids, Total Volatile (mg/l) < Solids, Total (mg/l) Nitrate+Nitrite Nitrogen, Total (mg/l as N) Kjeldahl Nitrogen, Total (mg/l) < Phosphorus Total, LL (mg/l as P) Chloride, Total (mg/l) < Cadmium LL (ug/l) <0.10 <0.10 <0.10 <0.10 Chromium LL (ug/l) Copper (ug/l) <1.00 < <10.0 Iron HL, Tot (ug/l) Lead (ug/l) <1.0 <1.0 < Mercury (ug/l) < Nickel LL (ug/l) <1.0 < Zinc HL (ug/l)
29 Groundwater Water Quality Well # Well 1 (T3MW Cell 25) Well 2 (T4MW Cell 25) Sample date 03/04/08 06/18/08 11/20/08 03/04/08 06/18/08 11/20/08 Time 11:45 12:00 12:20 13:15 12:45 13:00 Pre-sample depth to water (ft.) Conductivity (umhos/cm) Turbidity (NTU) na Suspended Vol. Solids (mg/l) Suspended Solids (mg/l) Solids, Total Volatile (mg/l) Solids, Total (mg/l) Nitrate+Nitrite Nitrogen, Total (mg/l as N) <0.05 <0.05 < < Kjeldahl Nitrogen, Total (mg/l) Phosphorus Total, LL (mg/l as P) Chloride, Total (mg/l) Cadmium LL (ug/l) < < Chromium LL (ug/l) Copper (ug/l) Iron HL, Tot (ug/l) 3300 N/A N/A 2600 Lead (ug/l) Mercury (ug/l) < Nickel LL (ug/l) Zinc HL (ug/l) <10 <10 Temp (deg C) PH
30 Appendix D Minnesota Water Quality Standards Water Quality standards taken from Minnesota Rules 7050 class 1 class 2A Class 2b min max CS MS FAV CS MS FAV Turbidity (NTU) Suspended Vol. Solids (mg/l) NA NA NA NA NA NA NA NA Suspended Solids (mg/l) See below Solids, Total Volatile (mg/l) NA NA NA NA NA NA NA NA Solids, Total (mg/l) NA NA NA NA NA NA NA NA Nitrate+Nitrite Nitrogen, Total (mg/l as N) 10 Kjeldahl Nitrogen, Total (mg/l) NA NA NA NA NA NA NA NA Phosphorus Total, LL (mg/l as P) Chloride, Total (mg/l) *Cadmium LL (ug/l) *Chromium LL (ug/l) *Copper (ug/l) Iron HL, Tot (ug/l) 300 Lead (ug/l) Mercury (ug/l) *Nickel LL (ug/l) *Zinc HL (ug/l) Temp (deg centigrade above for stream 0 5 Temp (deg centigrade above for lake) 0 3 PH "CS" means the highest water concentration of a toxicant to which organisms can be exposed indefinitely without causing chronic toxicity MS" means the highest concentration of a toxicant in water to which aquatic organisms can be exposed for a brief time with zero to slight mortality. FAV = final acute value (96 hour) The FAV equals twice the MS value TSS water Quality Standards Criteria Table Regional water quality criteria (Total Suspended Solids [TSS] mg/l) Reference/least impacted Biology Combined All Class 2A waters (Trout Streams) Northern River Nutrient Region Central River Nutrient Region Southern River Nutrient Region Red River mainstem Headwaters to border (Concentrations can be exceeded no more than 10% over a ten year data window; the assessment season is April through September) Lower Mississippi River Pools 2 through 4 [through the Lower Mississippi River SAV draft SS WQS] Lower Mississippi River main stem below Lake Pepin [UMRCC criteria report] [summer average TSS concentration met in at least half of the summers, defined as June-September] 30
31 Bibliography Minnesota Pollution Control Agency (MPCA), 2005, NPDES Construction Stormwater Permit. Available online at Capitol Regions Watershed District, 2008 Permitting Program. Available on line at Ramsey-Washington Metro Watershed District, 2008 Permitting Program. Available online at Federal Highway Administration Stormwater best management practices in an ultra-urban setting: selection and monitoring porous pavements. Available online at Environmental Protection Agency (EPA) Porous Pavement. National Pollutant Discharge Elimination System. Available online at Backstrom, M and Bergstrom, A. (1999). Porous pavement in cold climates. Submitted to Canadian Journal of civil engineering. 31