Post Construction BMP Monitoring: Critical to a Successful Green Infrastructure Program
|
|
|
- Louise Walton
- 5 years ago
- Views:
Transcription


1 Post Construction BMP Monitoring: Critical to a Successful Green Infrastructure Program Presented by: Kelly Kuhbander, LEED AP, Strand Associates, Inc. April 4, 2013


2 Regulatory Support for Use of Green Infrastructure U.S. Environmental Protection Agency Green infrastructure can be both a cost effective and an environmentally preferable approach to reduce stormwater and other excess flows entering combined or separate sewer systems in combination with, or in lieu of, centralized hard infrastructure solutions. Ben Grumbles, Assistant Administrator USEPA Memo to EPA Regional Administrators - March 5, 2007


3 Many Communities Are Using Green BMPs for NPDES Compliance 2013 O W E A W A T E R S H E D W O R K S H O P

4 The Next Step: Monitoring Post Construction BMP Monitoring is Critical to a Successful Green Infrastructure Program!
5 Types of Monitoring Quantitative Precipitation Wind speed/direction Relative humidity Pollutant Loading Temperature Evapotranspiration Soil moisture Volume reduction Peak flow rates Qualitative Site Visits Photo documentation Maintenance inspections Aesthetics Upkeep Wet weather Seasonal Resident/owner issues What information are YOU interested in?
6 MSDGC Post Construction BMP Monitoring Program 22 Properties, 70+ Individual BMPs Wet Weather Visits and Seasonal Dry Weather Visits Site Visit Log BMP Evaluation Form Maintenance Log Photo Documentation Owner Communication BMP Database Quantitative Data Partnerships with USGS and USEPA
7 Wet/Dry Weather Visits Established goal for site visit frequency At least 1 dry weather visit per season (All 4 seasons) At least 1 wet weather visit per rainy season (Spring and Fall) Additional visits as needed or desired Dry weather visits Dry period (3 days since last rain event) Notify owner in advance, invite them to join Wet weather visits Targeted substantial rain events wanted visual evidence Monitor and document regional rain gage network each visit Conducted follow up visit 24 hours after first visit Additional follow up visits, if necessary
8 Site Visit Log Tracking Mechanism to Manage Multiple Sites Differentiated Wet/Dry Weather Visits

9 BMP Evaluation Form Completed for every site visit (wet or dry) Specific to each BMP type Key Information Evaluator Date/Time/Weather Owner Presence Assessment of each BMP component for condition, issues, and maintenance concerns Comments Overall facility condition

10 Maintenance Log Addressing maintenance issues frequently and proactively results in better BMP performance and less severe functionality problems. Record of Maintenance Needs Determined on Site Visits Key Information Date of Visit Maintenance Need Photo of Issue Date Owner Notified Confirmation of Maintenance Completion Date Maintenance Performed

11 Photo Documentation Pre-determined photo locations for consistent angles Photos of all noted maintenance issues Additional photos to demonstrate wet weather ponding


12 Owner Communication Very important to a successful post construction monitoring program Assign a contact person to each BMP feature Notify owner of visits when possible, invite them to join Notify owner of maintenance needs if owner is responsible, give them a timeframe for completion Open communication with the property owner will result in a more successful BMP

13 Protocols and Standards Type of Standards Site visit protocol Photo documentation protocol Site evaluation forms with specific Yes/No questions Maintenance forms Benefits Ensures consistency Allows various people to conduct site visits Provides clear direction

14 BMP Tracking Database User Friendly tool developed to store information and track BMPs All information is stored in a centralized location All records are consistent and accessible


15 BMP Tracking Database Fully customizable to meet a community s needs Ability to add additional sites as they are constructed Opportunity for field entry using a tablet May be stored in a location allowing remote access Generates various reports quickly

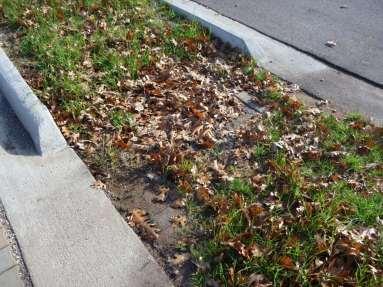

16 Maintenance Items Leaf Accumulation / Outlet Blockage


17 Maintenance Items Erosion, Sediment Accumulation, Mulch Needed


18 Maintenance Items Clogging, Sediment Accumulation, Trucks Driving Through Basin
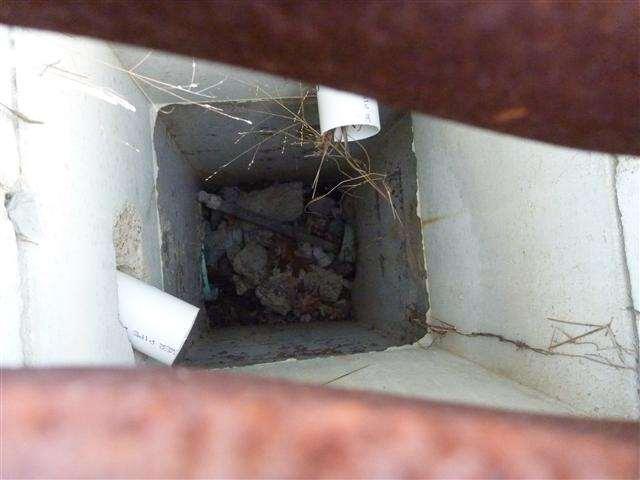
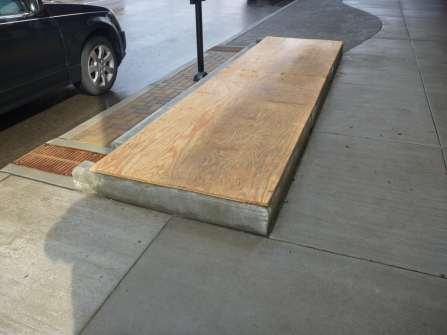

19 Maintenance Items Underdrain Debris, Business Owner Covers Planter


20 Wyoming High School Rain Garden Cincinnati, OH During and 24 Hours After 0.43 Rain Event


21 Oakley Square Green Street Cincinnati, OH 2013 O W E A W A T E R S H E D W O R K S H O P During and 24 Hours After 0.37 Rain Event


22 Cincinnati State Community College Cincinnati, OH 2013 O W E A W A T E R S H E D W O R K S H O P During and 24 Hours After 0.42 Rain Event

23 Water Quality Nitrogen Phosphorus TSS Metals Bacteria Volume/Flow Rates Inflow Vs. Outflow Volume reduction Peak flow reduction Quantitative Monitoring Other Parameters Precipitation Wind speed/direction Relative humidity Temperature Evapotranspiration Soil moisture Infiltration rates USEPA guide for conducting water quality monitoring and reporting data on stormwater BMPs - Originally released in 2002, updated in 2009

24 Create a Monitoring Plan What are you trying to measure and why? Water Quality Volume Reduction Peak Flow Reduction Regulatory Compliance Structure your data collection plan: How long will you collect data? During which seasons? Pre-construction vs. Post-construction? Influent vs. Effluent? Compare performance results to maintenance? Logistics Type of monitoring equipment to be used Cost/Funding Who will perform work? Data collection/download/maintenance of equipment

 Two sensor types installed as back up and to")
25 Cincinnati State Community College Cincinnati, OH USEPA Monitoring Pervious paver parking lot monitoring Water content and temperature sensors to monitor pervious paver performance Monitors installed in every other parking stall, hard wired to data collector (1/3 and 2/3 depth of gravel) Two sensor types installed as back up and to test new product

 Temperature, Moisture Content, Volume Rainwater Harvesting")
26 Civic Garden Center Green Learning Station Cincinnati, OH Monitoring Bioswales Amended soil comparison Pavement Study - Porous Asphalt, Pervious Concrete, Solid Concrete, Permeable Pavers (Volume, Temperature, Moisture Content) Green Roof Study (Intensive and Extensive) Temperature, Moisture Content, Volume Rainwater Harvesting Volume Capture


27 Clark Montessori High School Cincinnati, OH USEPA Monitoring 6 monitoring locations within pervious concrete aggregate 6 monitoring locations in native soil 1 foot deep beneath pervious concrete storage layer 2 level sensors installed in series at downstream end of bioswale. No underdrains


28 USGS / USEPA Monitoring Real-Time Data Discharge Precipitation Wind speed Wind direction Relative humidity Net solar radiation Temperature Evapotranspiration Soil moisture St. Francis Apartments Cincinnati, OH

29 St. Francis Apartments Cincinnati, OH Data posted online instantaneously Graphs Tabular Sortable by Date Water Alert will send you a text when user defined parameters are exceeded
30 Sample of Data Results Blue = Upper basin inflow St. Francis Apartments Cincinnati, OH Red = lower basin inflow
31 St. Francis Apartments Cincinnati, OH Sample of Data Results December 9, 2012 Event


32 St. Francis Apartments Cincinnati, OH Sample of Data Results December 9, 2012 Event 80% Peak Flow Reduction

33 Regional Green Infrastructure Proven for CSO Control Willow Run: Terraced Reforestation in I75-71 ROW Existing Conditions 17 Acre drainage area Monitored Benefits 5.6 MG CSO reduction annually Actual Cost $936,000 $0.17 / gallon Flow monitoring performed 1 year pre-construction and 1-year postconstruction at the outfall of the basin to validate the benefit.


34 Terraced Reforestation in I75-71 ROW 2013 O W E A W A T E R S H E D W O R K S H O P
35 Volume (gal) 2013 O W E A W A T E R S H E D W O R K S H O P 4,500,000 4,000,000 3,500,000 3,000,000 Terraced Reforestation Pre- vs. Post- Construction Events 3% - 30% Reduction in Peak Flows 2,500,000 2,000,000 1,500,000 1,000, , Rainfall (in) Pre-Construction Post-Construction
 $0.")
36 Regional Green Infrastructure Proven for CSO Control Willow Run: Retrofit of Existing Dry Basin Existing Conditions 110 acre drainage area 2 acre existing basin Monitored Benefits 23.2 MG CSO reduction annually Actual Costs $300,000 (retrofit only) $0.013/gallon of CSO reduction Flow monitoring performed 1 year pre-construction and 1-year postconstruction at the outfall of the basin to validate the benefit.

37 KyTC Detention Basin Retrofit 2013 O W E A W A T E R S H E D W O R K S H O P
38 Peak Flow (gpm) KYTC Detention Basin Retrofit Pre- vs. Post-Construction Events 2013 O W E A W A T E R S H E D W O R K S H O P 9,000 8,000 7,000 50% - 75% Peak Flow Reduction 6,000 5,000 4,000 3,000 2,000 1, Rainfall (in) Pre-Construction Post-Construction
39 Flow (gpm) 2013 O W E A W A T E R S H E D W O R K S H O P 2,500 KYTC Detention Basin Retrofit Peak Flow Rate Comparison Inch Rain Event 2,000 1,500 Peak (pre) = 2,090 gpm Peak (post) = 442 gpm Peak flow rate delayed by 18 hours 1, Time (hrs) Pre-Construction Post-Construction

40 Post Construction BMP Monitoring is Critical to a Successful Green Infrastructure Program! Track and document BMP performance for parameters of interest to your organization. Make adjustments as needed to the existing feature, to future designs, to maintenance protocols, etc.
41 QUESTIONS? Kelly Kuhbander, LEED AP Strand Associates, Inc.