Photovoltaics Outlook for Minnesota
|
|
|
- Sibyl Parrish
- 5 years ago
- Views:
Transcription
1 Photovoltaics Outlook for Minnesota Saving dollars, not polar bears Steve Campbell University of Minnesota Department of Electrical and Computer Engineering
2 Outline Why solar? Solar technologies and how they work Utility versus distributed generation On the horizon

3 Types of Solar Power Photovoltaics Concentrated Solar Power
4 The Lede We are rapidly approaching an era when the choice to install solar energy will be primarily driven by cost, even without subsidies. One can expect to see significant distributed and utility-scale deployment over the next decade. Large-scale energy storage is an unsolved problem.

5
6 There s Power and There s Power A solar installation is rated in the power it would produce in watts at a standard level of illumination: AM1.5. To compare different technologies, one uses the levelized cost of energy (LCOE) must take into account many factors Availability Operating costs Depreciation

7 Cost of Electricity in the US Grid Parity depends of location Hawaii West Texas Parts of CA depending on usage
8 Trends for PV Modules Price drops as efficiency and manufacturing improve They will be free in three more years 04/03/13 Solar Cell Module Spot prices High ($/W p ) Low($/W p ) Si Module Thin Film Module Jelle et al. Solar Energy Mater. Sol. Cells 100, (2012).
9 The Result of Falling Costs PV production doubles every ~ 2.5 years At the current rate, we will have 1 TW of capacity in 10 years and ~4 TW in 20 years. The later would be about 15% of the total energy supply.
10 To Reach Grid Parity at AM1.5 Solar Irradiance Installed cost Solar modules and balance of system Current BOS is about 65% for utility-scale Module cost and most of the BOS cost scale with module efficiency


11 Why US Solar? ~3 kwh/m 2 /Day ~8 kwh/m 2 /Day Germany
 could power the state In spite of the latitude, Minnesota is sunny: SW Minnesota receives 80 to 90% of the irradiance")
12 Why Minnesota Solar? 5.8 kw-hr/m 2 -day 140 W/m 2 12 miles x 12 miles 170 W/m kw-hr/m 2 -day MN electric power use ~ 8 GW *144 sq. miles (< 2% of all lakes) could power the state In spite of the latitude, Minnesota is sunny: SW Minnesota receives 80 to 90% of the irradiance of Arizona
13 PV Technologies
14 Pure semiconductor is semi-insulating Light can free an electron Creates two carriers Energy that depends on the semiconductor (Si: 1.1 ev, in the near IR) Electric field separates the charge for collection Semiconductors Ɛ


15 Creating a Field: Doping pn Junction p-type + - n-type + - Ɛ BI
16 p-n Junction Diode I e e e e e e n e e e oe oe Ɛ BI o o o o + - V A > 0 p o e o e o e e e e I sc.. V oc V A PV current is in the opposite direction of the forward-bias dark current If e-h pairs are generated in the depletion region collection efficiency is high
 V oc")

17 Solar Cell Figures of Merit Current, I (ma/cm 2 ) V oc Voltage, V (Volts) I sc I sc ~ ma/cm 2 V oc ~ Volts

18 Solar Radiation Variations Space Universe AM W/m 2 ~1125 W/m 2 AM1 AM1.5 q ~1000 W/m 2 Scattered diffuse light m amo Direct light I Ie m = I amo e -at m Global = Direct + Diffuse 1 m m 1.5 for q 41.8 sin q o a is the inverse absorption length
 where I solar (l) is the solar irradiance in W m -2")
19 Irradiance (W m -2 nm -1 ) Air Mass 1.5 (AM1.5) Solar Spectrum I solar ()d10w/m ll Wavelength, l (nm) where I solar (l) is the solar irradiance in W m -2 nm -1
20 Light Absorption and Efficiency If 1/a is of order the depletion width (~1 mm), device behaves as described If 1/a is >> than the depletion depth, we rely on diffusion of the generated holes and electrons In that case the material has to be very good (i.e. single crystal). This is the case with Silicon n-type p-type
21 PV Technologies


22 Crystalline Silicon PV 1/a ~ 70 mm Performance depends strongly on crystal quality and purity Cutting Si boules and polishing the wafers leads to a loss of 50 to 70% of the material


23 A Partial Solution: mc-si Reduced performance but reduced cost Still hard to get to really low cost
24 Thin Film Solar Typical stack involves an absorber layer that is vacuum deposited or formed by reaction with a vapor These absorber have a small 1/a and so are 1 to 2 mm thick ~1 mm Transparent Conductor n-type Window n-type Buffer P-type Absorber Back Contact Substrate


25 Unlike c-si, a-si has a large a Stability issues prevent high efficiency Amorphous Silicon

 Cd has")

26 CdTe Leading thin film in manufacture (First Solar) Cd has environmental concerns some countries restrict it use

27 CIGS More complex material, making it more difficult to manufacture


28 Fraunhofer ISE, Report July 2014, page 18

29 Thin Film PV CdTe a-si CIGS
30 Leading Manufacturers c-si mc-si Thin Film
31 Utility Versus Distributed Solar

32 70 MW Rovigo Solar Plant in NE Italy

 Agua")
33 Between Yuma and Phoenix 5.2 million modules Currently rated for 290 MW CdTe thin film (First Solar) Agua Caliente
34 Utility Scale (>100 MW) PV Facilities Agua Caliente Solar Project, (Arizona, 250 MW - to increase to 397 MW) California Valley Solar Ranch (250 MW) Golmud Solar Park (China, 200 MW) Welspun Energy Neemuch Project (India, 150 MW) Mesquite Solar project (Arizona, 150 MW) Neuhardenberg Solar Park (Germany, 145 MW) Templin Solar Park (Germany, 128 MW) Toul-Rosières Solar Park (France, 115 MW) Perovo Solar Park (Ukraine, 100 MW)
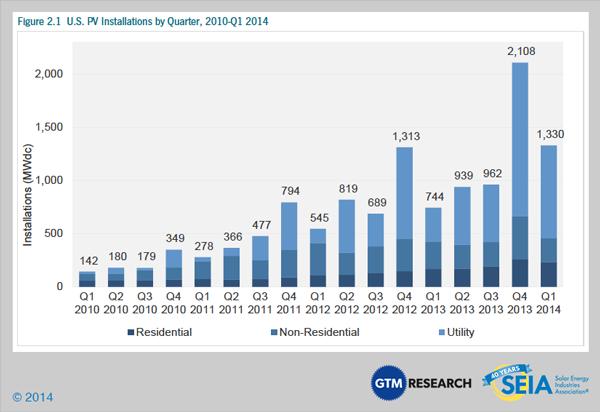
35 PV Installations
36 Utility Scale Problems Intermittancy of the source Variable source / variable load Short range planning: Microcasting Low cost energy storage Financing cost Long haul distribution Materials
37 Utility Scale Storage How to store the capacity of Agua Caliente operating for 24 hours at AM1.5? Energy ~ 2.5x10 16 Joules or 25 Petajoules State of the art energy storage options: Technology Energy Density (MJ/kG) Requirement (kg/tons) Lithium-Ion B / 30 M Alkaline Battery B / 43 M Lead-acid Battery B / 160 M Supercapacitor B / 1540 M For Pb-acid this is a 10 story building 3 to 5 km on a side

38 The Case Against Central PV: Distribution

39 United States Power Grid
, Taiwan")
40 Completed in 2009 capacity of 55,000 National Stadium (Kaohsiung), Taiwan

41 BMW Building
 0.")
42 Costco, Richmond CA PG&E Com Rates 1) 0.15 $/kw-hr 2) 0.18 $/kw-hr 3) 0.26 $/kw-hr 4) 0.32 $/kw-hr Grid parity is much easier to achieve for Tier 3 or 4 usage


43 Distributed Generation and BIPV The patchwork of licensing requirements drives up BOS Permit to plug-in ~6 months Unresolved question who pays for local transmission infrastructure? Note that the installation shown at right is soft (conformal and lay on top of existing structure. They do not require extensive installation infrastructure.
44 PV Outlook: Mostly sunny with scattered clouds
45 Summary So Far PV module cost has dropped dramatically. This has been difficult for manufacturers, but great for users No end in sight to this long-term trend BOS cost reduction is lagging; needs to be solved As a result, supplementary power applications are growing rapidly Minnesota is quite viable for utility-scale solar, especially in the southwest


46 Cloud One: Materials It is hard to imagine a way to scale Si to and below $0.50/watt installed. Will TF mfg survive until then? Cells with Cd cannot be deployed in some parts of the world. Opening for CIGS? Material cost and availability for TW PV 1 TW of CIGS requires 55 years of Indium production, but In is heavily used in touch screens, flat panels, etc.
47 Irradiance (W m -2 nm -1 ) Is There a Limit to Efficiency? Photons have just enough energy to remove electrons Photon energy above the bandgap can t be absorbed Long wavelength light can t produce electron /hole pairs no absorption Ideally V OC = E G -0.5 ev Wavelength, l (nm) E photon = 1210 ev-nm/l

48 Cloud Two: Physical Limits Ultimately we are limited by Shockley-Queisser CdTe How to get low cost multi junction cells?