Clean Air Fine Particle Implementation Rule for the 1997 PM2.5 Standards. Paul T Wentworth, P.E. EPA Region 3 October 31, 2007
|
|
|
- Violet Taylor
- 5 years ago
- Views:
Transcription

1 Clean Air Fine Particle Implementation Rule for the 1997 PM2.5 Standards Paul T Wentworth, P.E. EPA Region 3 October 31, 2007
2 PM2.5 Implementation Rule Issues Particle Matter: What is it? EPA s PM 2.5 Standards: Old and New Designations Elements of the PM2.5 Implementation Rule Pollutants addressed Reasonable Available Control Technology (RACT) Reasonable Available Control Measures (RACM) Condensable Particulate Matter Reasonable Further Progress Proposed NSR Provisions 2

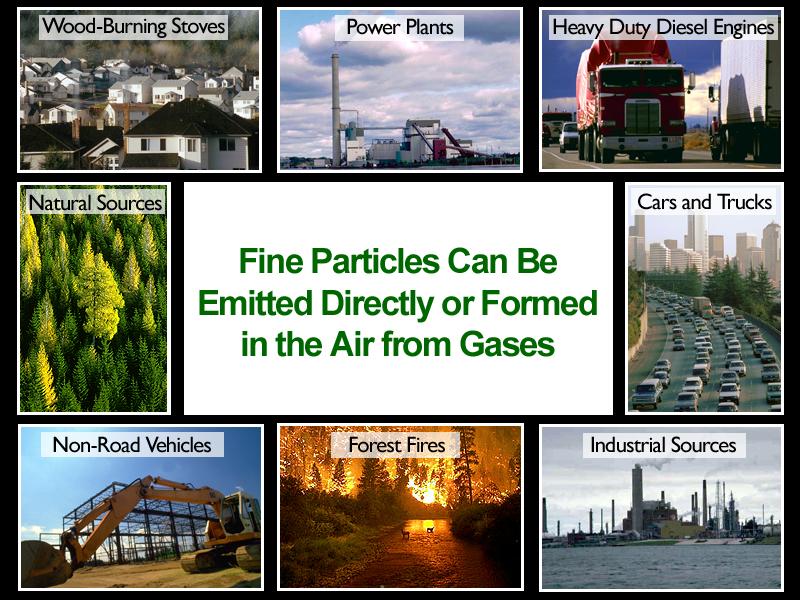
3 Particulate Matter: What is It? A complex mixture of extremely small particles and liquid droplets 3
4
 - Forest fires, burning")

5 PM Components: Fine and Coarse Fine Particles Combustion, gases to particles - Ammonium sulfate - Ammonium nitrate - Organic & elemental carbon - Metals - Crustal material -Water Sources: - Coal, oil, gasoline, diesel, wood combustion -Transformation of SO2, NOx, organic gases including biogenics - High temperature industrial processes (smelters, steel mills) - Forest fires, burning Exposure/Lifetime: - Lifetime of days to weeks - Distribution from urban scale to 1000s of km Inhalable Coarse Particles Crushing, grinding, dust - Resuspended dusts (soil, street dust) - Coal/oil fly ash -Aluminum, silica, iron-oxides - Tire and brake wear - Inhalable biological materials (e.g., from soils, plant fragments) Sources: - Resuspension of dust tracked onto roads - Suspension from disturbed soil (farms, mines, unpaved roads) - Construction/demolition - Industrial fugitive emissions - Biological sources Exposure/Lifetime: - Coarse fraction (2.5-10) lifetime of hours to days, distribution up to 100s of km 5
")
6 Cars, trucks, heavy equipment, wild fires, waste burning, and biogenics Example Area Carbon Crustal Soil related chemical elements Cars, trucks, and power generation Nitrate Sulfate Ammonium Power generation Fertilizers and Animal Feed Operations (with SO2 and NOx, forms ammonium sulfate and ammonium nitrate) 6
7 FOR REFERENCE PURPOSES 7

8 Particle Composition Varies 8
9 Public Health Risks Are Significant Particles are linked to: Premature death in people with heart and lung disease Aggravation of heart and lung diseases Aggravated asthma Increases in respiratory symptoms like coughing and difficult or painful breathing Decreased lung function Chronic bronchitis 9
10 Public Health Risks Leading to increases in Medication use School and work absences Doctor and emergency room visits Hospital admissions 10
11 Benefits and Costs 1997 Standards: estimated monetized annual benefits ranged from $19 to $104 Billion per year. 3,300 to 15,600 incidences of premature mortality avoided. Costs $8.6 Billion 2006 Standards: When fully met, the revised 24-hour PM2.5 standards are estimated to yield benefits incremental to meeting the 1997 standards of between $9 billion and $75 billion per year in health and visibility benefits in One key study central estimate of $17 Billion. EPA estimates the cost of meeting these revised standards at 5.4 Billion per year in Benefits per ton in some cases exceeded $100,000 per ton 11

12 Some Groups Are More at Risk People with heart or lung disease Conditions make them vulnerable Older adults Greater prevalence of heart and lung disease Children More likely to be active Breathe more air per pound Bodies still developing 12
13 Milestone 1997 PM 2.5 NAAQS 2006 PM 2.5 NAAQS Promulgation of Standard July 1997 September 2006 Effective Date of Standard September 1997 December 18, 2006 State Recommendations to EPA Final Designations Signature February 2004 (based on monitoring data) December 2004 December 18, 2007 (based on monitoring data) No later than December 18, 2008* Effective Date of Designations April 2005 Typically no later than 90 days after publication in the Federal Register SIPs Due April years after effective date of designations Attainment Date April 2010 (based on monitoring data) No later than 5 years after effective date of designations Attainment Date with Extension Up to April 2015 No later than 10 years from effective date of designations * In the event the Administrator has insufficient information to promulgate the designations by December 18, 2008, the date of final designations may be extended up to one year, but no later than December 18,
14 Designations PM 2.5 NAAQS was revised for the 24-hour PM 2.5 standard only, lowered from 65 μg/m 3 to 35 μg/m 3. Effective date of the revised PM standards is 12/18/06. Section 107(d)(1) requirements for new designations: States must make recommendations no later than 12/18/07. EPA must notify States and Tribes of any modifications no later than 120 days prior to the final designations date. EPA is required to make final designations not later than 2 years after promulgation of the revised NAAQS (12/18/08); this date may be extended for up to 1 year if EPA has insufficient information to promulgate the 14 designations (12/18/09).
15 EPA s PM2.5 Standards: Old and New 1997 Standards 2006 Standards Annual 24-hour Annual 24-hour PM 2.5 (Fine Particles) 15 µg/m 3 Annual arithmetic mean, averaged over 3 years 65 µg/m hour average, 98 th percentile, averaged over 3 years 15 µg/m 3 Annual arithmetic mean, averaged over 3 years 35 µg/m hour average, 98 th percentile, averaged over 3 years 15
16 Violations of Revised 24-Hour PM 2.5 NAAQS Approximately 70 areas are violating the hour PM 2.5 NAAQS (based on monitoring data) 32 are in the 39 existing PM 2.5 nonattainment areas Predominantly urban areas, with several smaller cities and non-urban areas (populations less than 100,000) All except 3 are in the Eastern U.S. 38 are new areas (those currently designated attainment for existing PM 2.5 nonattainment areas) Mix of urban areas, smaller cities, and non-urban areas About 20 are in the Western U.S. 16
17 Areas/Sites Violating 24-Hour PM 2.5 NAAQS Current nonattainment area violates new 24-hr NAAQS [32 areas] Current nonattainment area meets new 24-hr NAAQS [7 areas] Sites not in a current nonattainment area violate the new 24-hr NAAQS (59 sites) 59 sites are violating the new 24-hr standard and are NOT located in an existing nonattainment area. They are located in 38 different areas 17 (34 in metro areas, 4 not in a metro area).
18 Key Issues for 24-Hour PM 2.5 Designations Guidance Timing of final designations (see table) Monitoring data State recommendations should be based on data. Most recent 3 years of data will be considered when EPA makes final designations. Boundary recommendations: Based on the assessment of the same 9 factors in previous PM 2.5 designations (see next slide). Case-by-case assessment versus presumption. For areas with existing PM 2.5 NA boundary, justify if different 24-hour boundary recommended (not revisiting annual boundary). 18
19 Factors to Consider for Boundary Recommendations Emissions in areas potentially included versus excluded from the nonattainment area Air quality in potentially included versus excluded areas Population density and degree of urbanization including commercial development in included versus excluded areas Traffic and commuting patterns Expected growth (including extent, pattern and rate of growth) Meteorology (weather/transport patterns) Geography/topography (mountain ranges or other air basin boundaries) Jurisdictional boundaries (e.g., counties, air districts, Reservations, etc.) Level of control of emissions sources 19
20 Milestone Draft Timeline for Designation Process 2006 PM2.5 NAAQS Date State and Tribal recommendations due Dec. 18, 2007 EPA Response No later than August 20, 2008 (120 days prior to final designations) States and Tribes may provide additional comments Prior to final designations Final Designations No later than Dec. 18, 2008* * If the EPA Administrator determines that there is insufficient information to make final designations, then the date of final designations may be extended by up to one year but no later than December 18,
21 Significance of State Plans to Attain the 1997 PM2.5 Standards Among the criteria pollutants, PM2.5 poses the greatest health risks. Local and in-state sources are responsible for a significant portion of the PM2.5 problem and health risk These sources are the focus of PM2.5 SIPs. CAA requires these SIPs to demonstrate attainment as expeditiously as practicable to protect public health PM2.5 implementation rule describes the steps for determining required controls and the date that is as expeditious as practicable 21
22 SIP Due Dates and Attainment Dates SIP revisions are due April 2008 They must: Account for significant air quality improvement from regional/national rules (e.g. CAIR, diesel rules) and State rules on the books Evaluate controls for local and in-state contributors to the problem Adopt reasonably available measures to attain as expeditiously as practicable as required by the Clean Air Act (CAA) Include enforceable emissions limitations and source testing & monitoring procedures as required by the CAA 22
23 SIP Due Dates and Attainment Dates Attainment date is no later than five years from date of designation (e.g. April 2010) Extensions of 1-5 years are possible, considering: the severity of the nonattainment problem availability and feasibility of air pollution control measures Areas evaluated based on most recent 3 years of monitoring data (e.g for April 2010 attainment date) No classification system 23
24 Currently Designated PM 2.5 Nonattainment Areas Standards Violated annual and/or 24-hour PM 2.5 standards with designated data ( *) Legend Nonattainment areas violating: Number of Areas both annual (15 µg/m 3 ) and 24-hour (65 µg/m 3 ) standards 2 ONLY the 24-hour standard (65 µg/m 3 ) 0 ONLY the annual standard (15 µg/m 3 ) 37 Total PM 2.5 Nonattainment Areas 39 * data were considered in the designation process but all nonattainment designations were based on data
25 PM hour Standard Design Values Current nonattainment area (NAA) violates 24-hr NAAQS [29 areas] Current NAA meets 24-hr NAAQS [10 areas] Sites in current NAA violate the 24- hr NAAQS (131 sites) Sites not in a current NAA violate the 24-hr NAAQS (48 sites)
26 and PM hour Standard Design Values (Max value from either period) Current nonattainment area (NAA) violated 24-hr NAAQS either period [33 areas] Current NAA meets 24-hr NAAQS both period [6 areas] Sites in current NAA violated the 24-hr NAAQS either period (179 sites) Sites not in a current NAA violated the 24- hr NAAQS either period (69 sites)
27 Keep in Mind During State Planning for the Fine Particle Standards Current planning is focused on annual standard If area also violates hour standard, consider measures on key source categories that contribute to high 24-hour concentrations If other areas in the state were designated attainment in 2005 but are now violating, take steps to achieve clean air in these areas 27

28 Elements of the PM2.5 Implementation Rule 28
29 Pollutants Addressed in Attainment Plans Direct PM2.5 and SO2: must be evaluated for control measures in each area NOx: Sources of NOx must be evaluated for control measures in each area, unless the State and EPA provide a technical demonstration showing that NOx emissions from sources in the State do not significantly contribute to PM2.5 concentrations in a specific area 29
30 Pollutants Addressed in Attainment Plans VOC The organic carbon component of ambient PM2.5 is a complex mixture of hundreds or even thousands of organic compounds. High molecular weight VOC condense readily when emitted to ambient air and are considered direct organic carbon particle emissions. The relative importance of anthropogenic and biogenic VOC in the formation of secondary organic aerosol (SOA) varies from area to area, depending upon local emissions sources, atmospheric chemistry, and season of the year. While significant progress has been made in understanding the role of gaseous organic material in the formation of organic PM, this relationship remains complex. SOA remains probably the least understood component of PM
31 Pollutants Addressed in Attainment Plans VOCs VOCs important as precursors of tropospheric ozone precursors of secondary organic aerosols (SOA) sinks of OH 340 nm VOC Oxidation (OH, O 3, NO 3 ) several steps HCHO hν (λ < 345 nm), OH lifetime of hours Vegetation Anthropogenic Biomass burning ~1000 ~200 ~100 Tg C yr -1 31
32 Pollutants to Address in Attainment Plans VOC Organic carbon typically exhibits higher mass during the summer, when photochemical SOA formation and biogenic VOC emissions are highest. Aromatic compounds such as toluene, xylene, and trimethyl benzene are considered to be the most significant anthropogenic SOA precursors and have been estimated to be responsible for 50 to 70 percent of total SOA in some airsheds. Man-made sources of aromatic gases include mobile sources, petrochemical manufacturing and solvents. 32
33 Pollutants to Address in Attainment Plans Ammonia Ammonia reacts with sulfuric acid and nitric acid to form ammonium sulfate and ammonium nitrate. Ammonium sulfate formation is preferential under most conditions, though ammonium nitrate is favored by low temperature and high humidity. Emission inventories of ammonia contain uncertainties. Researchers are seeking improvements through process-based inventory approaches for animal feeding operations. Monitoring of ammonia gas and nitric acid is important for identifying when PM2.5 formation in an area is limited by ammonia or by nitric acid. However, there are a limited number of such monitoring sites. 33
34 Pollutants to Address in Attainment Plans Ammonia Reducing ammonia emissions in some areas may increase the acidity of particles and of deposition. Increased acidity is linked to adverse ecological effects and is suspected to be linked with human health effects and with an increase in the formation of secondary organic compounds. In areas with high SO2 emissions, ammonia reductions may marginally reduce PM2.5 concentrations, but particle and precipitation acidity may increase. After substantial SO2 reductions in the east, in general PM2.5 changes are predicted to be less responsive to reductions in ammonia than to reductions in nitric acid. 34
35 Pollutants to Address in Attainment Plans VOC: Sources of VOC are not required to be evaluated for control measures in each area, unless the State or EPA provide a technical demonstration showing that VOC emissions from sources in the State significantly contribute to PM2.5 concentrations in a specific area Ammonia: Sources of ammonia are not required to be evaluated for control measures in each area, unless the State or EPA provide a technical demonstration showing that ammonia emissions from sources in the State significantly contribute to PM2.5 concentrations in a specific area Rule provides basic guidance on potential analyses for technical demonstration; weight of evidence approach. 35
36 RACT & RACM 36
37 Reasonably Available Control Technology (RACT) RACT is the lowest emission limit that a source is capable of meeting with available control technology, considering technological and economic feasibility. Option 1. RACT analysis required for all stationary sources with the potential to emit (pte) direct PM2.5 or a precursor more than 100 tpy Option 2. RACT applies to stationary sources only to the extent it is needed for expeditious attainment or to meet RFP. Possible option 3 Option 2 for areas with attainment dates within 5 years Option 1 for areas with attainment dates > 5 years 37
38 RACT (cont.) Previous RACT determinations for other programs May be acceptable for purposes of PM2.5, provided the State submits a certification with appropriate supporting information that the previous RACT determination currently represents an appropriate level of control. EPA may revise control techniques guidelines or alternative control technology documents for a few important categories with multipollutant effects 38
39 Reasonably Available Control Measures (RACM) A RACM demonstration must show that the State has adopted all reasonable measures needed to meet RFP and to attain the standard as expeditiously as practicable. The demonstration should also show that there are no additional measures available that would advance the attainment date or contribute to RFP. In determining RACM for an area, the state must consider the cumulative impact of implementing the available measures and whether such measures taken together would advance the attainment date. 39
40 RACM (cont) Preamble includes a list of specific measures that States should consider as part of the RACM analysis. States would not be required to adopt these measures, but should assess whether implementing such measures is technically and economically feasible and whether it would advance the attainment date States also must analyze additional measures raised in public comment process. 40
41 Example Control Measures Diesel retrofits (trucks, school buses, stationary engines) Diesel idling (trucks, trains, port equipment, etc.) Programs to reduce emissions from poorly maintained vehicles New or improved direct PM and precursor controls on stationary sources Year-round operation of seasonal stationary source NOx controls Increase use of alternative fuel, hybrid vehicles Buy-back programs for small engines (boats, vehicles, equipment) Year-round measures to reduce VMT (Commuter Choice, carpooling incentives, etc.) Open burning laws and better enforcement Programs to reduced emissions from residential wood combustion and back yard barrel burning Smoke management plans Improved monitoring techniques and more frequent monitoring on sources with control devices Reducing emissions of volatile aromatic compounds (surface coatings, gasoline, solvents, etc.) 41
42 RACT & RACM For nonattainment areas, States need to adopt all reasonably available control measures (including RACT) needed to attain the standards as expeditiously as practicable and meet Rate of Further Progress requirements Collective analysis; demonstrate that no reasonably available additional measures would advance the attainment date by at least 1 year 42
43 RACT & RACM(contl) Guidance in rule Identify technically and economically feasible measures Conduct air quality modeling Select RACT/RACM Area-specific flexibility No tonnage threshold; evaluate smaller sources for areas with more severe problem Preamble includes list of specific measures that States should consider as a starting point for RACT/RACM assessment 43
44 RACT/RACM for Sulfur Dioxide and Nitrogen Oxides from Electric Generating Units (EGUs) Presumption (in preamble) SO2: If State meets the Clean Air Interstate Rule (CAIR) SO2 cap through EGU reductions only, then the State may presume that its nonattainment area EGUs meet RACT and RACM NOx: If State meets CAIR NOx cap through EGU reductions only, then the State may presume that its nonattainment area EGUs meet RACT and RACM (provided NOx sources with SCR operate it yearround) 44
45 RACT/RACM for Sulfur Dioxide and Nitrogen Oxides from Electric Generating Units (EGUs) A State may impose additional requirements on a specific plant if the State determines it is a reasonable means to attain expeditiously However, several factors should be considered re: potential disbenefits of beyond-cair controls Addressed case-by-case through SIP development process Note: RACT/RACM for direct PM2.5 emissions is required for all EGUs 45
46 Reasonable Further Progress (RFP) RFP: annual incremental reductions in emissions for purpose of ensuring timely attainment RFP plan due with attainment demonstration in 2008 If attainment date is no later than 5 years from designations (up to April 2010), RFP is met by attainment demo For areas with an attainment date extension, the State must establish emission reduction milestones showing generally linear progress from 2002 through the 2009 emissions year and, if appropriate, the 2012 emissions year Alternate approach is possible if it would achieve equivalent air quality improvement 46
47 Reasonable Further Progress (RFP) Geographic range of SO2 and NOx emission sources included in RFP plan could extend up to 200 km beyond nonattainment area boundary. Mid-course review in 2011 for area with 2014 or 2015 attainment date Evaluate implementation of measures, emission reductions, and air quality change Adopt new strategies as necessary 47
48 Contingency Measures To be implemented without further action if area fails to attain by its attainment date or fails to meet RFP requirements. Measures need to be other than those measures required for attainment or to meet RFP Recommended level of reductions in preamble: one year s worth of reductions needed for attainment in the area 48
49 Condensable Particulate Matter PM is comprised of filterable and condensable emissions. Condensable emissions are a significant percentage of direct PM2.5 emissions from some sources. Emission inventories have required inclusion of condensable PM for a number of years Test methods for condensable PM are available but concerns remain about data uncertainties and ability of States to develop enforceable emission limits for many sources for 2008 SIPs 49
50 Condensable Particulate Matter For sources included in PM2.5 attainment plans, emissions limits including condensable PM are required after January EPA encourages States that already have required emissions testing and established emission limits for condensable PM to continue Transition period activities EPA to update Method 201A & 202 for use by States during and following transition Stakeholder groups to conduct testing with updated Method 201A & 202 to update emissions factors EPA to work with ASTM to finalize dilution-based test method States to enhance databases to support regulations 50
51 PM2.5 and NSR Background PM 2.5 NAAQS promulgated in 1997 PSD implementation guidance issued by John Seitz in 1997 (Use PM 10 as a surrogate) Designations effective April 2005 NNSR implementation guidance issued by Steve Page on April 5, 2005 (PM 10 surrogate) PM 2.5 implementation rule proposed Nov. 1,
52 Proposed NSR Provisions PM 2.5 regulated under Subpart 1 Major source threshold 100 tpy Significant emissions rate for PM tpy Precursors SO 2 always in as a precursor; NO X presumed in unless State demonstrates that NO X is not a significant contributor to PM 2.5 or part of the transport problem VOC and ammonia presumed out unless State demonstrates otherwise. Ammonia is not a precursor in PM 2.5 attainment areas. 52
53 Offsets 1:1 ratio Proposed NSR Provisions (2) Allow interpollutant trading statewide, regionwide, or on a permit basis Transition policy For PSD continue PM10 surrogate policy until SIPs approved PM 2.5 Increments, SILs and SMCs in a separate NPRM PM 2.5 NSR Final Rule Aug./Sept
54 PM 2.5 Increments, SILs, and SMCs Increments Approaches 166(a) % of NAAQS approach Similar to approach recently used to establish NO 2 increments (a.k.a. safe harbor approach) 166(f) equivalent increments approach 3 options each for SILs and SMCs Proposal scheduled August
55 Other Issues Improved source monitoring Transportation conformity General conformity Emission inventories Enforcement and compliance 55