Anoop Singh. Dept of Industrial and Management Engg. IIT Kanpur
|
|
|
- Bonnie Jenkins
- 5 years ago
- Views:
Transcription

1 Berlin Conference on Energy and Electricity Economics May 2015 Anoop Singh Associate Professor Dept of Industrial and Management Engg. IIT Kanpur 1
2 Energy and Socio economic development Drivers Status and Opportunities for Electricity Trade International experience Cross Border Electricity Trade in SA Strategy for South Asia Conclusions 2
3 3
4 12.0 Energy - GDP Relationship (log scale) Sri Lanka India Pakistan Bangladesh Nepal
5 Per Cap ita Electricity Consumption (2 009) 7000 Europe & CA World 3000 China 2000 Bhutan Maldives 1000 India Afghanistan Nepal Pakistan South Asia Bangladesh Sri Lanka Human Development Index (2011) 5


6 6
,")
,")
7 So: WDI (2015), RGoB (2012), CEA (2015) 7
8 Demand (GWh) Year 2010 Year 2020 CAGR Afghanistan % Bangladesh % Bhutan % India % Maldives % Nepal % Pakistan % Sri Lanka % Total % Source: ADB (2013) 8
9 9
10 So: WDI (2015) 10
11 Value lost due to electrical outages Country (As a % of sales) Afghanistan (2007) 6.49 Bangladesh (2007) Bhutan (2009) 4.33 India (2006) 6.62 Nepal (2009) Pakistan (2007) 9.16 Sri Lanka (2011) So: World Development Indicators (2013) 11
12 70 Net energy import (2010) Net ener rgy import (% of ener rgy use) So: World Development Indicators,
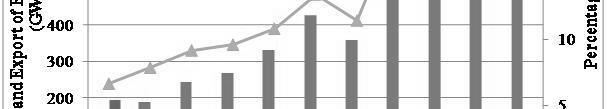
13 Percentage Share Share of Trade with South Asia Merchandise exports within South Asia Merchandise import within South Asia
14 Fuel Trade (% of merchandise exports) Fuel Import 35.0 Fuel Export
15 Nepal Bangladesh India Bhutan Pakistan Lanka Existing Peak System Demand (MW) * Projected dpeak System Demand d(mw) # & CAGR (%) Sri So: Compiled by the Author from CEA (2013a, b, 2012), NTDC (2013), CEB (2013), NEA (2013, BPDB (2013) Notes: * ; # ; &
16 Coal Oil Natural Gas Biomass Hydropower* (million (million (trillion cubic (million Country tons) barrels) feet) tons) (Gigawatts) Afghanistan 440 NA Bhutan Bangladesh India 90,085 5, Maldives Nepal NA Pakistan 17, NA 59 Sri Lanka NA Total 108,961 5, Source: ADB (2012), SAARC Secretariat (2010), CWC (2005), WAPDA (2011) 16
17 Improve Quality of Life (Human Development Index) Sustainable Energy Access to All (2012 UN s International Year of Sustainable Energy for All ) Improve energy security Optimal utilisation of region s energy resources Greater economic and energy cooperation Share best practices in the energy sector 17
18 18
19 IPPs/Privat e Sector Electrifica Per capita Installed Peak Peak share in tion electricity capacity demand demand T & D (%) installed access consumpti (MW) met (MW) (MW) capacity rate (%) * on (kwh) (%) Bangladesh India # $ $ Nepal ** Pakistan Sri Lanka *** Sources: Bangladesh (BPDB, 2014); Nepal (NEA, 2013); Sri Lanka (CBSL, 2013), India (CEA, 2014); Pakistan (Kessides, 2013), * IEA (2011), ** excludes electricity imports capacity from India, *** based on 1.2 GW hydro plant not running during drought seasons, # As on March 2014, $ For March2014 So: Singh et al. (Forthcoming) as WB s PRWP 19

20 20
21 Country Afghanistan Bangladesh Bhutan India Nepal Pakistan Sri Lanka Nominal generation market structure Vertically integrated monopoly Multiple sellers, single buyer Multiple sellers, single buyer Competition with organized trading and power exchanges Multiple sellers, single buyer Multiple sellers, single buyer Multiple sellers, single buyer Initiation of private ownership and/or participation: Generatiomission Trans- Distribution Introduction of legally independent regulator *, 2010** So: Singh et al. (Forthcoming) as WB s PRWP 1999 (Orissa); 2002 (Delhi) 1996 (Orissa); 1998 (national) Transmission Arrangement Vertically integrated Unbundled transmission owner Vertically integrated Independent system operator /2011 PPP mode Vertically (ETFC (Year?) integrated Independence?) 1994 Unbundled transmission i (KESC) owner Vertically integrated 21
22 22
23 Participants Capacity Nepal imported 793 GWh electricity in 2013 from India over India Nepal multiple interconnections. (Singh, 2014) Electricity import from Bhutan to India was 5556 GWh in (4627 GWh in ) from Hydro power stations at Tala, Chukha and Kurichu with a total export led capacity India-Bhutan of 1416 MW. (ERLDC, 2014) As per an umbrella agreement between the two countries, India assures a minimum of 5000 MW electricity import by Pakistan imported 419 GWh electricity in 2014 from Iran, up from 375 GWh in the previous year (NTDC, 2014). A MOU, signed in 2014, could enable Pakistan to import up to 3000 Pakistan-Iran MW and electricity costing Pakistan PKRS 3 million per month. CASA-1000 expected to enhance trade with Central Asia. 23
24 Afghanistan- Central lasia Pakistan-India India-Sri Lanka India-Bangladesh Import of 2,246.2 GWh electricity from Iran, Uzbekistan, Turkmenistan, andtajikistan in CASA-1000 expected to enhance this trade. Pakistan has submitted a draft MoU to India on importing electricity using a 1200 MW interconnection. There are also possibilities of CASA-1000 tp be extended up to India. Feasibility studies for a 400-kV India-Sri Lanka have been conducted to support import of up to 1000 MW electricity from India. In 2013, power systems of India and Bangladesh were interconnected through a HVDC line that can support electricity export of up to 500 MW (expandable to 1000 MW in future) from India to Bangladesh based on negotiated price and market based price. 24


25 25


26 26


27 27
28 S. Case study Key assumption Total and annualised cost Annual benefit in No. of transmission (USD 17 million) (USD million) 1 India-Bhutan To evacuate Puna I Total cost - USD Up to USD 1,840 million grid & II, Mangdechhu million. pa including USD 336 reinforcement and Dagachhu Annualised cost - USD million in fuel/capacity (3,066 MW) power million pa is benefit and USD 1,504 to India million savings due to unserved energy. 2 Nepal-Bihar (1) Surplus scenario Total cost USD 186 Surplus scenario - (India) 400 kv link 3 India-Sri Lanka HVDC link - construction of all planned projects (2000 MW) to reach surplus state; and (2) Deficit scenario MW of planned capacity addition is delayed Addition of Puttalam Stage 2 (630 MW) and 400 MW by Trinco (1,000 MW) coal station is not considered is million including internal transmission upgrade costs. Annualised cost USD 20 million pa Total cost - USD 339 million (2006 estimate) Annualised cost - USD 50 million pa (2010 estimate) Benefit of USD 105 million pa; Deficit scenario - Benefit of USD 215 million USD 186 million pa, including USD 96 million in benefits from reduction in unserved energy and USD 90 million in fuel/capacity benefits So: ADB 28
29 4 India- Bangladesh HVDC link Three demand growth scenarios in Bangladesh between 9,000 MW to 12,000 MW in Two scenarios: (1) Short term India-Pakistan 220/400 kv link MW transfer at 220 kv (2) Medium/long term, hundred megawatt transfer at 400 kv 6 CASA 1000 and India- Pakistan 400 kv link Two scenarios (1) Base Case CASA 1000; (2) Additional 850 MW hydro in Afghanistan Total cost - USD 192 million to USD 250 million. Annualised cost - USD 25 million pa Total cost (1) max USD 50 million for 220 kv option (45 km); and (2) Max USD 150 million for 400 kv. Annualised cost (1) USD 6 million (220 kv) (2) USD 18 million (400 kv). Total cost - (1) USD 893 million (2) USD 195 million for expanded India-Pakistan power transfer Annualised cost - USD 110 million Annual benefits of USD 145 to 389 million for three demand growth scenarios Annual benefit (1) USD 335 million including USD 122 million in fuel cost savings (2) USD 491 million including USD 163 million in fuel cost savings Combined Annual benefit - USD 1,250 million including USD 906 million in USE reduction and USD 306 million in fuel cost savings. Additional annual benefit of USD 90 million for the additional hydro scenario. 29
30 30
31 Gulf Coast Countries (GCC) Greater Mekong Sub region (GMS) Nile Basin Initiative (NBI) Nordpool Southern African Power Pool (SAPP) South East Europe (SEE) European Network of Transmission System Operators for Electricity i (ENTSO E) E) Central American Electrical Interconnection System (SIEPAC) 31
32 Regional Formal Participating Members Entity Creation ENTSO-E Transmission System Operators (TSOs) from 34 countries GCC 2001 (6) United Arab Emirates, Bahrain, Saudi Arabia, Oman, Qatar, and Kuwait GMS 1995 (7) Cambodia, PRC (Yunnan and Guangxi izh Zhuang), Lao PDR, Myanmar, Thailand, and Viet Nam. NBI 1999 (9) Egypt, Sudan, Ethiopia, Uganda, Kenya, Rwanda, Burundi, DR Congo and Tanzania. Eritrea (Observer) SAPP 1995 (9) Botswana, Democratic Republic of the Congo, Lesotho, Mozambique, Namibia, South Africa, Swaziland, Zambia, and Zimbabwe; (3 non-operating members ) SEE 2005 (9) Albania, Bosnia & Herzegovina, Bulgaria, Croatia, Kosovo, Macedonia, Montenegro, Romania, and Serbia SIEPAC 1999 (6) Guatemala, El Salvador, Honduras, Costa Rica, Nicaragua and Panama 32
33 Regional Entity Motivation / Drivers Trading Status ENTSO-E Security of supply, seamless pan-european electricity market, GWh secure integration of renewable resources,and reliable future- (2012) oriented grid and adequate to meet energy policy goals. GCC Share reserve capacity, thereby reducing generation investment needs in the region. First in 2010 and intermittent GMS Efficient, environmentally sound growth of power sector; GWh support to regional projects and electricity trade. (2010) NBI Coordinated investment in power sector to meet region s social and economic development objectives in the region. SAPP Development of a safe, efficient, reliable, and stable interconnected electrical system and of a regional power trading mechanism MWh ( ) SEE Create a regionally integrated electricity market, forming part Dry run (2006 of the wider EU single market. 09), 2010 SIEPAC Create an integrated regional electricity market in Central America. 33
34 Import Export Total Trade Net Imports Cambodia 1,546 1,546 1,546 Lao PDR 1,265 6,944 8,210 (5,679) Myanmar 1,720 1,720 (1,720) Thailand 6,938 1,427 8,366 5,511 Viet Nam 5,599 1,318 6,917 4,281 PRC 1,720 5,659 7,379 (3,939) Total 17,069 17,069 34,139 So: ADB,
35 SAPP was built upon historical bilateral interconnections in the 1950s and 1960s which witnessed development of interconnections projects between Democratic Republic of the Congo (DRC) and Zambia, and Zambia and Zimbabwe. Later, in 1975, between Mozambique and South Africa GMS historical foundations can be traced back to 1971 with export of power from the Nam Ngum hydropower plant (HPP) in Lao PDR to northeast Thailand. 35
36 36
37 Stage I Stage II Licensees Stage III Stage IV Nodal Agency Based Market Structure Participation of Deemed Trading Participation of Trading Licensees All eligible consumers 37
38 Nodal Agencies Deemed Trading Licensees Trading Licensees Eligible Consumers N TL 1 TL 2 DL 1 DL 2 DL 3 G D G G D G G D G D G D C C C C C C C C C C C C C C C C C I II III IV G Generator # D Distribution Utilities C Consumer N Nodal Agencies DL s Deemed Licensees * TL s Trading Licensees # Including Captive Generation # Including Captive Generation *Generators and Distribution Utilities 38
39 South Asian Regional Power Exchange (SARPX) or South Asian Power Exchange (SAPX) Regional Contracts on the Power Exchanges in India New 'Market Areas' on the Indian Power Exchanges Volume and/or Price coupling of All Power Exchanges across South Asia 39
40 Nepal 1 Nepal 2 Bhutan Afghanistan Pakistan 1 Pakistan 2 Bangladesh 1 Bangladesh 2 India (12 Market Areas) Sri Lanka 40
41 41
42 Accessible Energy Resources & easy licensing Transmission inter linkages (who would invest?), and its access Coordinated scheduling and despatch Treatment of imbalances from schedule Metering and Energy Accounting Clearing and Settlement, and banking transactions Export / Import licensing Common currency and currency risk Treatment of export tax, import duty and transit tax Harmonised regulatory and policy framework Dispute Settlement 42
43 Government to Government Bhutan & India Power utility and trader (short term) Nepal & India (PTC) Power utility and trader (long term) Bangladesh (BPDB) & India (NVVN) Traders can offer relatively long term supply contracts but price discovery is an issue. Useful for Short to medium agreements. Indian experience demonstrates short term opportunities. PXs can play a crucial role transparent and competitive price discovery. SA Contractual breakthrough PPA between NVVN and BPDB, as it addresses many critical issues including currency, balancing, UI and dispute resolution. 43
44 S. No Key Changes SHORT TERM MEASURES Nodal agency for cross-border trading/ Access to PX Investment framework Regulation of Power Procurement from a PX Settling imbalances 5 Duties and taxes 6 Commerce trading license restrictions 7 Dispute resolution 8 Tariff determination So: Singh (2013) Project Report Submitted to ADB MEDIUM TERM MEASURES 1 Deemed trading licenses 2 Open access in transmission 3 Regulatory guidelines 4 Commercial mechanism to Settle imbalances 5 Transmission charges Grid code Transmission plan LONG TERM MEASURES Trading license to other parties Open access in distribution 44
45 Socialising initial investment in cross border interconnections backed by medium/long term bilateral between ee governments/government e e e entities. es. Early demonstrated benefits to bring in political acceptability. From power exchange to Power Exchange. Exchange Different stage of reform and unbundling Accommodate differences in terms of licensing and market access Long term regional transmission i plan Regional coordination forum to harmonise technical, and regulatory framework. Dispute settlement mechanism 45
46 Coordinated Investment in Generation (South Asia Power Generation Co Ltd.?) Agreement for transit of (hydro) power between India and Bangladesh reciprocated with easing physical congestion at the chicken s neck for setting up transmission i linkages. Multi country owned cross border transmission interconnections to reduce exposure to financial and operational risk. (South Asia Power Transmission Co Ltd.?) Regional mechanism/forum for coordination i and dispute resolution. 46
47 47
48 Anoop Singh, Tooraj Jamasb, Rabindra Nepal, and Michael Toman, Accepted Cross Border Electricity Cooperation in South Asia, World Bank Policy Research Working Paper (PRWP) Anoop Singh & Michael Toman,, International Experiences in Regional Electricity Market Development: Lessons for South Asia. Drafts World Bank Policy Research Working Paper (PRWP) under Anoop Singh & Michael Toman, Benefits of and Barriers to review Regional Electricity Cooperation: A Review of the Literature. World Bank Policy Research Working Paper (PRWP) Anoop Singh, Options for Market Design and Strategy for Developing a Regional Electricity Market in South Asia. 48