CaliforniaWireless E9-1-1 Routing on Empirical Data (RED) Project
|
|
|
- Julia Walton
- 5 years ago
- Views:
Transcription

1 CaliforniaWireless E9-1-1 Routing on Empirical Data (RED) Project CAL NENA February 26, 2009 PUBLIC SAFETY NETWORK A BOAR S HEAD COMPANY
2 RED: Routing on Empirical Data Contract issued by California Emergency Communications Office (9-1-1 Office) Awarded to Boar s Head Corporation using MSA 2034 Consulting Contract PHASE 1 - CHP Ventura jurisdiction covering Ventura and Santa Barbara Counties PHASE 2 - CHP San Francisco & Monterey jurisdictions covering Alameda, Contra Costa, Marin, Napa, San Francisco, San Mateo, Santa Clara, Solano, Sonoma, Santa Cruz, San Benito and Monterey counties
3 9-1-1 Program Mission To enable Public Safety Answering Points (PSAPs) to provide the fastest, most reliable, cost-effective and secure access to emergency services from any device, anywhere in California.
 are wireless only Californians placed 24.8 million E9-1-1 calls in 2008 and 13.3M (54%) were wireless.")
4 Wireless Facts US Subscribers 262.7M in Worldwide 2.3B subscribers. 84% of the US population uses cell phones and used 2.23 Trillion wireless minutes in % of US households (20 million) are wireless only Californians placed 24.8 million E9-1-1 calls in 2008 and 13.3M (54%) were wireless. Everyday in California 36,578 E9-1-1 wireless calls are made (2008 daily average).


5 CA Wireless E9-1-1 Network Call Volume Growth


6 2008 Statewide Annual Call Distribution Every month California receives an average of 1,112,567 Wireless E9-1-1 Calls.

7 2008 Funded Work Stations
8 2007 vs 2008 Statewide Annual Call Distribution CHP All Calls Received ,930 Calls Per Workstation ,382 Calls Per Workstation Answered ,457 Calls Per Workstation ,493 Calls Per Workstation Local PSAPs Received and Answered ,354 Calls Per Workstation ,946 Calls Per Workstation
9 Routing on Empirical Data 1. Boundary Shape Files 2. Call Data for each Cell Sector 3. Develop and Provide Reports by WSP 4. Provide Top 20 Sector Reports (RED 1) 5. Develop and Prepare Redeployment Plan 6. Coordinate Redeployment Plan 7. Monitor and Evaluate Progress 8. Sector Analysis (90 Days Post Deployment) 9. Provide Closure Report


10 Participants CHP Local PSAPs County Coordinators Wireless Service Providers State Office Boar s Head Corporation PUBLIC SAFETY NETWORK A BOAR S HEAD COMPANY
11 Boar s Head Corporation AKA Public Safety Network 15 years experience statistical data gathering and reporting Plotting of call statistics State of California Call Detail Records Current technologies and wireless deployments PUBLIC SAFETY NETWORK A BOAR S HEAD COMPANY
12 February 20, CALNENA 12
13 February 20, CALNENA 13

14 February 20, CALNENA 14
15 February 20, CALNENA 15

16 February 20, CALNENA 16

17 Optimize911.net online tool

18 Optimize911.net online tool

19 Optimize911.net online tool

20 Optimize911.net online tool

21 California Emergency Communications Office Sector Audit Angle Difference = 3 Degrees

22 California Emergency Communications Office Sector Audit Angle Difference = 174 Degrees

23 California Emergency Communications Office Sector Audit Angle Difference = 151 Degrees

24 California Emergency Communications Office Sector Audit Angle Difference = 113 Degrees
25 Phase 1 Accomplishments PSAPs VTA 7, SB 4 Analyzed 232 sectors for 5 WSPs Built online system Post cutover analysis
")

26 Phase 1 Sector Analysis Considered sectors where >50% of calls originated off -highway In Ventura County of the 232 sectors considered for reassignment / cut-over 223 (96%) were approved by PSAPs & County Coordinator CHP approved 92 (39%) for reassignment / cut-over Of 120 sectors previously deployed to local agencies none met CHPs criteria to cut to CHP
27 CHP Cut-over Criteria If 85% or > of the calls plot in the local PSAPs jurisdiction then the sector can route to the local PSAP If % of the calls plot in the local PSAPs jurisdiction and CHP transferred > 90% of the calls then the sector can route to the local PSAP If % of the calls plot in the local PSAPs jurisdiction but CHP transferred < 90% of the calls then the sector will require further analysis before a decision will be made by CHP If 50.9% or < of the calls plot in the local PSAP jurisdiction & the remainder of the calls plot in CHPs jurisdiction then the sector will remain with CHP If <50 calls sector remains with CHP 27
28 RED Schedule Phase 1 - Commenced July 14, 2008 Phase 2 - Commenced January 9, % complete by June 30, 2009

29 How to measure results? The goal is to have shorter wait times and improve service to the W calling public. How do we quantify it? Challenges: inconsistency of data from different PSAPs non-standardization of equipment / controllers different switch settings determine CDR output & format

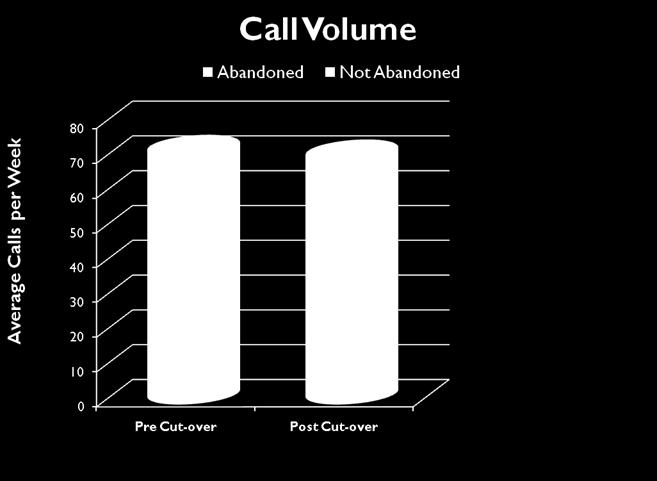
30 Post Cut-over Analysis


31 Post Cut-over Analysis Pre Cut-over 45% of calls were transferred Post Cut-over only 15% of calls transferred


32 Post Cut-over Analysis Pre Cut-over 45% of calls were transferred Post Cut-over only 15% of calls transferred
33 Questions??