The Effect of Natural Degradation on the Properties of Three Types of Oil Palm Residue
|
|
|
- Carmel Shields
- 5 years ago
- Views:
Transcription
1 International Journal of Biomass & Renewables, 6(2) : 11-22, 2017 The Effect of Natural Degradation on the Properties of Three Types of Oil Palm Residue Yoshimitsu Uemura 1, Thanh Hoai Trinh 1,*, Munirah Samsuddin 1, and Wissam Omar 1 1 Center for Biofuel and Biochemical Research, Institute for Sustainable Living, Universiti Teknologi PETRONAS, Bandar Seri Iskandar, Perak, Malaysia Abstract This study aims to investigate natural degradation behavior for three different types of lignocellulosic biomass; oil palm empty fruit bunches (EFB), mesocarp fiber and kernel shell. The degradation behavior was investigated by monitoring the change of their physical and chemical properties for 84 days. From the analysis and observation, natural degradation was found to result in a decrease in carbon content and calorific value of biomass but increase in nitrogen and ash contents. From the van Krevelen plot, it was found that carbon and hydrogen were eliminated at almost the same atomic ratio from the biomass during natural degradation regardless of biomass type used in this study. Keywords: Degradation, lignocellulosic biomass, empty fruit bunches, kernel shell, mesocarp fiber 1 Introduction Biomass is one of the important renewable energy and material sources. The lignocellulosic residues from the palm oil industry is one of the renewable resources in Malaysia since Malaysia is the second largest producer of palm oil in the world. The biomass residues include 17.1 million ton of empty fruit bunches (EFB), 10.3 million ton/y of mesocarp fiber, 4.3 million ton/y of kernel shell, 11.0 million ton/y of trunk and 97.0 ton/y of fronds [1]. Most researches related to utilization of biomass are focusing on improving the use of biomass by applying pretreatment and conversion technologies such as torrefaction [1-3], fast pyrolysis [4-6] and other conversion technologies [7,8]. Application of these technologies will stop the degradation process. Despite the effectiveness of these technologies, the quality of the final products depends on the biomass initial composition such as carbon content and calorific value. Thus, it is important to study the behavior of natural degradation to see the changes in characteristics of biomass before proceeding with the technologies. In natural degradation, plant material breaks down under the influence of aerobic and/or anaerobic microorganisms existing in the wastes [9]. Most of the previous papers on the natural degradation of agricultural wastes aim to investigate composting process [10-12]. In composting process, the biomass is ground and fungi, bacteria and actinomycetes grow and decompose the biomass. In the early stage of composting, thermophilic bacteria are predominant. The researchers have not found any comprehensive study in which only mild natural degradation was observed. The objective of this study is to investigate the natural degradation behavior of the oil palm residues in order to accumulate information to estimate the shelf life of oil palm residues as a solid fuel or a raw material for further conversions such as fast-pyrolysis or gasification. In the present study, the moisture content, CHNS contents, ash content and calorific value of the biomass samples were measured every 14 days since the biomass samples used, i.e., EFB, mesocarp fiber, and kernel shell, consist of moisture, hemicellulose, cellulose, lignin, volatile organics, and minerals. In this paper, the term natural degradation means degradation without applying any energy or artificial catalyst. 2 Experimental 2.1 Biomass used and natural degradation test Three types of biomass were selected as raw materials to be tested; empty fruit bunches (EFB), kernel shell and mesocarp fiber. They were taken from each stockyard at palm oil mill of FELCRA Nasaruddin plantation at Bota, Perak in Malaysia. The biomass samples were placed into three different plastic containers with the same size of 19 cm 19 cm 26.5 cm, which have a 3-mm gap between container itself and its lid. A similar volume of each biomass was used without washing. The container setup is shown in Figure 1. *Corresponding author. address : onalone2000@gmail.com; trinh.thanh@utp.edu.my 11

2 Figure 1 Photo of the setup of the containers. This gap allowed the outside air to go through into the inside of the container. The three containers were placed on the rooftop of a three-storey building (N. latitude = 4 23, E. longitude = ) at Universiti Teknologi PETRONAS, Perak in Malaysia from 26th Jan to 19th Apr in The location of the containers was covered by a big ceiling so that the containers did not expose to direct rain shower. Every two weeks, 20 g of samples were taken out from the middle layer of each container (approximately at the height of 10 cm). The natural degradation test was carried out for 84 days. The biomass sampled was weighed immediately after sampling, and was then dried at 105 o C for 1 h in a drying oven and ground to a particle size of 1-2 mm for further characterization. Each characterization was done once unless further notification. 2.2 Moisture content (ASTM E871-82) The dried and ground biomass prepared at the precedent section was dried again for another 24 hours at 105 C. The biomass underwent another 1 h-drying till the mass became constant. The total mass loss was used to calculate the moisture content. 2.3 Temperature and humidity The temperature and humidity in the containers for biomass were measured using a small portable sensor having a data recording function (Hygrochron; KN Laboratories Co. Ltd, Japan). The sensors were buried in the biomass bunch at the middle layer (approximately at the height of 10 cm). Ambient temperature and humidity were also recorded using the same type of sensor placed beside the containers. 2.4 Ash content The ash content was measured using WiseTherm muffle furnace. The samples were placed in the muffle furnace for about 3 h for combustion process to happen. The temperature was set to 700 C for a holding time of 3 hours (ASTM E ), while the ramping rate was set at 10 deg/min. 2.5 Calorific value The calorific value of biomass was determined using IKA Werke C5000 bomb calorimeter. Biomass with plastic crucible and the tied cotton twist was attached to the bomb at the bomb calorimeter. After 15 min, a reading appeared in J/g, which indicates the calorific value of biomass. 2.6 Elemental analysis Elements in biomass such as carbon, hydrogen, nitrogen, and sulfur were measured using a LECO CHNS elemental analyzer. About 1-2 mg of sample was placed in a tin capsule, which was put into the analyzer at 1000 C with constant helium flow. 3 Result and Discussion 3.1 Temperature and humidity Figure 2 shows the temperature profile recorded at 10 am and 10 pm of the biomass and ambient air over the degradation time period. When we look at the temperature record at 10 am in Figure 2 (top), the temperature of mesocarp fiber was the highest on the first 14 days, while the temperature of empty fruit bunches (EFB) and kernel shell was almost the same as the ambient 12
3 temperature. This increase in temperature for mesocarp fiber may be attributed to microbial activities in the biomass. The highest temperature at 10 am achieved by EFB, kernel shell and mesocarp fiber were 30.5, 32.5 and 39.5 o C, respectively. From Figure 2 (bottom), each biomass bed shows higher temperatures than the ambient one by 1 to 4 C. These higher temperatures in biomass bed than that of the ambient air may be attributed to microbial activities since the maximum difference between biomass bed and ambient obviously decreased with time. Figure 3 shows the humidity record at 10 am and 10 pm of the biomass and ambient air over the degradation time period. The humidity of kernel shell and mesocarp fiber was higher than the ambient air. This higher humidity in the biomass containers compared with the ambient air during the first 10 days may be caused by the vapor evolving from the drying of biomass. Even after 10 days, the humidity in the containers was higher than the ambient air. This may be attributed to the buffer effect from biomass since lignocellulosic plant biomass absorb and desorbs water vapor in the atmosphere [13]. Ambient EFB Kernel shell Mesocarp fiber 35 Temperature at 10am [ o C] Ambient EFB Kernel shell Mesocarp fiber 35 Temperature at 10pm [ºC] Figure 2 Temperature-time plot of the middle layer biomass. 13
4 100 Ambient Kernel shell Mesocarp fiber 95 Relative Humidity at 10am [%] Ambient Kernel shell Mesocarp fiber Relative Humidity at 10pm [%] Figure 3 Humidity-time plot of the middle layer biomass. 80 Moisture Content [wt%] Figure 4 Moisture content of biomass vs. time. 14
5 3.2 Moisture content Figure 4 shows the moisture content of each biomass with time. This indicates that EFB had the highest moisture content initially, followed by mesocarp fiber and kernel shell. Starting from day 28 onwards, the change in moisture content for all three biomass reached approximately constant values. The initial moisture contents for EFB, kernel shell and mesocarp fiber (69.8, 28.1 and 35.7 wt%) were reduced to 13.3, 10.1 and 12.6 wt% after 84 days, respectively. For the first 14 days, the drying rate of mesocarp fiber (1.6 %/day) was the fastest, while EFB (1.1 %/day) and kernel shell (1.0 %/day) showed a slower rate due to their larger size and dense structure, respectively. Mesocarp fiber and kernel shell finished their fast drying stage in 14 days and then showed a slower drying stage from 14 to 84 days. On the other hand, it took 28 days for EFB to finish its fast drying stage due to higher moisture content than kernel shell and mesocarp fiber. For all the three types of biomass, the first fast drying stage represents vaporization of free-water, the second slow drying stage represents vaporization of fixed-water. 3.3 Elemental analysis Table I shows the results of CHNS contents of the three samples with time. In Figures 5, 6, 7 and 8, the changes of carbon, hydrogen, nitrogen and sulfur contents for each biomass is plotted against time, respectively. Initially, carbon content for EFB, mesocarp fiber and kernel shell was 43.0, 47.2 and 51.0 wt%, respectively; and nitrogen content was 0.204, and wt%, respectively. After 84 days, the carbon content in each sample decreased and the nitrogen content increased. The final carbon content for EFB, mesocarp fiber, and kernel shell was 32.4, 39.7, and 47.5 wt%, respectively, while the final nitrogen content was 1.58, 1.95, and 0.60 wt%, respectively. Table 1 Elementary analysis results. Sample Day C [wt%] H [wt%] N [wt%] S [wt%] EFB Mesocarp Fiber Kernel Shell
6 Natural degradation caused a significant decrease in carbon and hydrogen contents and an increase in nitrogen content. This opposite trend between carbon, hydrogen and nitrogen is attributed to the difference of the digestion rate between carbon/ hydrogen and nitrogen by the microorganisms. Figure 8 shows that the sulfur content did not exhibit significant change with time. This means that the digestion rate of sulfur is between carbon and nitrogen. Figure 9 shows a plot of H/C atomic ratio vs. O/C atomic ratio. This type of plot is called the van Krevelen plot, which has been utilized to exhibit the extent of carbonization of biomass, char, and coals. When carbonization of biomass proceeds, a plotted point in van Krevelen plot moves towards the origin of the axes. In this figure, the plotted point moves rightward with degradation time for each biomass. From this result, carbon and hydrogen were eliminated at almost the same atomic ratio during natural degradation, while oxygen was eliminated at a smaller rate than carbon and hydrogen. The natural degradation process obviously deteriorated biomass quality as a fuel or raw material for further conversions such as fast pyrolysis or gasification. 55 Carbon Content [wt%] Figure 5 Carbon content vs. time. 7 Hydrogen Content [wt%] Figure 6 Hydrogen content vs. time. 16
7 2.5 Nitrogen Content [wt%] Figure 7 Nitrogen content vs. time. 0.5 Sulfur Content [wt%] Figure 8 Sulfur content vs. time. 17
8 1.8 EFB Mosocarp fiber Kernel shell H/C atomic ratio O/C atomic ratio Figure 9 Van Krevelen diagram: black keys = raw material; white keys = after 84 days-natural degradation. 3.4 Calorific value (CV) Figure 10 shows the change of calorific value with time. The calorific value (CV) of biomass defines the energy density as a solid fuel. The higher the carbon content, the higher the calorific value of biomass. The calorific value of EFB reduced from 18.4 to 14.9 MJ/kg, while for kernel shell it reduced from 19.4 to 17.2 MJ/kg and for mesocarp fiber it reduced from 17.8 to 17.0 MJ/ kg in 84 days. Kernel shell showed the highest carbon content in elementary analysis, thus it also has the highest calorific value among the three biomass samples. The CV decrease rate of EFB from day 1 to day 28 showed the fastest rate among three types of biomass. The rates were 0.107, and MJ/kg/day for EFB, mesocarp fiber and kernel shell, respectively. Meanwhile, for kernel shell and mesocarp fiber, the rate was slower than EFB. This indicates a slower natural degradation process for mesocarp fiber and kernel shell. 20 Calorific Value [MJ/kg] Figure 10 Calorific value vs. time. 18
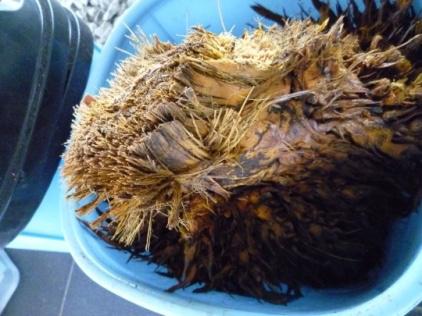
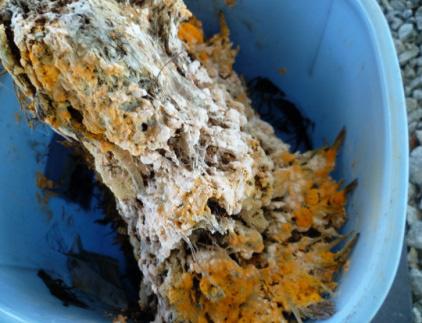
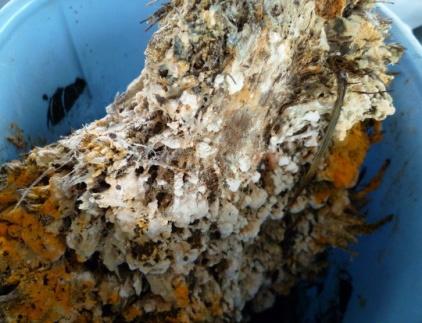
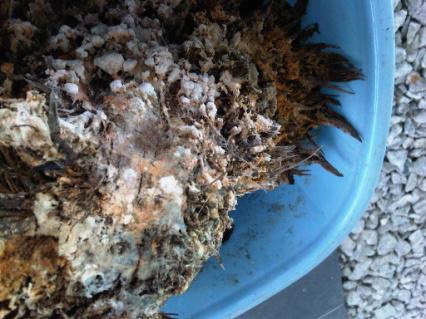
9 3.5 Ash content Changes in ash content are shown in Figure 11. The results showed that the ash content increased gradually with time. For EFB, the ash content increased from 4.0 to 9.3 wt%, meanwhile, for kernel shell, the ash content increased from 1.7 to 2.2 wt% and for mesocarp fiber, it increased from 3.2 to 6.3 wt% in 84 days. The increase in ash content was mainly attributed to decrease in organic matter content due to natural degradation of biomass. but somehow there were some greyish dust observed from day 56 onwards. As for kernel shell, the color of biomass bunch gradually changed from very dark brown to lighter brown at the end of natural degradation. Just like mesocarp fiber, there was no obvious-looking fungus observed at the kernel shell bunch. The odor was emitted during natural degradation. For EFB, the odor emission for the first 14 days was strong, where a bad smell was emitted. The bad smell at this stage could be from anaerobic Ash Content [wt%] Figure 11 Ash content vs. time. 3.6 Changes in odor and color of biomass Figures 12, 13 and 14 show appearance change of EFB, mesocarp fiber and palm kernel shell with time, respectively. During natural degradation, generally a gradual change in the color of biomass from darker to lighter color was observed. Although this change may not be reproduced in Figs. 12, 13 and 14 well, this is what was observed by eye inspection. For EFB, the fresh biomass at day 1 was brown in color, with wet surface of biomass. After 14 days, bright orange fungus was observed on the surface of biomass. The orange fungus started to disappear gradually from day 28 to day 84. digestion and fungi growth. However, from day 15 to day 42, the bad smell slowly decreased and from day 43 onwards, the biomass emitted a subtle smell of molds. For mesocarp fiber, the smell was emitted during the first 7 days only, where the smell was slightly bad but still bearable. After 7 days, mesocarp fiber only emitted a slight soil-like smell. As for kernel shell, there was no obvious bad smell emitted during natural degradation. Most of the time, the smell that came out from the bunch of kernel shell was only a slight soil-like smell. For mesocarp fiber, the color of biomass bunch gradually changed from dark brown to greyish brown. There was no obvious-looking fungus observed throughout the natural degradation process, 19

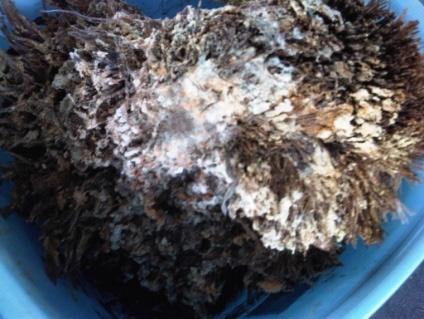
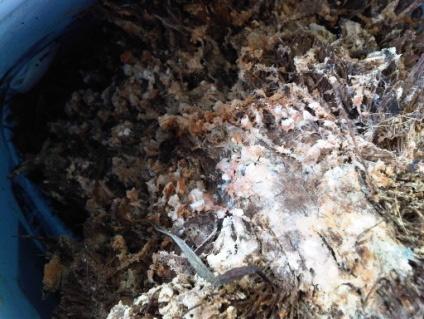
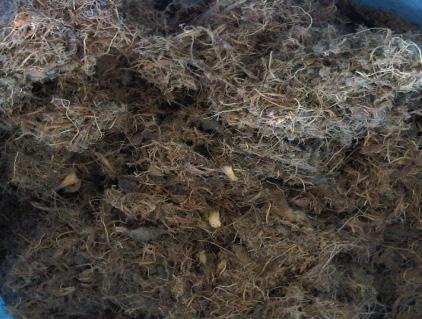
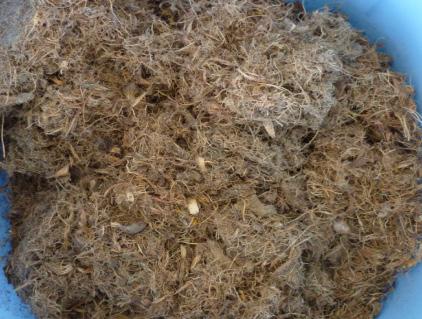
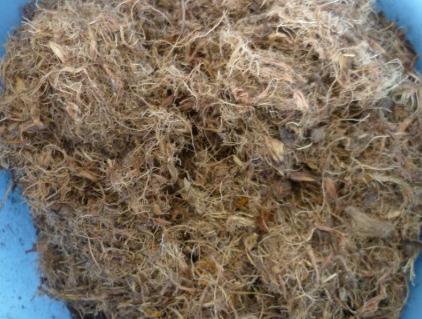
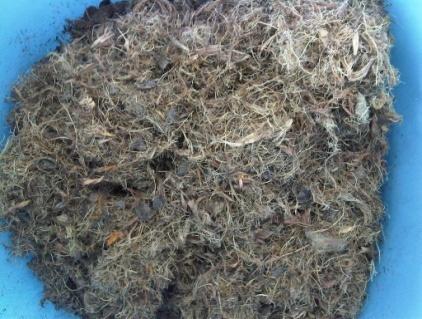
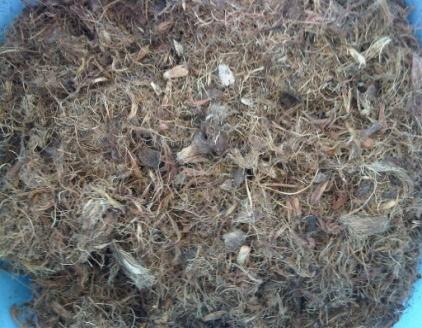
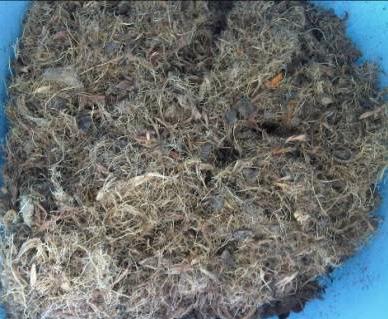
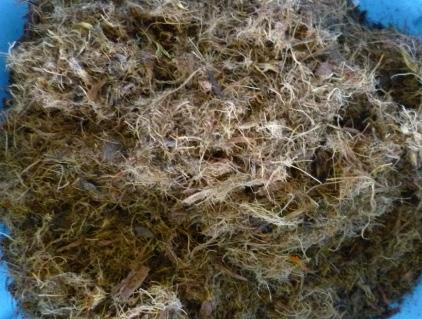
10 Thanh H. Trinh et al. / International Journal of Biomass & Renewables, 6(2) : 11-22, 2017 Day 14 Day 84 Day 28 Day 70 Day 42 Day 56 Figure 12 Appearance change of EFB with time. Day 14 Day 84 Day 28 Day 70 Day 42 Day 56 Figure 13 Appearance change of mesocarp fiber with time. International Journal Of biomass & renewables 20
, mesocarp fiber and kernel shell, underwent natural degradation in a plastic")


![Omar, T. Tsutsui, and S. B. Yusup, Torrefaction of oil palm wastes, Fuel, vol. 90, no. 8, pp. 2585-2591, Aug. 2011. [2] Y. Uemura, W. Omar, N. A. Othman, S.](/docs-images/89/99005893/images/11-5.jpg "Yusup, and T. Tsutsui, Torrefaction of oil palm EFB in the presence of oxygen, Fuel, vol. 103, pp. 156-160, Jan. 2013. [3] M. Phanphanich and S.")

11 Day 14 Day 28 Day 42 Day 84 Day 70 Day 56 Figure 14 Appearance change of palm kernel shell with time. 4 Conclusion Three types of oil palm residue, empty fruit bunches (EFB), mesocarp fiber and kernel shell, underwent natural degradation in a plastic container separately for 84 days. Different types of biomass showed different changing rates of natural degradation parameters with time, while the qualitative trends were the same among all types of the biomass used. It was found that natural degradation caused a decrease in the moisture content, carbon content and calorific value of biomass, while the nitrogen content and ash content of biomass increased. EFB underwent rapid degradation for the first 28 days. On the other hand, mesocarp fiber and kernel shell degraded slowly compared to EFB. The shelf life of EFB as a solid fuel may be less than a few days. On the other hand, the shelf life of mesocarp fiber and kernel shell may be several weeks. Acknowledgments The authors wish to thank the Mitsubishi Corporation Education Trust Fund for supporting this research. References [1] Y. Uemura, W. N. Omar, T. Tsutsui, and S. B. Yusup, Torrefaction of oil palm wastes, Fuel, vol. 90, no. 8, pp , Aug [2] Y. Uemura, W. Omar, N. A. Othman, S. Yusup, and T. Tsutsui, Torrefaction of oil palm EFB in the presence of oxygen, Fuel, vol. 103, pp , Jan [3] M. Phanphanich and S. Mani, Impact of torrefaction on the grindability and fuel characteristics of forest biomass, Bioresour. Technol., vol. 102, no. 2, pp , Jan [4] Y. Uemura, W. N. Omar, S. B. Razlan, S. B. Yusup, and K. Onoe, Bio-oil production from palm kernel shell with microwave irradiation, presented at the 19th European Biomass Conference and Exhibition, 2011, pp [5] J. Shen, X.-S. Wang, M. Garcia-Perez, D. Mourant, M. J. Rhodes, and C.-Z. Li, Effects of particle size on the fast pyrolysis of oil mallee woody biomass, Fuel, vol. 88, no. 10, pp , Oct [6] H. S. Heo et al., Bio-oil production from fast pyrolysis of waste furniture sawdust in a fluidized bed, Bioresour. Technol., vol. 101, no. 1, pp. S91-S96, Jan
12 [7] N. A. Saidina Amin, M. Misson, L. Haron, M. F. Ahmad Kamaroddin, W. N. N. Wan Omar, and K.-G. Haw, Bio-Oils and Diesel Fuel Derived from Alkaline Treated Empty Fruit Bunch (EFB), Int. J. Biomass Renew., vol. 1, no. 1, pp. 6-14, Jul [8] T. Tsutsui, S. Mitsuyoshi, I. Endo, and K. Mizuta, Conversion of ethylmethylketone and levulinic acid into petrochemicals over ZSM-5 as a biorefinery technology, Int. J. Biomass Renew., vol. 1, no. 1, pp , Jan [9] K. R. Gray, K. Sherman, and A. J. Biddlestone, A review of composting - Part 1. Microbiology and biochemistry, Process Biochem., vol. 6, no. 6, pp , Jan [10] P. O. Oviasogie, N. O. Aisueni, and G. E. Brown, Oil palm composted biomass: A review of the preparation, utilization, handling and storage, Afr. J. Agric. Res., vol. 5, no. 13, pp , Jul [11] M. Suhaimi and H. K. Ong, Composting Empty Fruit Bunches of Oil Palm, FFTC Publ., pp. 1-8, Nov [12] F. Alkoaik, A. Khalil, and T. Alqumajan, Performance evaluation of a static composting system using date palm residues, Middle-East J. Sci. Res., vol. 7, no. 6, pp , [13] J. L. Bowyer, R. Shmulsky, and J. G. Haygreen, Forest Products and Wood Science: An Introduction, 5th ed. Ames: Blackwell Publishing,