A Two-Stage Fluidized Bed Combustion Process for High PVC Solid Waste with HCl Recovery
|
|
|
- Franklin Grant
- 5 years ago
- Views:
Transcription
1 A Two-Stage Fluidized Bed Combustion Process for High PVC Solid Waste with HCl Recovery Loay Saeed & Ron Zevenhoven Helsinki University of Technology Energy Engineering & Environmental Protection Laboratory PO Box 44, FIN-215 Espoo Finland
2 Simplified process diagram HCl + water + N 2 Dry chlorine free fuel +Cold Sand Flue gas to heat recovery boiler High chlorine solid waste Reactor C Makeup sand Reactor C Cooling Nitrogen Heat exchanger Air Ash+Sand Hot sand Cooling Hot sand
3 Test facility scheme with measurement points


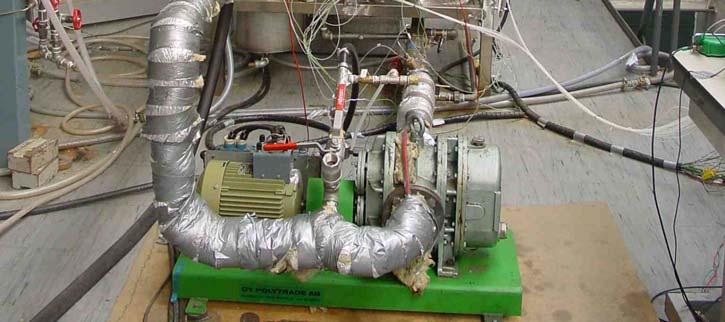
4 Front view of the two-stage combustion test facility
5 Design parameters for the two fluidized bed in the test facility Parameter BFB reactor CFB combustor Temperature, ( C) 2-4 < 9 Circular diameter, d i (m).4.11 Height, H r (m) Residence time of fuel, t (s) Fluidizing gas Nitrogen Air Superficial gas velocity, U o (m/s).36 (at 35 C) 5 7 (at 8 C) Minimum fluidization velocity, U mf (m/s).4 (at 35 C).3 (at 8 C) Particles terminal settling velocity of, U t (m/s) 2.6 (at 35 C) 1.8 (at 8 C) Gas flow, (liter/s STP) ~ 2 12 ~ 17 Expected product gas composition, (%-vol) 95 N 2, 1 H 2 O 4 HCl 71 N 2, 12 H 2 O, 15 CO 2, 1 O 2, ~2 ppm HCl
6 Pressure distribution of two-stage combustion test facility
, e: orange sewage PVC pipe (new) and orange sewage PVC pipe after")
7 Fuel types used in the facility tests, a: bottle grade PVC, b: wood w Finnish pine, c: Polish coal, d: light grey sewage PVC pipe (old), e: orange sewage PVC pipe (new) and orange sewage PVC pipe after grinding.
8 Properties of the bottle-grade PVC, wood (pine) and Polish coal Substance Bottle-grade PVC PVC waste 1 (sewage pipe) PVC waste 2 (sewage pipe) Wood (pine) Polish coal Ultimate analysis (%-wt, dry) C %-wt H%-wt, N%-wt, NA * NA NA S%-wt, NA NA NA NA.77 O%-wt, 1.8 NA (diff) 1.4 (diff) Cl%-wt, l NA NA Sn%-wt,.17 <.2 NA NA NA Pb%-wt, NA NA NA Cd (mg/kg), NA < 1 < 5 NA NA Ca%-wt, NA NA NA Zn (mg/kg) NA NA NA Sum Proximate analysis (%-wt) Fixed carbon ~ NA Volatile ~ NA Moisture 8. 6 Ash Higher heating value MJ/kg NA 2.7 NA Lower heating value MJ/kg NA 19.4 NA * Not analyzed, + Assumed, from (Zevenhoven et al., 22), Oxygen is calculated by difference not measured
9 Release of HCl and BFB reactor temperature versus time for bottle-grade PVC & sewage PVC waste 1 First reactor temperature, C First reactor temperature, C HCl concentration, ppm-v HCl release from first reactor, ppm-v First reactor temperature, C First reactor temp., C Hydrogen chloride HCl, ppm-v HCl release, ppm-v : :28 :57 1:26 1:55 2:24 2:52 3:21 3:5 4:19 4:48 5:16 5:45 6:14 6:43 7:12 Time, hr : :28 :57 1:26 1:55 2:24 2:52 3:21 3:5 4:19 4:48 5:16 Time, hr:m
10 HCl released from sewage pipe PVC waste First reactor temperature, C First reactor bed temp., C Hydrogen chloride HCl HCl concentration, ppm-v 5 2 : :28 :57 1:26 1:55 2:24 2:52 3:21 3:5 4:19 4:48 Time, hr:m
11 Other vapors release from BFB for real PVC No.2 First reactor bed temperature, C First reactor bed temp., C Methane CH4 Carbon monoxide CO Benzene C6H CH 4, CO and C 6 H 6 release, ppm-v : :28 :57 1:26 1:55 2:24 2:52 3:21 3:5 4:19 4:48 Time, hr:m
12 Other vapors release from BFB for real PVC No.2 4 First reactor temperature, C 3 First reactor bed temperature, C Ethene C2H4 Toluene C7H8 Propene C3H C 2 H 4, C 7 H 8 and C 3 H 6 release, ppm-v : :28 :57 1:26 1:55 2:24 2:52 3:21 3:5 4:19 4:48 Time, hr:m
13 Chemical analysis of (dry) char samples taken from the pyrolysis reactor (BFB) after the tests, for bottle-grade PVC, PVC waste No.1 and PVC waste No.2 Substance Bottle-grade PVC Top of the bed Middle of the bed PVC waste 1 (sewage pipe) PVC waste 2 (sewage pipe) C (%-wt) H (%-wt) O (%-wt) NA NA NA * 1.6 Cl (%-wt) Sn (%-wt) NA NA NA NA Pb (%-wt) NA NA Cd (mg/kg) NA NA NA NA Ca (%-wt) NA NA NA.8 Zn (mg/kg) NA NA NA.3 Bed material (%-wt)** Sum %-wt * NA = not analysed ** By difference
14 HCl emission from CFBC for bottle-grade PVC Temperature, C PVC feeding First reactor temperature, C Second reactor temperature, C HCl HCl release, ppm-v 5 : :28 :57 1:26 1:55 2:24 2:52 3:21 Time, hr:m
15 CO 2 & H 2 O release from CFBC for bottle-grade PVC Second reactor bed temp., C Carbon dioxide CO2, % Water H2O, % Second reactor temperatur, C PVC feeding H 2 O & CO 2, % : :28 :57 1:26 1:55 2:24 2:52 3:21 Time, hr:m
16 Other vapors release from CFBC for bottle-grade PVC 5 7 Second reactor temperature, C Second reactor bed temp., C Carbon monoxide CO, ppm-v Methane CH4, ppm-v Ethene C2H4, ppm-v Benzene C6H6, ppm-v PVC feeding : :28 :57 1:26 1:55 2:24 2:52 3:21 Time, hr:m Gases emission from second reactor, ppm
17 HCl release from bottle-grade PVC No.2 in the BFB & CFBC Temperature, C : :28 :57 1:26 1:55 2:24 2:52 3:21 Time, hr:m 1 Temperature first reactor, C 2 Temperature second reactor, C 3 Chlorine in (mol) 4 HCl first reactor, mol 5 HCl second reactor, mol HCl total release, mol
18 HCl,, CO, H 2 O & CO 2 emission from CFBC (PVC sewage pipe No.2) HCl and CO, ppm-v CO HCl Water vapor H2O Carbon dioxide CO H 2 O & CO 2 emissions, % 2.2 : :28 :57 1:26 1:55 2:24 2:52 Time, hr:m
19 Other vapors from CFBC (PVC sewage pipe No.2) 35 6 CH 4, C 2 H 6, C 2 H 4, C 6 H 6, C 7 H 8 and C 3 H 6, ppm-v Methane CH4 Ethane C2H6 Ethene C2H4 Benzene C6H6 Toluene C7H8 Propene C3H6 Second reactor bed temp Second reactor bed temperature, C : :28 :57 1:26 1:55 2:24 Time, hr:m
20 HCl release from real PVC No.2 in the BFB & CFBC First reactor temperature, C Temperature first reactor ( C) 2 Chlorine in (mol) 3 HCl first reactor (mol) 4 HCl second reactor (mol) HCl total first reactor (total test), mol 3 : :28 :57 1:26 1:55 2:24 2:52 Time, hr:m 4
21 Analysis result for the dioxins, furans and other chlorinated compound (char from PVC waste 2) Compounds Char (ng/g) I-TEQ (ng/g) Dioxins (PCDD): Furans (PCDF): Polycyclic aromatic hydrocarbon (PAH) 2318 Chlorinated phenols 352 Polychlorinated biphenyls (PCB) all < 1 Polychlorinated benzenes 149
22 Conclusions A lab-scale facility was built for wastes containing large amounts of PVC, using the fact that PVC de-hydrochlorination is complete at temperatures of 3-35 C. The Cl content in the char for the two-stage combustion test using 1% bottle-grade PVC was below.1%-wt (from 51%-wt in the PVC), at chlorine-to-carbon mass ratio <.1 kg Cl / kg C. The two-stage combustion test with 1% waste PVC (sewage pipe) shows that the char chlorine content 5%-wt (from 54%-wt in the PVC) at chlorine-to-carbon mass ratio <.6 kg Cl / kg C can be produced. Very small amounts of PCDD (.78 ng/g,.155 ng TEQ/g) and PCDF (2.5 ng/g,.35 ng TEQ/g) TEQ/g) were found in the char PVC stabilizer type and the fractional weight of the stabilizer has a large effect on the behavior of PVC waste de-hydrochlorination at 2-4 C, specially lead based stabilizers, cadmium compounds (Cd) stabilizers etc. The temperature in CFBC was not enough to burn the char. Electrical heaters must be added to the CFBC beside the air preheater.
23 Final Remarks PhD defense Loay Saeed June 18th, 24, Espoo, Finland The test facility has won a year 24 Facility Recognition Award of the ASME (American Society of Mechanical Engineers) Solid Waste Processing Division.
24 ACKNOWLEDGEMENTS Finland s s Technology Agency TEKES Foster Wheeler Energia Oy Finnish Plastics Industries Federation Borealis Polymers Oy Ekokem Oy Ab Prof. Carl-Johan Fogelholm HUT technicians Pertti, Risto, Seppo, Taisto, Vadim Temet Oy, Matti Haapala,, Helsinki

25 Behavior of bubbles just above the distributor Porous plate Perforated plate Nozzle-type tuyere Babble cap tuyere
26 The Desired Properties of the Distributor Uniform and stable fluidization over the entire operation Minimum attrition of bed material Minimum erosion of bed internals or heat exchanger tubes tubes Minimum back-flow of solids into the plenum chamber Minimum amount of dead zone on the distributor Minimum plugging over extended periods of operation