Energy Reduction and Biological Process Performance Improvements with Right-Sized Equipment and Next-Generation Process and Aeration Controls
|
|
|
- Corey George
- 5 years ago
- Views:
Transcription


1 52 nd Annual Conference October 2018 Energy Reduction and Biological Process Performance Improvements with Right-Sized Equipment and Next-Generation Process and Aeration Controls

2 Operations Engineering Civil / Mechanical / I&C Management
3 SCADA Process / Aeration Control
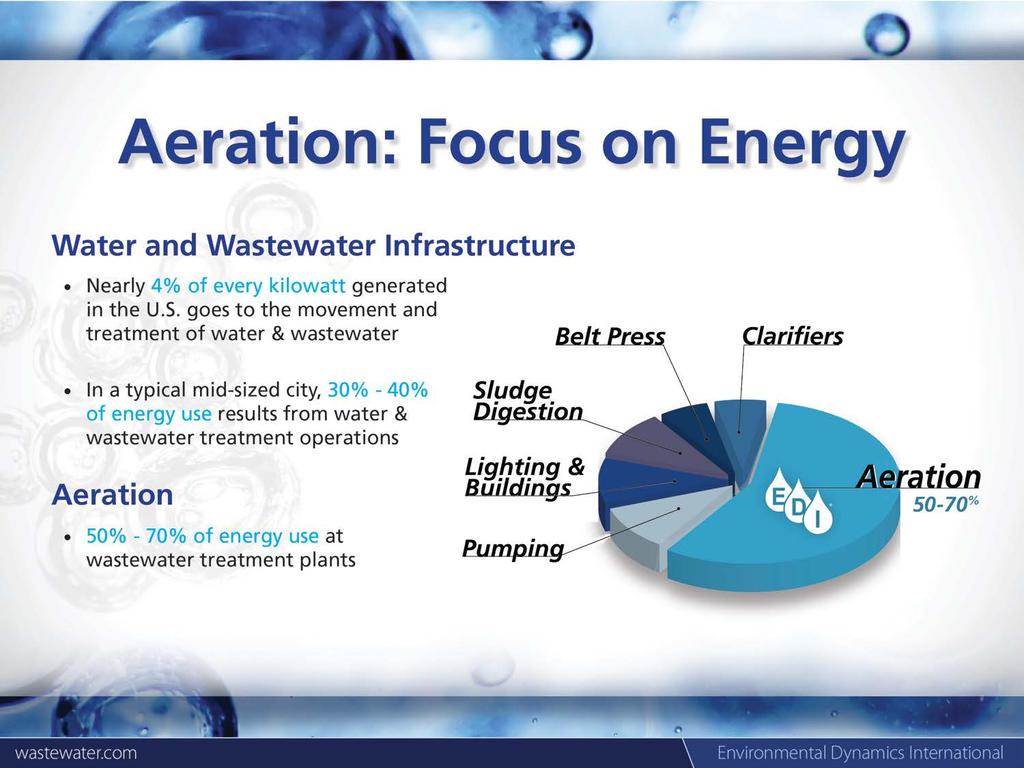
4 Energy Reduction and Biological Process Performance Improvements Aeration? Process Optimization


5 Lebanon, PA 10MGD Reference Sites Denver Metro 140MGD Bailonggang, China 1BGD True hands free performance when in auto, we are exceeding our goals 45% Reduction in Aeration Energy 55% Less TN Discharge Against permitted limit* 13.5% Reduction in Aeration Energy *PI aeration control; greater savings available with next-gen aeration control 20% Reduction in Aeration Energy $500,000 savings per year 20 month payback
![Airflow Reduction Potential (Operating residual DO concentration) OTE f = αf (SOTE) [ β (C s,t ) C] / C](/docs-images/89/99015051/images/6-0.jpg "s,t Operations ENERGY USE Aeration Savings* * Assuming constant oxygen demand Required DO Set Point")
6 Airflow Reduction Potential (Operating residual DO concentration) OTE f = αf (SOTE) [ β (C s,t ) C] / C s,t Operations ENERGY USE Aeration Savings* * Assuming constant oxygen demand Required DO Set Point [mg/l]
7 Plant Performance Getting the most from the Plant Capacity, Energy Efficiency & Process Performance Right Sized Physical Assets Asset Management Smart Automation
8
9
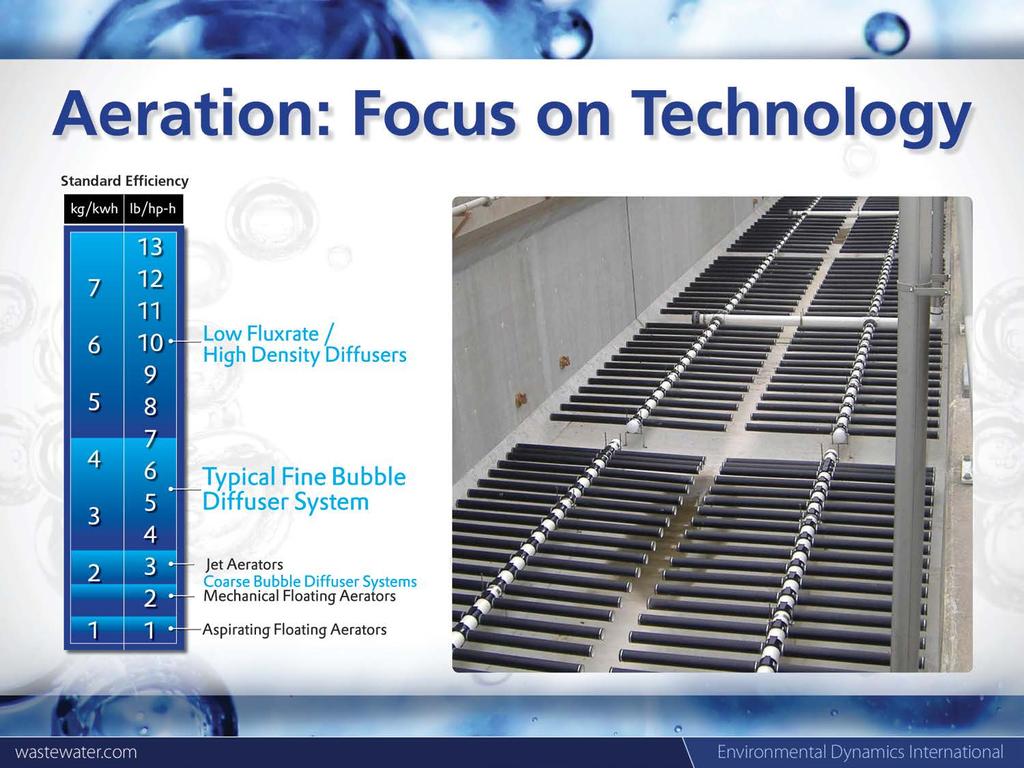
10 Lessons Learned Up to 50% reduction in aeration energy available from diffuser product selection


11 Up to 50% reduction in aeration energy available from diffuser product selection Right-sized blower Lessons Learned

12 Up to 50% reduction in aeration energy available from diffuser product selection Right-sized blower Right-sized mixing Lessons Learned Mix with diffusers Independent mixing

13 Effective Utility Management Operational Excellence More Tools Better Tools Right Sized Physical Assets
14 Plant Performance Getting the most from the Plant Capacity, Energy Efficiency & Process Performance Right Sized Physical Assets Asset Management Smart Automation
15 The Modern Plant (biological treatment unit) Operator s Challenge What DO, Where, Why, and How?
16 Nitrification Nitrifier Growth Rate 0.16 Operations PROCESS OPTIMIZATION u, 1/day Traditional Basis of Design - Operate at max nitrification rate - Size reactors for max load residual DO, mg/l
17 Ammonia Profile Fixed DO Setpoint Design NH 4 Loading Near complete ammonia conversion at max load Operations PROCESS OPTIMIZATION Influent Ammonia Less than design NH 4 Loading Distance Along Aeration Tank Effluent Ammonia Full nitrification well within the tank at reduced loads Endogenous decay at reduced loads Proportional reduction in aeration during low loads
18 Nitrification Nitrifier Growth Rate 0.16 Operations PROCESS OPTIMIZATION u, 1/day Minimal impact >2mg/L Significant impact <2mg/L residual DO, mg/l
19 Ammonia Profile Dynamic DO Setpoint(s) Near complete ammonia conversion at max load Operations PROCESS OPTIMIZATION Influent Ammonia High NH 4 Loading Design DO Set Point Low NH 4 Loading Reduced DO Set Point Effluent Ammonia DO adjusted to yield desired nitrification rate based on load Healthier bugs; improved SVI & kinetics Distance Along Aeration Tank Additional reduction in aeration during low loads
20 What DO, where and why? Simultaneous Nitrification and Denitrification Operations PROCESS OPTIMIZATION Courtesy of Jimenez, J, Brown and Caldwell

21 The Modern Plant (biological treatment unit) Operator s Challenge What DO, Where, Why, and How? Aeration Controls Process Controls
22 Precision Manual? Accuracy Efficiency What is Good Automation? Enough? Aeration Control

23 Precision Simultaneous Nitrification and Denitrification Accuracy Efficiency Courtesy of Jimenez, J, Brown and Caldwell Aeration Control

24 Technical Reference Current Generation Industrial (PID) Controls 2014 page DO control is one of the most difficult control loops to implement since DO control is nonlinear, has significant process time lags, is a multivariable process, and has extreme variations in loading. These factors make the PID algorithm poorly suited for DO control.

25 State of the Market - Reference Site(s) Std Industrial (PID) Controls hr time period DO oscillates between values as low as 1.9 mg/l and as high as 5 mg/l

26 State of the Market - Reference Site(s) hr time period DO oscillates between values as low as 0 mg/l and as high as 4 mg/l


27 Technical Reference Current Generation Industrial (PID) Controls Control Loop Half-Life 6 Months
28 Plant Performance Getting the most from the Plant Capacity, Energy Efficiency & Process Performance Right Sized Physical Assets Asset Management Smart Automation
 IBM -")
29 Modern WWTP (BNR) Next-Generation Controls How are they different? Learned- Knowledge 4 th Industrial Revolution brownandcaldwell Convert data into action (model - based algorithms) IBM - Watson Google - Know what your data knows EDI - Learned Knowledge
30 Next - Generation Controls - Cyprus / Camelot day time period DO oscillates by no more than 0.5 mg/l from zone setpoint, 95% of the time guaranteed automation tolerance

31 The Modern Plant (biological treatment unit) Operator s Challenge What DO, Where, Why, and How?
32 Process Optimization Control Conventional Ammonia-based Aeration Control (ABAC) Feedback control Adjust residual DO setpoint based on effluent ammonia concentration Classic Aeration Control DO Setpoint Feedback ABAC NH4 Proportional or Step Function Algorithm Influent Effluent Anoxic Aerobic Aerobic Aerobic
33 Process Optimization Control Next-Generation Process Optimization Control (ABAC) Feed-forward process algorithm 1 st full-scale installation in 2004 Evaluates process responses to influent conditions Calculates best setpoints for desired treatment Evaluates setpoints for lowest power use Auto-corrects for temperature Self-tunes using feed-back loop PAL Aeration Aeration Process Control Model DO Setpoints Feed-Forward BIOS Flow Biological Process Model Control NH4 SCADA Influent Effluent Anoxic Aerobic Aerobic Aerobic NH4
34 Next Generation Process Optimization and Aeration Control Monitors Influent Predicted Effluent Performance = Actual Effluent Performance Dynamic DO Setpoints 34 guaranteed optimized process setpoints
35 Precision Manual? Accuracy Efficiency What is Good Automation? Enough? Aeration Control


 Airflow")
36 Current Generation Aeration Control System Equipment Life High Service Duty Application - Short Equipment Service Life (valves, actuators, & potentially blowers) Airflow (valve & blower) Modulation

37 Next Generation Aeration Control System Airflow (valve & blower) Modulation Equipment Life Normal Service Duty - Eliminates Premature Equipment Failure (as few as 1/10 th number of starts)
38 Plant Performance Getting the most from the Plant Capacity, Energy Efficiency & Process Performance Right Sized Physical Assets Asset Management Smart Automation
39 The Future & The 4 th Industrial Intelligent Design Revolution Multi-Level Operating Strategies Reliability- Centered Maintenance Smart Automation Real-Time Process Optimization Fault Detection Isolation Recovery Analytics Advanced Aeration Control Learned Knowledge Optimized Setpoints Precise, Accurate & Efficient Aeration Control All with No Retuning
40 The Future & the 4 th Industrial Revolution Multi-Level Operating Strategies Real-Time Process Optimization Intelligent Design Smart Automation Advanced Aeration Control Learned Knowledge Quantifies Efficiency Losses (fouling) Reliability- Centered Maintenance Fault Detection Isolation Recovery Analytics Learned Knowledge Knows when a Fault Condition exists
41 The Future & the 4 th Industrial Revolution Learned Knowledge Knows the Operating Potential and Key Design Factors for Equipment Intelligent Design Multi-Level Operating Strategies Smart Automation Real-Time Process Optimization Advanced Aeration Control Reliability- Centered Maintenance Fault Detection Isolation Recovery Analytics
42 The Future & the 4 th Industrial Revolution Learned Knowledge Provides Direct Operational Control and Supports Precise Operational Strategies Intelligent Design Multi-Level Operating Strategies Reliability- Centered Maintenance Smart Automation Real-Time Process Optimization Fault Detection Isolation Recovery Analytics Advanced Aeration Control
43 Lessons Learned Aeration to excess is old school Significant savings (electricity) and process gains are available Tools are available to help you get the most from your plant Right-sized equipment (aeration, blowers, and mixers), both capacity and turndown, is critical All plants benefits; software upgrade for existing aeration control systems Next-generation digital solutions is the pivotal technology advancement that closes many gaps Lets give operations the tools they need to get the most from the plant


44 Opportunity Potential 1 Annual Savings, $50,000 Next Gen Process Controls Savings Electricity High process optimization No tuning labor Extended actuator life High operational confidence, FDIR Targeted equipment maintenance, RCM 1 Assumes 1MGD, 4mg/L DO condition, $0.11/kWh, aeration hp = 2mg/L DO, approx. $125k annual power
45 52 nd Annual Conference October 2018 Energy Reduction and Biological Process Performance Improvements with Right-Sized Equipment and Next-Generation Process and Aeration Controls
46 46