Appendix C: Wetland Functional Values Assessment Methodology
|
|
|
- Nigel George
- 5 years ago
- Views:
Transcription
1 Appendix C: Wetland Functional Values Assessment Methodology Carver County Water Plan September 2010 Appendix C: Wetland Functional Values Assessment Methodology C1
2 Carver County Wetland Assessment Contents Carver County Wetland Assessment Contents (continued) GIS Based Wetland Assessment Method Functional Values Runoff Flood Shoreline Hydrologic Water Quality Habitat Landscape and Wetlands Aesthetics Field Check Alternative Functional Values Runoff Flood Habitat Aesthetics Water Quality Combined Functional Values Landscape and Wetlands Stormwater Natural Resources Water Quality Buffer Recommendations Restoration Stormwater Natural Resources Water Quality Overall Functional Value Management Discussion Continue to next slide for buffer and restoration assessments 1 2
3 GIS Based Wetland Assessment Method Carver County s Wetland Inventory and Functional Value Analysis was based on Doug Snyder s report entitled A GIS Based Wetland Assessment Methodology for Urban Watershed Planning After the MN Board of Soil and Water Resources performed a pilot wetland assessment using this methodology in the Norwood Young America area, the Carver County Water Plan task forces decided it would be helpful to perform the assessment county-wide. This presentation is the documentation of the process and results. GIS Based Wetland Assessment Method The purpose of the wetland assessment methodology is to aid the county in their efforts to organize, prioritize, and manage wetland resources in a comprehensive manner. This is intended to be viewed as a dynamic document and database integrated with GIS. Changes should be made to this model as more information becomes available. This information may be used to enhance the county s environmental and economic sustainability by identifying high functioning, high valued wetland communities and developing strategies to preserve and manage them. 3 4
4 Functional Values Surface Water Runoff Evaluates storage results for the attenuation of peak high and low stream flows by the storage and slow release of water. Flood Water Storage Evaluates potential significance in providing temporary storage of flood waters to alleviate down stream flooding. Shoreline Stabilization Evaluates significance of sediment runoff reductions by holding the soil and shoreline in place in the face of erosive forces. Hydrologic Control Combines the three functions above into an overall functional value for stormwater management. Functional Values Water Quality Evaluates potential for removal of sediment and related pollutants from overland runoff and precipitation. Habitat The objective is to evaluate habitat quality to best suit the greatest number of species. Landscape and Wetland Characteristics Evaluates the wetland s relation to the landuse and wetlands as elements of the landscape. It tries to dt determine the relative lti risk ikto the watershed hd integrity posed by wetland loss. 5 6


5 Functional Values Aesthetics Evaluates to the extent possible the things which most people agree add to the beauty of natural scenes. Restoration This assessment did not follow the given methodology, rather it applied the methodology for existing wetlands to those that no longer exist. The goal was to evaluate wetlands that have been drained or filled that would help develop and sustain the existing surface water/wetland matrix if restored. Final Runoff Functional Value Combining landscape and wetland functions for runoff into a final assessment. Both high All other combinations Both low or one low and one moderate 7 8


")

6 Stream Order (Landscape Function) Runoff The stream/ditch order number connected to the wetland basin. h 1 st order or no stream/ditch 2 nd or 3 rd order 4 th order or greater Wetland Area/Watershed Area (Landscape Function) The ratio of the wetland area to the subwatershed area. >/= >/= 0.05 and <0.02 <0.05 Runoff 9 10
 Runoff Circular 39")


7 Gradient of Contributing Landscape (Landscape Function) Runoff Circular 39 Wetland Type (Wetland Function) Runoff The greatest area covered by slopes ranging below from wetland to 800m out. >/= 6% slope >/=2% and <6% slope <2% slope The predominant wetland type for the basin. Types 3, 4, 5, 6, 7 Types 2 Types 1,
")


8 Soil Hydrologic Group (Wetland Function) Runoff Wetland Area (Wetland Function) Runoff The greatest area covered by soils types below from wetland to 800m out. A, B soils C, A/d, B/d soils D, C/d soils The area of the wetland basin. >/= 5 acres >/= 1and <5 acres <1 acre 13 14


9 Final Flood Functional Value Combining landscape and wetland functions for flood into a final assessment. Both high or one high and one moderate All other combinations Both low or one low and one moderate Stream Order (Landscape Function) The stream/ditch order number connected to the wetland basin. 4 th order or greater 2 nd or 3 rd order 1 st order or no stream/ditch Flood 15 16
 Flood Adjacent")


10 Wetland Area/Watershed Area (Landscape Function) Flood Adjacent Land Cover (Landscape Function) Flood The ratio of the wetland area to the subwatershed area. >/= >/= 0.05 and <0.02 <0.05 The % urban and/or ag landuse within 800m of the basin. g >/= 50% >/=25% and <50% <25% 17 18
 Flood")


11 Circular 39 Wetland Type (Wetland Function) Flood Flooding and Ponding Potential (Wetland Function) Flood The predominant wetland type for the basin. Types 6, 7 Types 3, 4, 5, 90 Types 1, 2 The potential ti for soils in wetland basin to hold water for a period of time. Occasional to frequent Seasonal Infrequent 19 20


12 Wetland Area (Wetland Function) The area of the wetland basin. >/= 5 acres >/= 1and <5 acres <1 acre Flood Final Shoreline Functional Value Combining landscape and wetland functions for shoreline into a final assessment. g Both high or one high and one moderate All other combinations Both low or one low and one moderate 21 22
 Shoreline Adjacent Land Cover")


13 Proximity to a Water Body (Landscape Function) Shoreline Adjacent Land Cover (Landscape Function) Shoreline Basin connection o to water bodies. Stream order >/=2 or lake >/= 10 acres Stream order =1 or lake >/=2.5 and <10 acres All other wetlands The % urban and/or ag landuse within 800m of the basin. g >/= 50% >/=25% and <50% <25% 23 24
 Shoreline The %")


14 Proximity to Upland Erodible Soils (Landscape Function) Shoreline The % area of soils within 200m of the basin that are highly erodible. >/= 25% >/=10% and <25% All others Edge Length Exposed to Open Water (Wetland Function) Shoreline The edge length of basin exposed to open water. >/=200m >/=60m and <200m <60m 25 26


15 The predominant wetland type for the basin. Types 6, 7, 90 Types 2, 3, 4, 5 Type 1 Circular 39 Wetland Type (Wetland Function) Shoreline Hydrologic Functional Value This function combined runoff, flood, and shoreline into a hydrologic control value One or more is high All other combinations Two or three are low and none are high 27 28


16 Final Water Quality Functional Value Combining landscape and wetland functions for water quality into a final assessment. g Both high or one high and one moderate All other combinations Both low or wetland is low and landscape is moderate Proximity to Pollutant Sources (Landscape Function) Water Quality The % urban and/or ag landuse within 200m of the basin. g >/= 50% >/=15% and <50% <15% 29 30
 Water Quality The % area of soils")

 Water Quality The")

17 Proximity to Upland Erodible Soils (Landscape Function) Water Quality The % area of soils within 200m of the basin that are highly erodible. >/= 25% >/=10% and <25% All others Stream Order (Landscape Function) Water Quality The stream/ditch order number connected to the wetland basin. 1 st order or no stream/ditch 2 nd or 3 rd order 4 th order or greater 31 32


18 The predominant wetland type for the basin. Types 3, 4, 5 Types 6, 7 Types 1, 2, 90 Circular 39 Wetland Type (Wetland Function) Water Quality The greatest area covered by soils types below from wetland to 800m out. A, A/d soils B, B/d, C, C/d soils D soils Soil Hydrologic Group (Wetland Function) Water Quality 33 34


19 Final Habitat Functional Value Combining landscape and wetland functions for habitat into a final assessment. Both high or one high and one moderate All other combinations Both low or one low and one moderate Adjacency to Other Wetlands (Landscape Function) Distance from wetland to other wetlands. g </=200m </=800m >800m (isolated) Habitat 35 36


20 Landuse for Habitat (Landscape Function) Habitat Connection to Water Bodies/Natural Vegetation (Landscape Function) Habitat Landuse type within 800m of wetland >50% natural a Moderate All other land cover combinations >50% developed Connection to contiguous natural vegetation, lake, stream, or ditch. Connected Within 200m Greater than 200m 37 38

 Habitat Interior Habitat")


21 Wetland isolation (>800m from other wetlands) and size. Isolated and >/=5 acres Isolated and >/=5 and <1acres Wetlands <1 acre Wetland Island (Landscape Function) Habitat Interior Habitat Complex (Wetland Function) Ratio of wetland perimeter to the perimeter of a similar wetland if it were a perfect circle. Ratio >0.90 High Ratio </=0.90 Moderate and >0.65 Low Ratio </=0.65 Ratio Habitat 39 40
 Habitat The")


 Semi-permanently,")
22 Circular 39 Wetland Types (Wetland Function) Habitat Wetland Water Regime (Wetland Function) Habitat The number of wetland types in the basin helps define vegetation diversity. >/= 4 types 2 or 3 types L 1 type The predominant wetland water regime using Cowardin type. Permanent open water, intermittently exposed, or permanently flooded d (G, H) Semi-permanently, intermittently, or seasonally flooded (F) Saturated or temporarily flooded (A, B, C, D, E) 41 42


23 Final Landscape Functional Value Combining landscape and wetland functions for landscape into a final assessment. Both high or one high and one moderate All other combinations Both low or one low and one moderate Return to Alternative Analysisi The % ag landuse within the minor watershed. g >/= 50% >/=20% and <50% <20% % Subwatershed Ag Landuse (Landscape Function) Landscape 43 44

 Landscape % Subwatershed Composed of")

24 The % urban landuse within the minor watershed. >/= 10% >/=2.5% and <10% <2.5% % Subwatershed UrbanLanduse (Landscape Function) Landscape % Subwatershed Composed of Wetlands (Wetland Function) Landscape The % of wetlands within the minor watershed. g </= 15% >15% and </=50% >50% 45 46
 Landscape The % the")


25 % Watershed Composed of Wetland Type (Wetland Function) Landscape The % the wetland s within the major watershed. g </= 15% >15% and </=50% >50% % Watershed Composed of Wetland Type (Wetland Function) Landscape The % of the wetland s predominant circular 39 type within the major watershed. <10% >/=10% and <25% >/=25% 47 48


26 Final Aesthetic Functional Value Combining landscape and wetland functions for aesthetics into a final assessment. Both high or one high and one moderate All other combinations Both low or one low and one moderate The % urban landuse within 800m of the basin. g < 10% >/=10% and <50% >/=50% Adjacent Landuse (Landscape Function) Aesthetics 49 50
")


27 Distance from Roads (Landscape Function) Aesthetics Circular 39 Wetland Types (Wetland Function) Aesthetics The distance from Highway 1 or County 2 roads. g >/= 800m >200m and <800m </=200m The number of wetland types for the basin. 3 or more types 2 types 1 type 51 52
 Aesthetics Wetland")


28 Circular 39 Predominant Wetland Type (Wetland Function) Aesthetics Wetland Structure (Wetland Function) Aesthetics The predominant wetland type for the basin. Types 3, 4, 5, 90 Types 2, 6, 7 Type 1 The number of wetland stories based on Cowardin classification (EM, SS, FO, OW). 3 or more layers 2 layers 1 layer 53 54


29 Presence of Upland Inclusions (Wetland Function) The presence of non-hydric soils within wetlands types 3, 4, 5, and 90 (island). Inclusions exist Not applicable No inclusions Aesthetics Field Inventory Wtl Wetlands were randomly selected and visited for inspection 55 56


30 Field Inventory Information collected included: 1. Does the wetland exist? 2. Does it appear to meet the conditions of the dominant type (hydrologic judgement, only)? Field Inventory Analysis For the most part, the NWI wetlands exist. Wetlands appear more dry than the NWI tables. Only 7 of the 47 wetlands observed had similar water regimes. Statistical evaluation to the 95% confidence level gives a 5% to 25% chance the wetlands are properly p classified. Visual assessments indicate greater degradation from human/animal impacts than anticipated. Functional value assessment should not include dominant wetland type or water regime because of the inaccuracy
31 Alternative Functional Values Based on the GIS mapping, database analysis, and field inventory, the following alterations were functional value assessments were used for evaluation purposes: 1. Use the Landscape and Wetland Characteristics for discussion purposes. 2. Combine the flood and runoff function into a Stormwater Function. 3. Combine the habitat and aesthetics function into a Natural Resource Function. 4. Use the Water Quality Function as is. 5. Review the High Functional Values for management discussion. Landscape and Wetland Characteristics This function evaluates the relative risk to watershed integrity posed by the wetland s loss. 95% of the wetlands are high. With more than 80% of the County s wetlands drained or filled; this analysis emphasizes that all the remaining wetlands in Carver County are very important to the landscape. Wetlands provide important functions to the watershed systems. Return to Alternative Analysisi Map 59 60
32 Concepts Considered in Developing the Stormwater Function Evaluate flood and runoff only. Remove shoreline due to repetition. The functions used to evaluate shoreline appeared to be covered in the flood, runoff, and water quality functions. Wetland size had the strongest t correlation to the final runoff (0.56)and flood (0.72) functional values. Circular 39 Wetland Type function was removed because not dependable. Oh Other functions were evaluated together (stream order, flooding/ponding potential, soil infiltration, wetland size, ratio of wetland size to watershed area, landscape gradient, adjacent landuse). Adjustment to Runoff and Flood Final Wetland Indicator The wetland indicator portion for runoff and flood (after removing the Circular 39 Wetland Type) were evaluated as follows: Runoff Soil hydrologic group and and wetland area functions: both high at least one moderate at least one low and no highs. Flood Flood potential and and wetland area functions: both high at least one moderate at least one low and no highs


33 Alternative Final Runoff Result This is the result of evaluating the landscape and wetland indicators together after adjustments were made to the wetland indicator. This is the result of evaluating the landscape and wetland indicators together after adjustments were made to the wetland indicator. Alternative Final Flood Result 63 64


34 Stormwater Functional Value The flood oodand runoff functions were e re-evaluated eva after adjusting the wetland indicator. The finals were then combined as shown below to form the stormwater functional value. High Both high or one high and one moderate Moderate All other combinations Low Both low or one low and one moderate Final Stormwater Functional Values Return to Alternative Analysisi 65 66
35 Concepts Considered in Developing the Natural Resources Function Evaluate habitat t and aesthetics ti only. Did not evaluate habitat function for interior habitat. Many of the very small wetlands appeared to have a large amount of interior habitat because the ratio of the perimeter to that of a perfect circle were very close to 1. Did not evaluate habitat function for water regime because not dependable. Dominant Circular 39 wetland type for the aesthetic function was removed because not dependable. Adjustment to Habitat and Aesthetics Final Wetland Indicator The wetland indicator portion for habitat and aesthetics (after removing certain functions as discussed on previous slide) were evaluated as follows: Aesthetics Evaluated number of types, Habitat structural layers, and Evaluated vegetative upland inclusions: diversity table only: at least two >/= 3 types highs 2 types 1 type all others at least two lows and no highs


36 Alternative Final Habitat Result This is the result of evaluating the landscape and wetland indicators together after adjustments were made to the wetland indicator. This is the result of evaluating the landscape and wetland indicators together after adjustments were made to the wetland indicator. Alternative Aesthetics Result 69 70
. Then the functions were combined as shown below to form the natural resource functional value.")
37 Natural Resource Functional Value After the habitat and aesthetics functions were reevaluated after adjusting the wetland indicator, the final habitat and aesthetic functions were re-evaluated (wetland and landscape). Then the functions were combined as shown below to form the natural resource functional value. High Both high Moderate All other combinations Low Both low or one low and one moderate Return to Alternative Analysisi Final Natural Resource Functional Values 71 72
38 Concepts Considered in Developing the Water Quality Function Evaluate water quality only. Did not evaluate water quality function for wetland type because not dependable. Adjustment to Water Quality Final Wetland Indicator The wetland indicator portion for water quality (after removing wetland type and adjusting the soil infiltration table) was evaluated as follows: Water Quality Evaluated soil infiltration table only based on highest percent area of the following hydrologic soil groups: A, A/d B, B/d, C, C/d D 73 74

39 Water Quality Functional Value The water quality function was re-evaluated eva after adjusting the wetland indicator. The final water quality functional value was based on the water quality landscape and wetland indicators only where: High Both high or one high and one moderate Moderate All other combinations Low Both low or wetland low and landscape moderate Return to Alternative Analysisi Final Water Quality Functional Values 75 76


40 Highs Combined for Alternative Functional Value Assessment Matrix Analysis for Establishing Buffers Return to Alternative Analysisi The technical advisory committee recommended the development of a matrix for classifying wetlands for buffers. The matrix consists of the options available when combining the stormwater, natural resource, and water quality functions. After re-evaluating the water quality function, a great deal of overlap was recognized between the water quality tables and the stormwater t tables (runoff and flood)
41 Water Quality Function Similarities to Stormwater Function Wetland type not used in either tables. Stream order same as runoff table. Soil infiltration fairly similar to runoff, but used runoff analysis where the highs include the B soil types. Proximity to pollutants similar to flood landuse, except the analysis in the flood function goes out 800m where the water quality function goes out 200m. HEL soils is similar to runoff gradient function. The correlation between the HEL and gradient was When the HEL table was added to the runoff landscape function, there was essentially no difference in the highs (3034 with the HEL soils vs. 3031without the HEL soils for the final landscape analysis) generated. The stream order defined the outcome to the landscape analysis. Buffer Matrix Basin Stormwater/ Natural Rating Water Quality Resource H H H H H M H M H M M M M L M M L H M H L L M L L L L 79 80


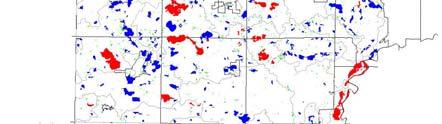
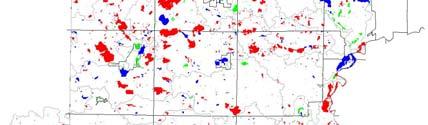
42 Buffer Map for All Basins Map shows basin rating for 3342 wetland basins. Lakes (black) will have a separate buffer requirement. Buffer Map for Basins Greater than One Acre Map shows basin rating for basins greater than one acre. Lakes (black) will have a separate buffer requirement
43 Buffer Recommendations Buffer Width Exceptional High Moderate Low Standards Average Buffer Width (ft) Minimum Buffer Width (ft) Building Setback from Outer Edge of Buffer (ft) Stormwater Ponds Explanations to Buffer Recommendations Exceptional Wetlands automatically get an exceptional rating if there is a noteworthy natural and/or cultural feature. Features include rare, endangered, threatened species, significant natural community, historical state preservation list, identified in county plan(s) as unique/significant. High Wetlands assigned the high rating in the wetland functional value assessment, lakes, and streams. Moderate Wetlands assigned the moderate rating in the wetland functional value assessment. Low Wetlands assigned the low rating in the wetland functional value assessment. Stormwater Ponds Jurisdictional wetlands designed strictly for treating and retaining stormwater runoff


44 Concepts Considered in Developing the Restoration Function Evaluate the non-existing NWI wetlands that have been drained or filled due to urban or agriculture landuses. Use the 1997 landuse classifications to determine the non-existing wetlands. Analyze the functional values of these wetlands as if they existed using the stormwater, natural resource, and water quality functions determined for existing wetlands. Prepare a final functional value using the buffer matrix table evaluation for existing wetlands. This provides a reasonable number of wetlands for restoration. Keep in mind that any restoration is good because of the overall loss of wetlands in the county. Stormwater Restoration 85 86


45 This evaluation only views the wetland s importance within the landscape, not the past wetland type. Data was not available to evaluate the wetland indicators. However, for restoration purposes the wetland type can be altered. Natural Resource Restoration Water Quality Restoration High Priority There are a There are a great deal of wetlands here to consider raising management options that need further discussion


46 Restoration Matrix The matrix used to evaluate an overall Basin Stormwater/ Natural functional value Rating Water Quality Resource for existing H H H wetlands was used for the noniti H H M wetlands. existing H M H M M M M L M M L H M H L L M L L L L Restoration Map for All Basins Map shows a restoration basin rating for 5781 non-existing wetland basins


47 Restoration Map for Basins Greater than One Acre Map shows a restoration basin rating for 1729 non-existing wetland basins. Questions for Wetland Management How does the County want to use the buffers as recommended in the draft Water Plan? How does the restoration piece fit into a wetland management plan as part of the capital improvement program? How do we incorporate a wetland management plan into future stormwater modeling and the water plan? How will all of this best be useful to staff implementing these programs on a day to day basis? 91 92