Effects of Acid Rain on Sensitive Forest and Freshwater Ecosystems: Is the Problem Solved? By Charles Driscoll Syracuse University
|
|
|
- Marilyn Burke
- 5 years ago
- Views:
Transcription
1 Effects of Acid Rain on Sensitive Forest and Freshwater Ecosystems: Is the Problem Solved? By Charles Driscoll Syracuse University

2 Acid rain sources and background Effects of acidic deposition on forest ecosystems Effects of acidic deposition on aquatic ecosystems Recovery? Final thoughts
3
4
5


6 Sulfate Deposition 1994 vs Sulfate ion wet deposition 2010 Sulfate ion wet deposition
7 Nitrate Deposition 1994 vs Nitrate wet deposition 2010 Nitrate wet deposition

8 Ammonium Deposition 1994 vs Ammonium wet deposition 2010 Ammonium wet deposition
9
10


11

12 12
13 Precipitation at Huntington Forest, NY 75 SO 4 ( eq/l) NO 3 ( eq/l) NH 4 ( eq/l) ANC calc ( eq/l) Date
14 Concentration (µmo/l) A. Sulfate and SO 2 R 2 = B. Nitrate and NO x Concentration (µmo/l) R 2 = Airshed Emissions (Tg/yr)
15 Acid Neutralizing Capacity (ANC) Ability of a water to neutralize strong acid Titration by strong acid (ANC G ) ANC = base cations strong acid anions ANC calc = C B - C A Concern Acute Severe Elevated Moderate Low ANC (μeq/l) < >100 Effects Chronic Chronic and episodic Episodic Moderate episodic Limited
16


17 SO 4 2- DOC NO 3 - Al Acid Deposition SO 4 2- NO 3 - H + SO 2- ANC 4, NO 3-, DOC, H + Ca 2+ H + SO SO SO 2-4, NO 2-4,,, NO 3-, 3-3- Al, 3-,,, DOC, DOC, H +, H Ca, + H + ANC Al ANC SO 2- DOC SO 4, 2- NO 4 3-, DOC, NOH - +, ANC, 3 Al Ca 2+, Al

18 Sensitive lake types include perched seepage lakes and thin till drainage lakes Medium till drainage lakes show episodic acidification

")

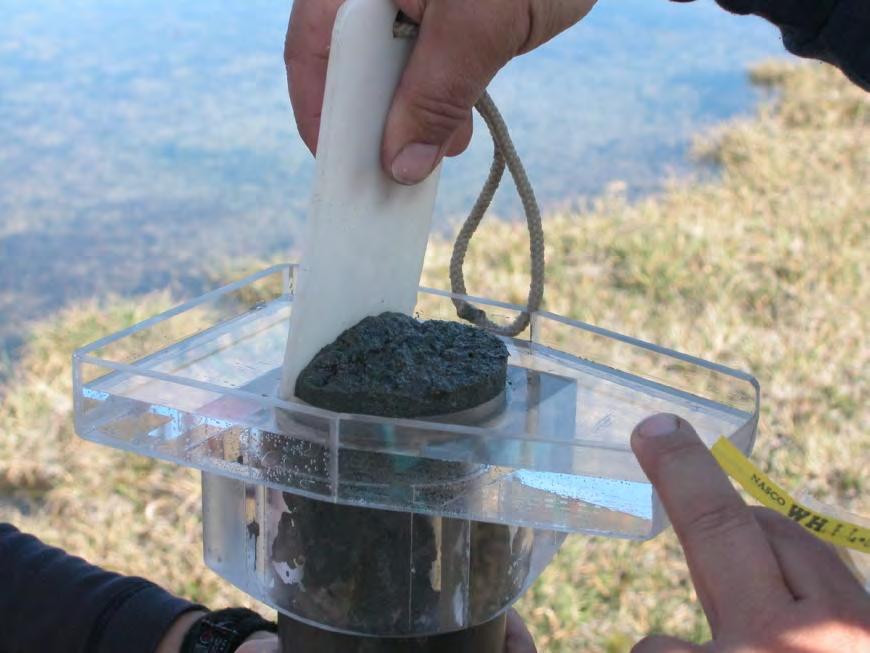
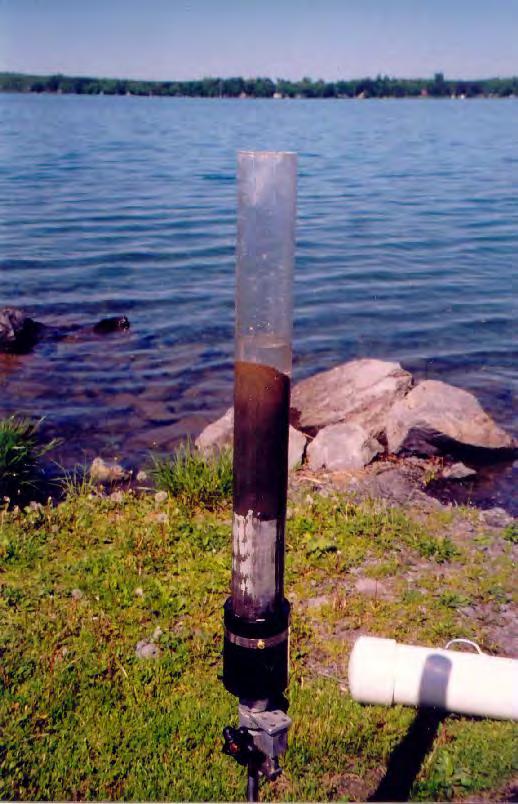
19 Biogeochemical Studies Experimental Manipulations Gradient (spatial) studies Isotopes Modeling Paleoecology Time-series observations
20 Ecosystem Effects
21
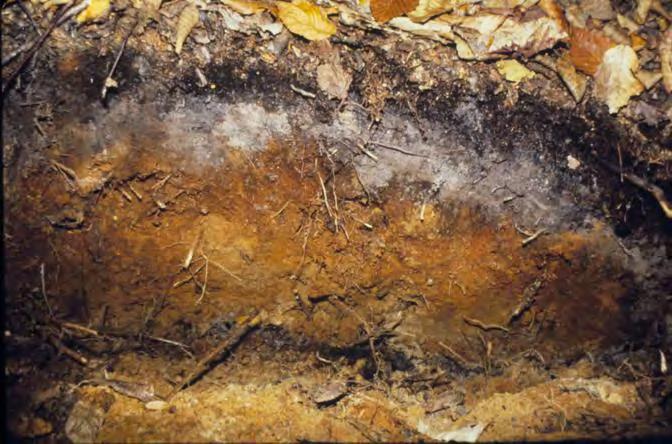
22 Soil Acid Rain Effects Soil sulfur and nitrogen enrichment Nutrient cation (calcium, magnesium) depletion Aluminum leaching
23 Cumulative Frequency Diagram for Ca (cmol c /Kg) Ca Normalized to C (Oa Horizon) Cumulative Frequency Diagram for Exch. Al (cmol c /Kg) Exch. Al Normalized to C (Oa Horizon) % Less than thab Ca Ca % Less than Exch. Acidity Ca (cmolc/kg) Exchangeable Aluminum (cmolc/kg)
24
25

26 Hawley et al., UVM
27 Ring-Width Increment (mm) Adirondack Sugar Maple Growth Trends Pre 1850 (n = 6) (n = 18) (n = 9)
28 Thomas, RQ, CD Canham, KC Weathers, and CL Goodale Nitrogen deposition increases carbon storage in temperate forest trees, but responses vary by species. Nature Geoscience.
29 Aquatic Effects
30 c
31
 Surface area (ha) (%)")

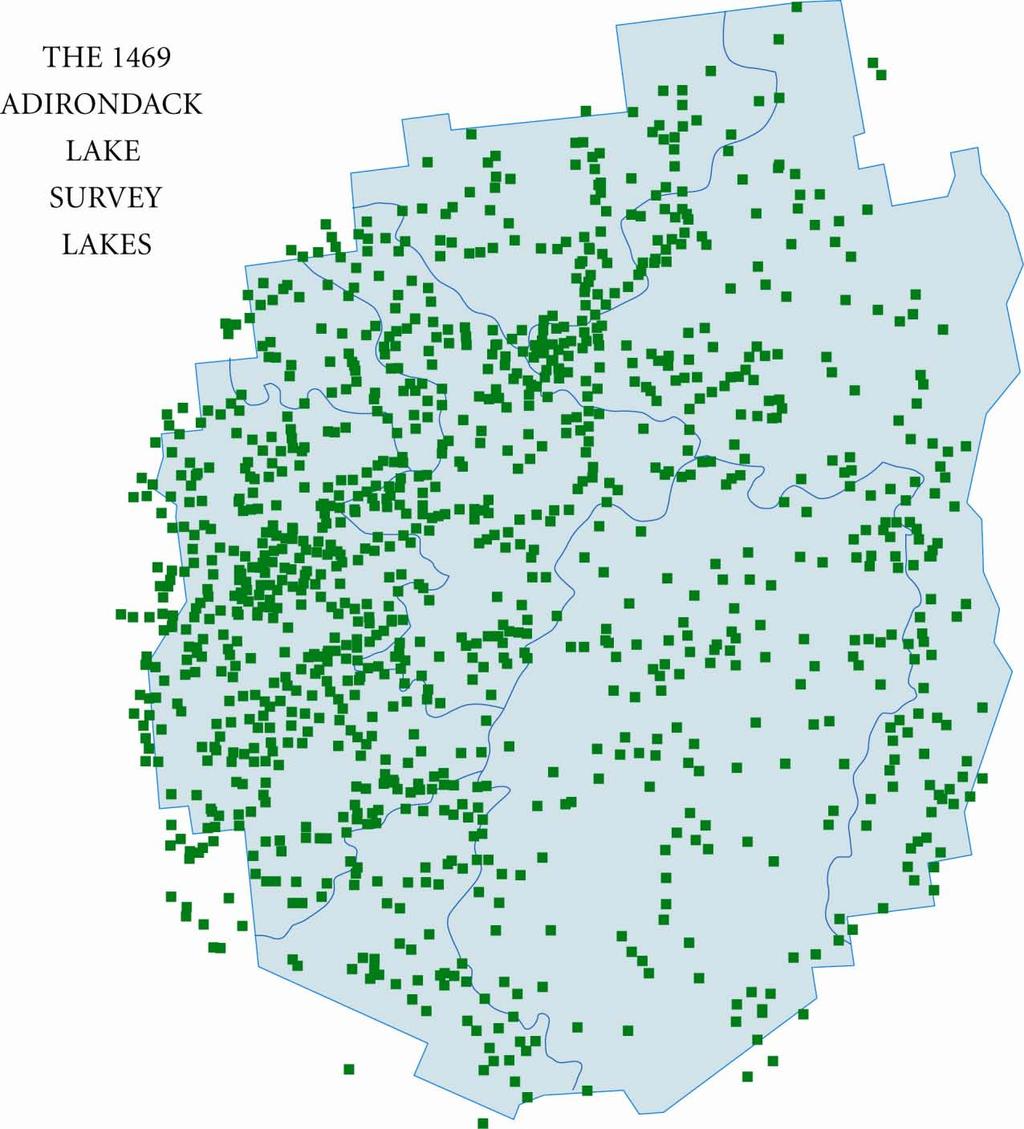
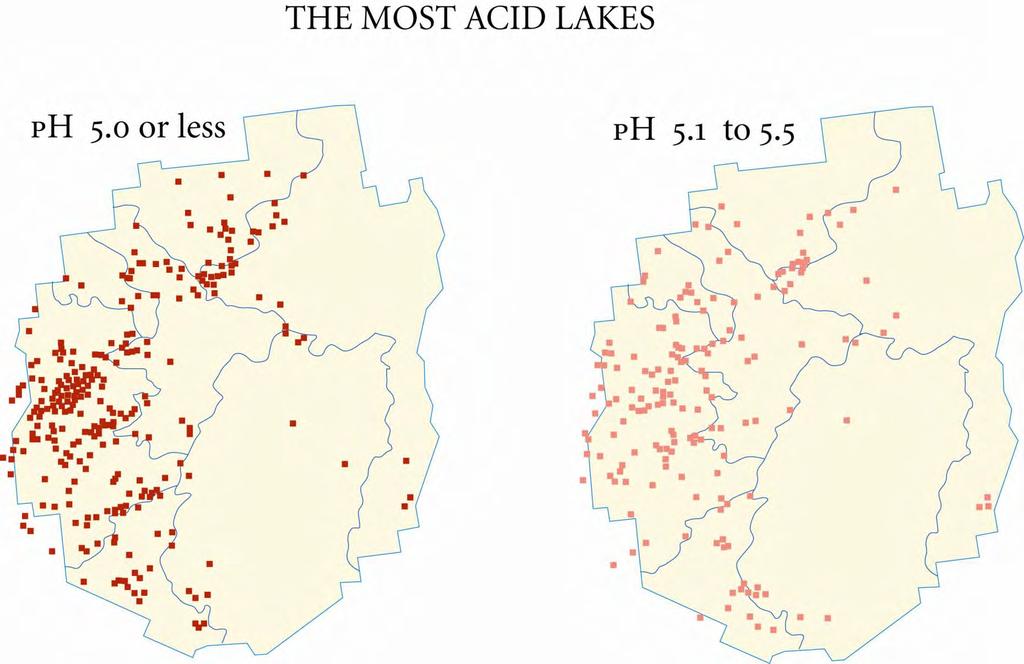
32 Summary (n=1469) No. of Lakes (%) Surface area (ha) (%) ph < , ANC < 0 µeq/l , ANC 0-50 µeq/l ,212 21
33


34 PnET Water balance Photosynthesis Living biomass Litterfall Wet Deposition Dry Deposition Climatic data Solar radiation Precipitation Temperature Net Mineralization Uptake BGC Aqueous reactions Surface reactions Cation exchange Adsorption Humic binding Aluminum dissolution/precipitation Weathering Deep water flow BGC Surface water Aqueous reactions
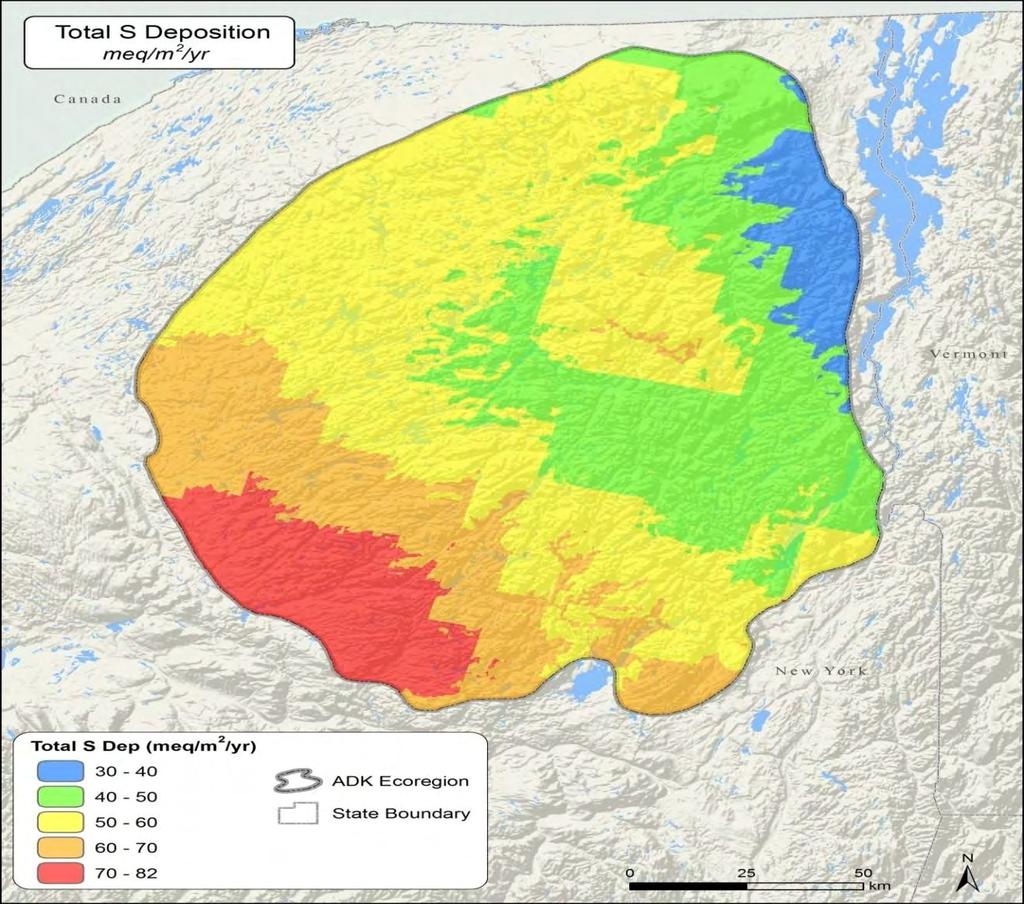
35 g S/m 2 -yr Total Sulfate Deposition Base Case Moderate Controls Aggressive Controls Total Nitrate Deposition g N/m 2 -yr Year
36 Indian Lake ueq/l SO 4 2- Base Case Moderate Aggressive Measured Ca 2+ + Mg 2+ ueq/l ANC ueq/l year vs ca+mg base year vs Ca+Mg observed year vs Ca+Mg mod year vs Ca+Mg agg 7 ph ph units Year
 Current conditions (1990) SO 2-4 15.9 88.8 NO - 3 3.8 20.0 ANC 67.7 27.8 ph 6.63 5.95 Soil %BS 12.")
37 Model simulated median concentrations for lake chemistry and soil % BS at the 44 EMAP sites for pre-industrial time and current measured values, expressed as ueq/l, except ph and %BS. Pre-industrial conditions (1850) Current conditions (1990) SO NO ANC ph Soil %BS

38
39 P2 P1


40 East Bear Brook Reference West Bear Brook Treated

41 West Bear Treatments Initiated Nov, eq ha -1 yr -1 (NH 4 ) 2 SO 4 = 25.2 and 28.8 kg ha -1 yr -1 N and S Added in 6 bi-mo. applications
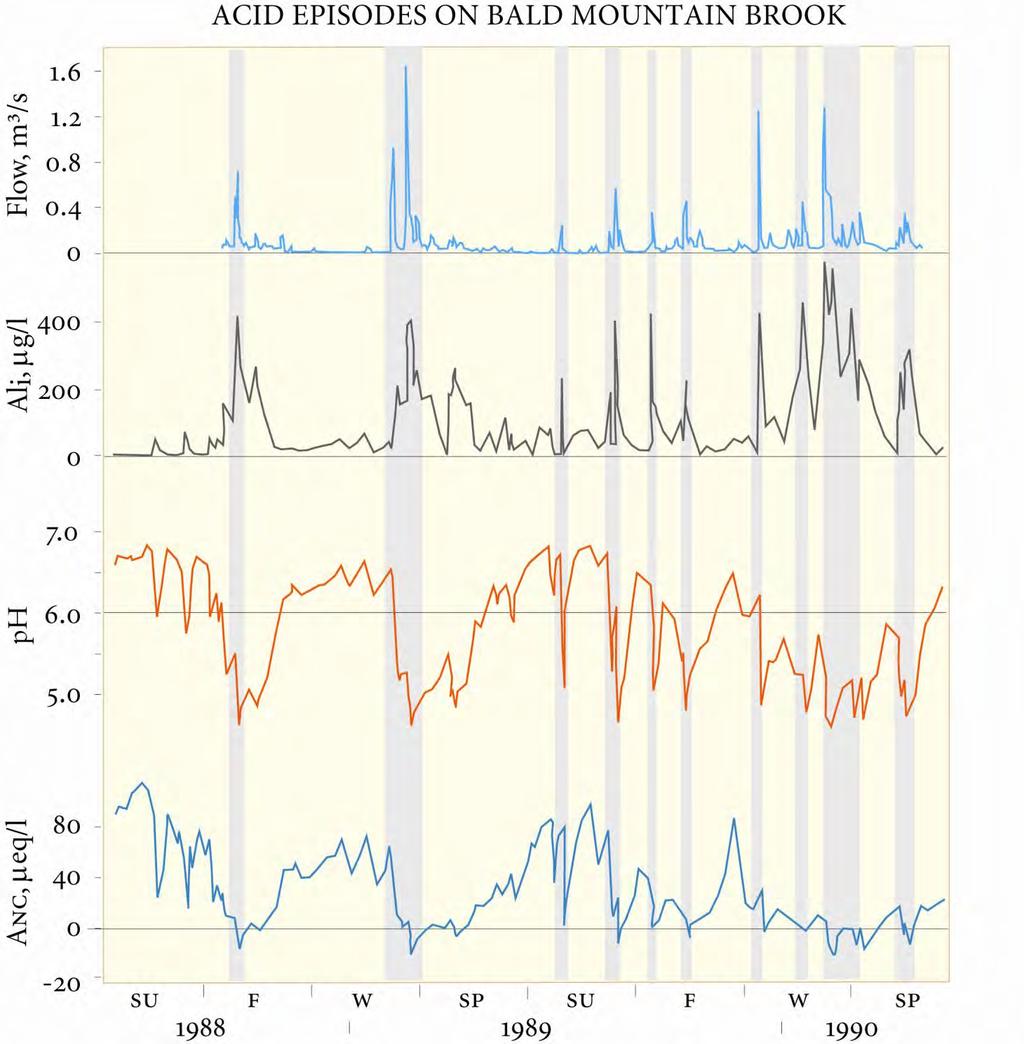
42 Time Series for BBWM NO 3 Export NO3 (eq ha -1 yr -1 ) Calibration Treatments Begin Adapted from Fernandez et al. (2010) East Bear Stream West Bear Stream
43 Mg ( eq L -1 ) Ca ( eq L -1 ) East Bear (Reference) West Bear ( ) 2009 West Bear ( ) Updated from Fernandez et al. (2003)

44
45 Effects on Aquatic Biota Single organisms (condition factor, physiological effects) Population effects (increased mortality, eggs and fry most sensitive) Community effects (decreases in species richness)
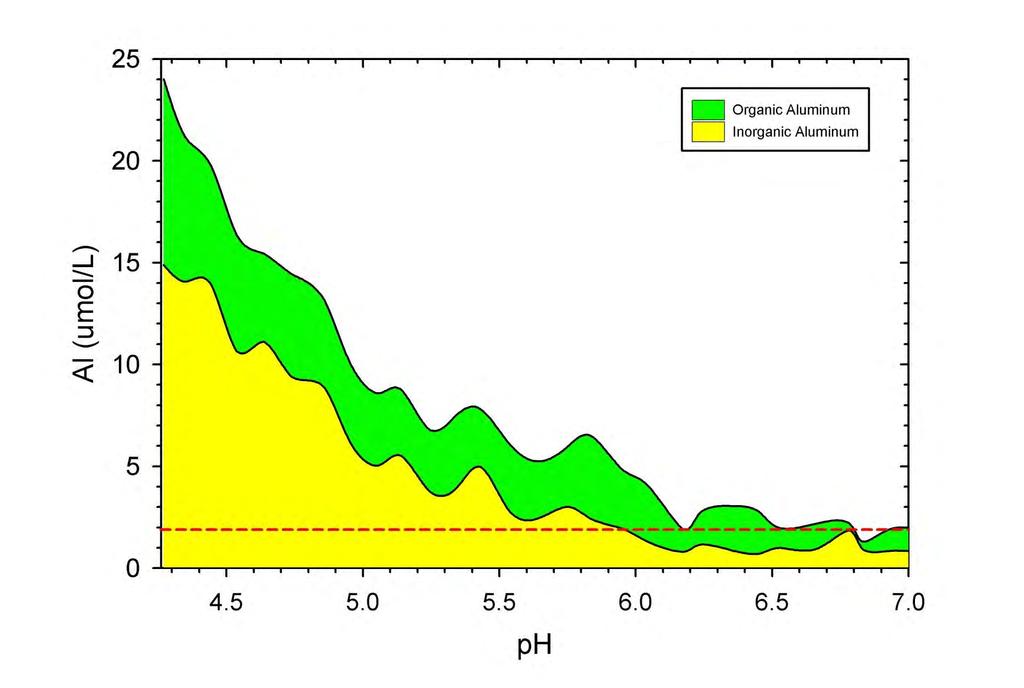
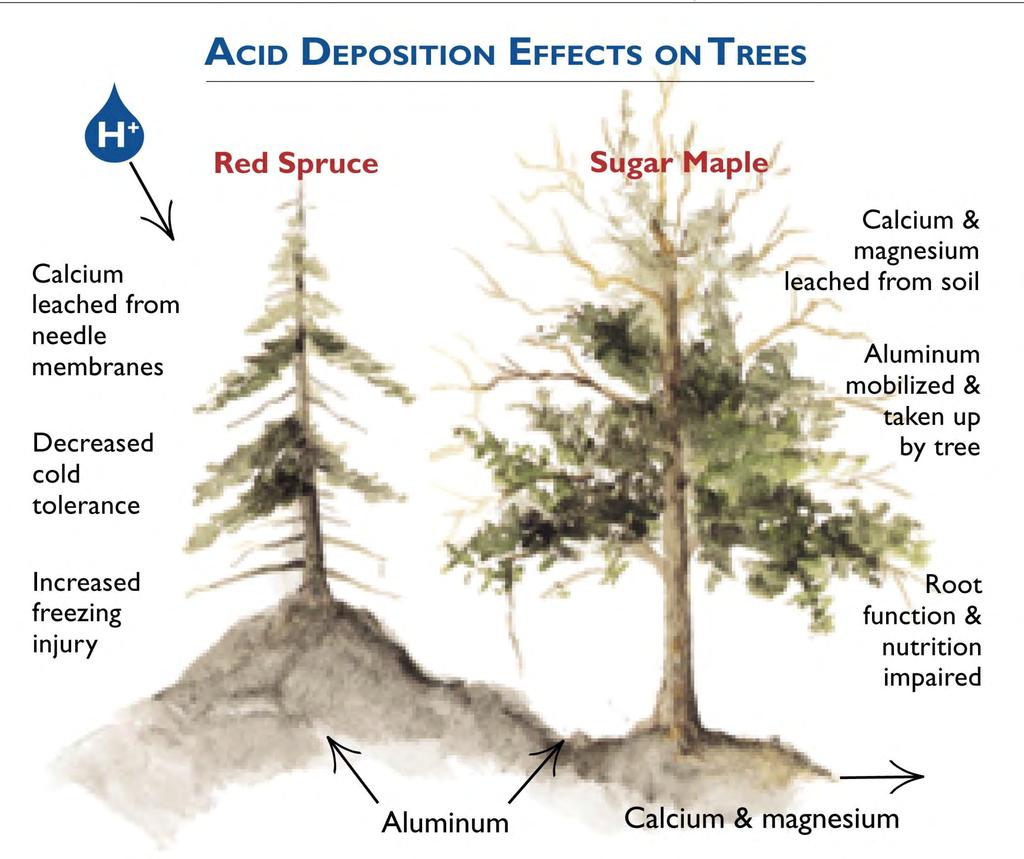
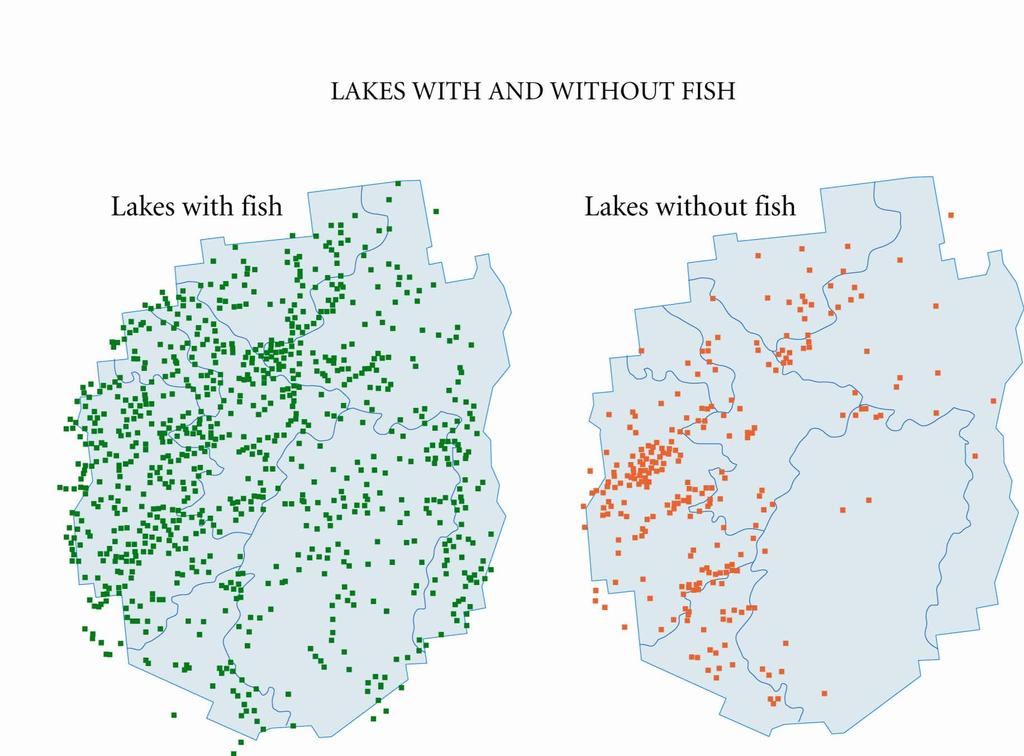
46 Ecological Consequences are Clearest for Fish Acid kills fish directly: low ph poisons fish. Acid kills fish indirectly: low ph releases aluminum from soils to lakes and streams; aluminum poisons fish. Acid/Aluminum eliminate the most sensitive species first, lowering biodiversity. Very acid lakes are fishless.
47 Elevated Severe Moderate Number Fish Species Acute Low ANC(ueq/L)
48
49
50
51
52 200 Big Moose Lake SO 4 2- ( eq/l) NO 3 - ( eq/l) ANC ( eq/l) ph 5 4 Aluminum ( mol/l) 20 Ali Alo DOC ( mol C/L) Time
53 SO 4 2- Min - Mean - Max # sig Increase 0 # sig Decrease 48 NO SO NO C B 1 40 ANC calc 41 0 ANC 39 0 Ali Change ( eq/l)
54 Min - Mean - Max DOC Change ( mol/l-yr) 27 Increasing 6 Decreasing
55 20 DOC ( mol/l-yr) Y= -1.9X r 2 = 0.17 Carbonate and Thick Till Medium Till Thin Till Seepage C A ( eq/l-yr)
56 Why care about increases in DOC Increased light attenuation and thermal stratification (Effler et al. 1985) Increased trace metal (Hg) and nutrient transport (Dittman et al. 2010) Important energy source for Adirondack aquatic food chains? (Adams et al. 2009) Increases in supply of organic acids
57 ANC G ( eq/l-yr) ANC calc ( eq/l-yr) 1:1 line Y = 0.43X r ² 0.54 Carbonate and Thick Till Medium Till Thin Till Seepage
58 ANC calc - ANC G ( eq/l-yr) Carbonate and Thick Till Medium Till Thin Till Seepage DOC ( mol/l-yr) Y= 0.07X r ² 0.44
59 Fish Population Changes (n=42) Period of Study All lakes Median* Mean* Maximum* Change < 1 +2 *per lake
60 14 Number Fish Species ANC (ueq/l)
61 Acidification Recovery Deposition Forests Lakes Soil Sugar Maple Sulfate Nitrate Acidity Calcium Red Spruce Sulfate Nitrate ANC DOC Fish??? Strongly Recovering Moderately Recovering Uncertain Deteriorating
62 Policy or Proposal NO x (million short tons) SO 2 (million short tons) Deadline for Implementation 4 Pollutant? 1990 Clean Air Act (Title IV) No NOx Budget Trading Program 60% summer reduction from 2000 levels N/A 2003 No Total US: 2.5 by by 2015 Total US: 4.16 by by 2015 Clean Air Interstate Rule (CAIR) Affected region: 1.6 by 2010 Affected region: 3.9 by and 2015 No 1.3 by by % reduction in NO x from 2003 levels 70% reduction in SO 2 from 2003 levels
63 Indian Lake ueq/l SO 4 2- Base Case Moderate Aggressive Measured Ca 2+ + Mg 2+ ueq/l ANC ueq/l year vs ca+mg base year vs Ca+Mg observed year vs Ca+Mg mod year vs Ca+Mg agg 7 ph ph units Year
64 Key Messages Air quality management in the U.S. has shifted from a local scale, command and control to a national, market-based approach Control programs have resulted in decreases in SO 2 and NO x emissions largely from electric utilities. Acid-sensitive forest and aquatic ecosystems have been impacted by acidic deposition. Emission controls have decreased surface water acidification, while soil acidification continues Future ecosystem recovery from acidic deposition will be slow; critical loads may help to guide air quality management. A diverse approach has facilitated a quantitative understanding of the effects of acidic deposition on ecosystems.

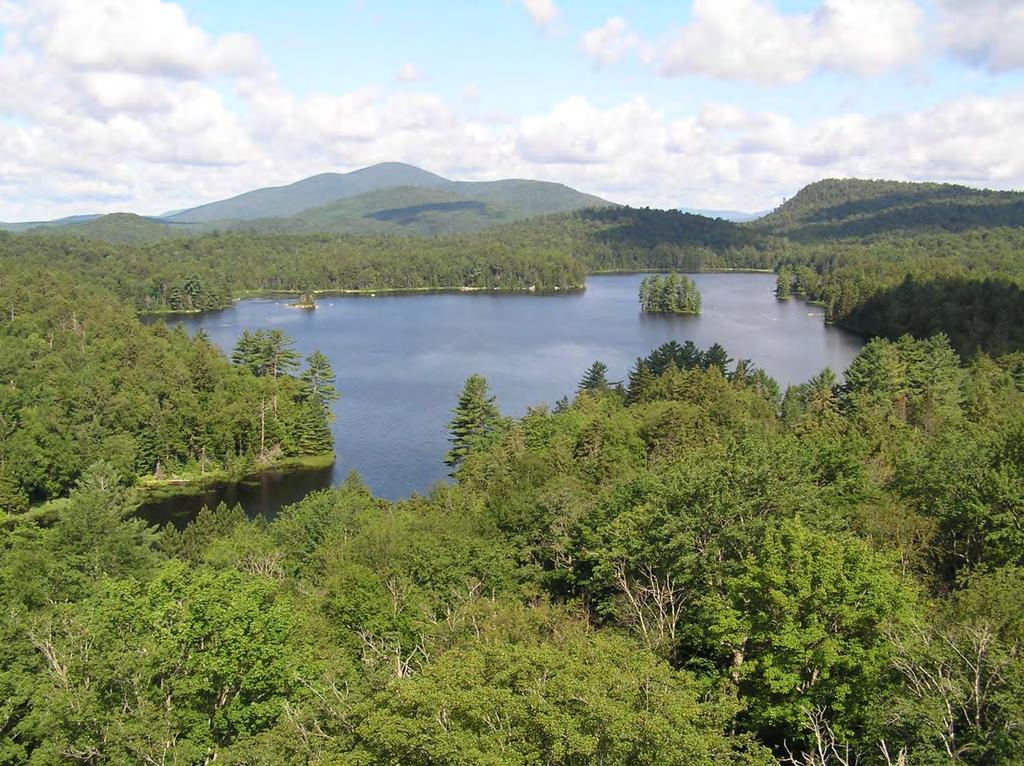
65 Carl Heilman
 Species Richness 1984-87 1994-2005 No fish 9 4.7 4.")

66 Changes in Fish in Adirondack Lakes (n=42) Category n Median ph Volume (10 4 m 3 ) Species Richness No fish No change Only gained Only lost Gained and lost