Predicting elevated groundwater nitrate concentrations using a decision tree-based geospatial model in the Silver Springshed, FL
|
|
|
- Veronica Turner
- 5 years ago
- Views:
Transcription

1 Predicting elevated groundwater nitrate concentrations using a decision tree-based geospatial model in the Silver Springshed, FL Dean R. Dobberfuhl Andy Canion Lori McCloud
2 Springs Research Questions Which areas of the spring shed of Silver Springs contribute the highest N loads to the springs? Will [NO x ] reduction be sufficient to restore primary producer community structure? What are the major drivers of primary producer community structure and what is the relative influence and controllability of each? 2
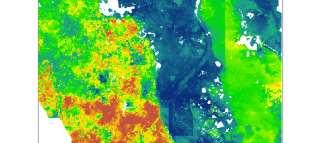
3 Wouldn t it be great if we could predict groundwater [NOx] from land use? Legend Silver Springs Springshed 2009 Land Use <all other values> Agriculture (excl. Pasture) Barren Land Forest NA Pasture Trans/Utilities Urban and Residential Water Wetlands
4 Mean Groundwater NO x (mg liter -1 ) NO x Concentration by Land Use Agriculture Barren Land Forest Industrial Upland Urban Water Wetland


5 Intrinsic Groundwater Vulnerability Florida Aquifer Vulnerability Assessment (FAVA) Marion County Aquifer Vulnerability Assessment (MCAVA)


6 Specific Groundwater Vulnerability Depth to Upper Floridan Limestone High : Recharge to UFA High : 30 Low : Low : -10
7 Mean_NOX Below 1.2 mg/l Above 1.2 mg/l Summary of Training Data Upper Floridan Wells only Known depth Depth less than 500 feet Dataset # Wells Date Range FDEP Public Water System (PWS) FDEP Water Supply Restoration (WSRP) SJRWMD SWFWMD USGS Total 729
8 Model Construction Input variables Geology, septic, land use, GW [NOx] Recursive Partitioning Random Forest Ensemble Model
9 Model Diagnostics Variable Importance Confusion Matrix at 0.5 cutoff Pred. Below Below Exceed Pred. Exceed True Positive Rate: 58.4% False Positive Rate: 16.1% OOB estimate of error rate: 25.24%


10 Probability of Exceeding 1.2 mg/l NO x F F Random Forest Classification High : 1 Random Forest + Residual Kriging High : 1 Low : 0 Low : 0
11 What knowledge have we added to the world? Recursive partitioning is a promising tool to assess specific aquifer vulnerability in Silver Springs Geology is strongly influential in explaining nitrate contamination Imputed nutrient loads were not the strongest predictor of nitrate concentration Land use patterns were minimally predictive of nitrate concentration


12 Questions?
13 Reserve Slides
14 Random Forest Classification Overview Machine Learning Technique Extension of Classification and Regression Trees (CART) Steps: 1. Draw a bootstrapped sample from training data 2. Grow a classification tree with bootstrapped data at each node split, try a random subset of predictor variables of size m to decide the best splitting variable 3. Repeat Steps 1-2 to produce a large number of trees (the forest) 4. Classify a given sample using the majority vote of the trees * Note that each bootstrapped tree only uses a subset of the training data. The data not used is the out of bag data and can be used to estimate model error. This process is similar to cross validation.
15 Kriging of Random Forest Residuals Probability of Exceeding 1.2 mg/l Random Forest Prediction m(s) Z(s) = m(s) + ε'(s) + ε'' Source: Wikipedia

16 Random Forest Process Ensemble Result Guo et al. 2011
17 Bias Vs Variance Trade-Off


 UFA Recharge (in/yr)")
 Water Table")

18 Depth to UFA (Ft) FAS Depth High : ICU Thickness (Ft) ICU Thickness High : ICU to OB ratio ICU to OB ratio High : Low : Low : 0 Low : 0 Water Table Depth (Ft) UFA Recharge (in/yr) Soil Saturated Hydraulic Conductivity (Ksat) Water Table Depth High : Low : 0 UFA Recharge High : 30 Low : -10 Avg. Ksat <VALUE>


 Pasture Crops Low : 0 Trans/ Utilities Forest Wetlands Water Barren")
19 Ecoregions ECONAME Sinkhole Frequency Soil Drainage Class Ridges/ Uplands sink_freq DRCLASSDCD 1-11 Flatwoods Excessively drained Flatwoods Somewhat excessively drained Well drained Moderately well drained Somewhat poorly drained Poorly drained Very poorly drained Septic Tank Density Land Surface N Load (Kg/Ha) Dominant Land Use (25 ha) Septic Density High : 749 Urban/ Resid. N Load (Kg/Ha) Pasture Crops Low : 0 Trans/ Utilities Forest Wetlands Water Barren High : 879 Low : 3