Water Quality in the Upper Cohansey Watershed
|
|
|
- Junior Carr
- 5 years ago
- Views:
Transcription
1 Slide 1 Water Quality in the Upper Cohansey Watershed Salvatore Mangiafico County Environmental and Resource Management Agent Cooperative Extension of Salem and Cumberland Counties This talk will present water quality data from the Upper Cohansey River Watershed.
2 Slide 2 Upper Cohansey Data Report and Restoration Plan: Data Report and Draft Plan available online: Link for the Rutgers Upper Cohansey Restoration Plan: Restoration_Plan_ _V2.pdf Link for the Data Report, which has a little more detail on the collected data: ey_river_watershed_data_report_ pdf The data in this presentation comes chiefly from the Upper Cohansey Restoration plan (a). More detail of some data types is available in the Data Report (b). Both are available as PDF files online from the Rutgers Cooperative Extension Water Resources Program.. a) 011_V2.pdf. b) ata_report_ pdf

3 Slide 3 Upper Pittsgrove Alloway Pittsgrove Salvatore Mangiafico County Environmental and Resource Management Agent Cooperative Extension of Salem and Cumberland Counties In color on this map is the study area, the Upper Cohansey River Watershed. It is north of Bridgeton, and includes Seeley Lake and north.
4 Slide 4 History: Watershed listed as impaired for phosphorus, lead, ph, aquatic life 2005 TMDL proposed for fecal coliform bacteria aware%20fc.pdf 2006 Rutgers Water Resources Program begins data collection 2009 Data Report Released 2010 Draft Restoration Plan completed 2011 Restoration Plan finalized For a brief history of efforts to quantify water quality in the Upper Cohansey River: Sometime between 2003 and 2005, the upper reach of the river was listed as impaired by state of New Jersey for phosphorus, lead, ph, and aquatic life use. In addition, in 2005 the state proposed a Total Maximum Daily Load for fecal coliform bacteria---an indicator of fecal contamination---for the river. A Total Maximum Daily Load, or TMDL, is a calculation of how much of certain pollutants the river could receive and still meet its designated uses, and thereby determine the reduction of pollutant loads necessary. The TMDL is then approved by the federal EPA. In 2006 Rutgers Cooperative Extension Water Resources Program received funding from the state to begin a more-intensive investigation of water quality and sources of pollutants for the upper watershed. The Data Report from this study was released in 2009, and by 2011 the Restoration Plan was completed.. df

5 Slide 5 - Upper Cohansey River to Seeley Lake, north of Bridgeton - 31 square miles - 32 miles of river and streams Stow Creek This is a map of the upper watershed, outlined in blue. The municipalities in this watershed are Upper Deerfield, Hopewell, Alloway, a small part of Upper Pittsgrove, and a small part of Stow Creek.. The watershed includes Seeley Lake and north. The watershed is 31 square miles and includes 32 miles of river and streams.


6 Slide 6 This is a map of land use in the watershed. Much of the land area, about 73%, is devoted to agricultural production, shown in yellow. Developed areas are shown in pink. Forests are shown in green. Note that there is forest cover along some parts of the river and its tributaries.
 One type of assessment that was performed was a visual stream assessment.")


7 Slide 7 Stream assessment and water quality: 1) Visual Stream Assessment (SVAP) - overall good - range poor to good - no manure or livestock - good canopy cover - some spots with poor water appearance or bank stability - (data are in plan) One type of assessment that was performed was a visual stream assessment. For this assessment, people go into, or near, the stream channel and perform a visual assessment according to a specific protocol. Overall, the streams in the water were rated good, but individual segments ranged from poor to good. There were no issues with evidence of problems from livestock having access to streams or livestock manure. Most places had good canopy cover, but there were some segments which suffered from poor water appearance or poor bank stability. These data can be found in more detail in the Restoration Plan. Note in the left photo the stream bank erosion that is undermining that tree. The top photo shows a leaning tree that may have been undermined by erosion, and the bottom photo shows water that is sediment-laden and murky.
8 Slide 8 Stream assessment and water quality: 2) Invertebrate (biological assessment), (EPT), (may-, stone-, caddis- fly) - habitat, physical, chemical - result: moderately impaired - habitat: suboptimal / good - (data are in plan) A second type of assessment was a biological assessment, specifically looking at certain insects. In general, the presence of mayflies, stoneflies, and caddisflies indicate that the water is of good quality and there is appropriate habitat for these insects. The set of these three types of insects are abbreviated EPT*, after the scientific names of their classification orders. The overall assessment for the river was moderately impaired, but individual segments ranged from suboptimal to good. These data can be found in more detail in the Restoration Plan.. * Ephemeroptera, Plecoptera and Trichoptera.
9 Slide 9 Stream assessment and water quality: 3) Chemical parameters - TP (total phosphorus) goal is 0.05 ppm (for lake) - Fecal coliform bacteria goal is geometric mean of 100 CFU / 100ml, etc. - TSS (total suspended solids) goal is 40 mg/l - Some N (nitrogen) concern but below objective FW2-NT stream desired uses: recreation, irrigation, aquatic life, potable after treatment A third type of assessment was for chemical pollutants and fecal matter contamination. In this type of assessment, water was regularly sampled and brought to a laboratory for analysis. The benchmark concentration used for total phosphorus was 0.05 parts per million (ppm), which is the state s benchmark concentration for lakes designated FW2. While rivers are allowed a concentration twice that, a single benchmark was used since there are lakes along the river in this watershed. Note that this concentration is less than one tenth of one part of phosphorus per million parts of water, or 50 parts per billion. A benchmark of 100 colony forming units (CFU) per 100 ml of water was used for fecal coliform bacteria, which is an indicator of fecal matter contamination in water. This benchmark mirrors the state standard for this type of river, though the state standard is a little more complex. Total suspended solids---which is the amount of sediment in the water--- and nitrogen were also investigated.
10 Slide 10 out of about 24 samples per station This is a table of how often water samples exceeded benchmark concentrations. By exceeded we mean that the sample had a higher concentration of a pollutant than is allowed by the benchmark. The first column shows the sampling stations. Essentially, C1 is at the bottom of the watershed and the numbers count up C2, C3, etc., working up the watershed. The numbers in the table are the number of exceedances of that pollutant at that station, out of about 24 samples per station. For ph there were few exceedances. For TP---total phosphorus--- there were commonly at least 8 or 9 exceedances, or about a third of the samples. For TSS---total suspended solids--- there were few exceedances at all stations. For fecal coliform bacteria there were commonly 5 or more exceedances per station, so about 20% of samples, though some stations had exceedances more than 30% of the time.

11 Slide 11 This is a plot of the total phosphorus concentrations in the water samples. The stations are along the x-axis, with C1---the downstream station--- on the left. The horizontal black line shows the benchmark concentration. The height of the blue bars is the average concentration for that station. Note that on average, phosphorus concentrations at every station exceeded the benchmark concentration, with an overall average of about 0.12 parts per million (ppm or mg/l). This concentration isn t very high, but is high enough to cause eutrophication, plant blooms, and low oxygen in some freshwater rivers and lakes. The horizontal black bars---error bars--- are a measure of the variability of the data for each station. The fact these bars also overlap the range of one another indicates that there is probably no real statistical difference in mean concentrations among the stations.
12 Slide 12 This is a plot of fecal coliform bacteria concentration, set up in the same manner as the previous plot. Some stations on average met benchmark concentrations, while others on average did not. Also note that the error bars for some stations are _very_ large, indicating that the concentrations for many stations was _very_ variable. On one sampling occasion the concentration might be quite low, but on another sampling occasion, the concentration might be quite high.

13 Slide 13 MST qpcr majority still unidentified --- wildlife? These two plots show the percent of fecal bacteria in water samples that were from human sources or bovine sources. This technique in general is called microbial source tracking, or MST. The specific technique that was used here is called quantitative polymerase chain reaction, or qpcr. The certain genus of bacteria that it looks at has different DNA if it is found in humans rather than birds cows. The technique is able to detect these differences and then determine what percentage of the bacteria is from which animal source. For this study, markers for human sources and bovine sources were used, with the rest of the bacteria being from some other animal source. The figure at the right shows the percentage of these bacteria that were from bovine (cattle) sources for each sub-watershed, with green indicating 0%, yellow 10%, and orange 20%. For most of the watershed, bovine sources of fecal bacteria were 10% or less. The figure at the left shows the percentage of these bacteria that were from human sources for each sub-watershed, with pink indicating 30% and red indicating 40%. For some subwatersheds 30 or 40% of the fecal bacteria were from human sources, indicating that humans were a major contributor in some areas. It should be noted that for all sub-watersheds the source for 50% or more of the fecal bacteria were not identified, suggesting that the majority of contamination was from some other source, perhaps wildlife.
14 Slide 14 Sources of these pollutants: Phosphorus: - Agricultural fertilizer - Home fertilizer - Wildlife - Domestic animals - Livestock - Failing septic systems - Various organic debris - Soil erosion - Lake sediments The two pollutants found to be impacting water quality the most in this study--- phosphorus and fecal matter--- come from a wide range of sources. Phosphorus is found in all living things and so is nearly ubiquitous in the environment, though in small concentrations. Sources of phosphorus that could be impacting the river include fertilizers for farms, lawns, or gardens; feces from wildlife, pets, or livestock; effluent from failed septic systems; and organic debris like yard clippings. Soil erosion is important source of phosphorus since phosphorus often chemically adheres to soil particles. If eroded soil particles that are carried with stormwater to lakes and rivers can release their held phosphorus there. Lake sediments, too, hold phosphorus, and can release it over time to the overlying water.
15 Slide 15 Sources of these pollutants: Fecal coliform: - Failed septic systems - Sanitary sewer overflows during heavy precipitation events - Wildlife - Domestic animals - Livestock Fecal contamination is a concern because it can carry disease-causing pathogens of various types, such as bacteria, viruses, and protozoans (like Cryptosporidium). Any animal waste carries the bacteria that are used to indicate fecal contamination (fecal coliform bacteria or E. coli). Common sources of fecal contamination are failed septic systems and sanitary sewer overflows during heavy precipitation events; and feces from wildlife, livestock, and pets.


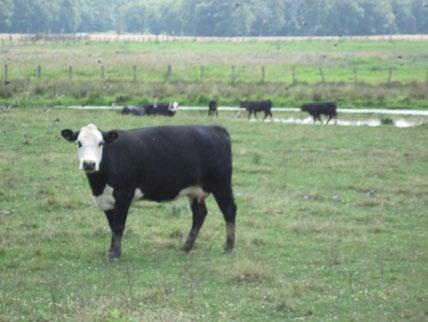

16 Slide 16 Image: Sal Mangiafico, Rutgers Cooperative Extension

17 Slide 17 Salvatore Mangiafico County Environmental and Resource Management Agent Cooperative Extension of Salem County 51 Cheney Rd, Ste. 1 Woodstown, NJ mangiafico@njaes.rutgers.edu