MASTERS COLLEGE MASTER PLAN
|
|
|
- Gilbert Augustine Todd
- 5 years ago
- Views:
Transcription
1 , June 2008
2 MASTERS COLLEGE MASTER PLAN June 2008
3 DRAFT MASTERS COLLEGE MASTER PLAN Prepared by: Austin-Foust Associates, Inc Wellington Avenue, Suite 300 Santa Ana, California (714) June 12, 2008
4 CONTENTS 1.0 INTRODUCTION PROJECT DESCRIPTION STUDY AREA METHODOLOGY PERFORMANCE CRITERIA DEFINITIONS REFERENCES TRANSPORTATION SETTING EXISTING CONDITIONS Existing Roadway System Existing Traffic Volumes and Levels of Service Public Transportation INTERIM YEAR SETTING IMPACT ANALYSIS TRIP GENERATION TRIP DISTRIBUTION LEVEL OF SERVICE ANALYSIS CMP ANALYSIS MITIGATION PROPOSED MITIGATION MEASURES APPENDICES: A: Intersection Capacity Utilization Worksheets B: Traffic Count Data Sheets Placerita Canyon Neighborhood Page Masters College Master Plan i Austin-Foust Associates, Inc rpt.doc
5 LIST OF FIGURES Figure 1-1: Project Site Location Figure 1-2: Site Plan Figure 1-3: Study Area Figure 2-1: Existing Roadway System Figure 2-2: Average Daily Traffic Volumes - Existing Conditions Figure 2-3: AM Peak Hour Turning Movement Volumes - Existing Conditions Figure 2-4: PM Peak Hour Turning Movement Volumes - Existing Conditions Figure 3-1: Project Distribution Figure 3-2: Average Daily Traffic Volumes Interim Year Without Project Figure 3-3: AM Peak Hour Volumes - Without Project, Without Dockweiler Extension Figure 3-4: AM Peak Hour Volumes - Without Project, With Dockweiler Extension Figure 3-5: PM Peak Hour Volumes - Without Project, Without Dockweiler Extension Figure 3-6: PM Peak Hour Volumes - Without Project, With Dockweiler Extension Figure 3-7: Average Daily Traffic Volumes Interim Year With Project Figure 3-8: AM Peak Hour Volumes - With Project, Without Dockweiler Extension Figure 3-9: AM Peak Hour Volumes - With Project, With Dockweiler Extension Figure 3-10: PM Peak Hour Volumes - With Project, Without Dockweiler Extension Figure 3-11: PM Peak Hour Volumes - With Project, With Dockweiler Extension Figure 3-12: Interim Year (Baseline) Intersection Lanes Figure A-1: Intersection Locations Numbers...A-2 Page LIST OF TABLES Table 1-1: Level of Service Descriptions Table 1-2: Arterial Intersection Performance Criteria Table 2-1: ICU and LOS Summary - Existing (2007) Conditions Table 2-2: Land Use and ADT Summary - Cumulative Conditions Table 2-3: Cumulative Projects Table 3-1: Trip Generation and Trip Rate Summary - Proposed Project Table 3-2: Trip Rate Comparison - Masters College Table 3-3: ICU and LOS Summary - Interim Year with and without Project Table 3-4: ICU and LOS Summary CMP Intersection Analysis Table 4-1: Mitigation Summary Table 4-2: ICU and LOS Summary - With Mitigation Page Masters College Master Plan ii Austin-Foust Associates, Inc rpt.doc
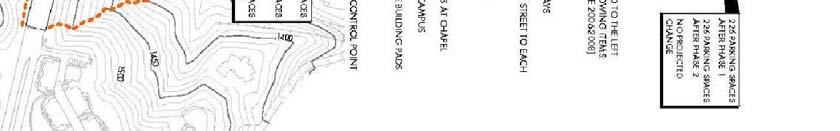
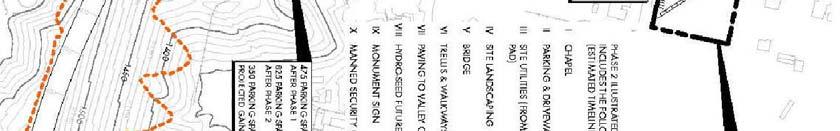
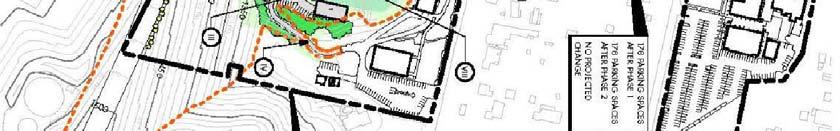
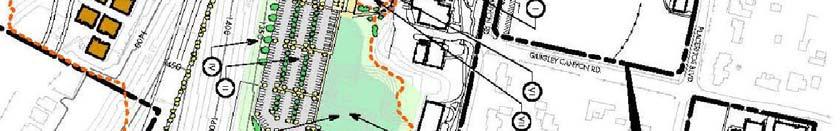
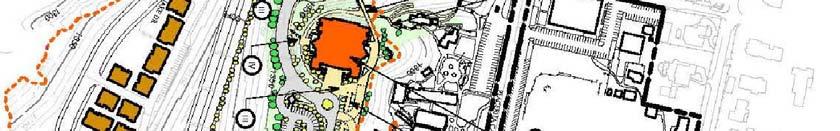
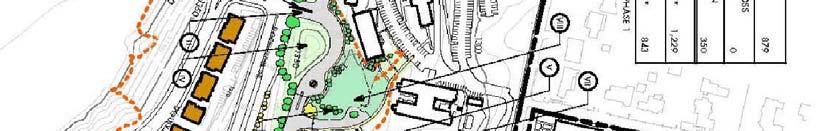
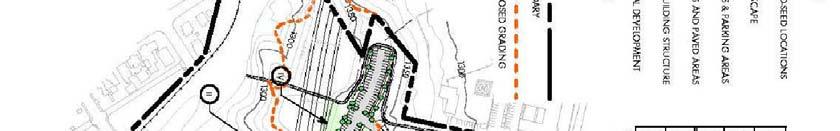
6 1.0 INTRODUCTION This report presents the results of a traffic study carried out to evaluate the proposed Masters College Master Plan. It provides the traffic and circulation material for the Environmental Impact Report (EIR) prepared for this project. 1.1 PROJECT DESCRIPTION The Masters College is located in the rural Placerita Canyon community of the City of Santa Clarita. The college is currently accessible from Placerita Canyon Road via the 13 th Street intersection at Railroad Avenue. Figure 1-1 illustrates the general location of the project site. The proposed Development Plan includes land use, circulation and proposed zoning changes. As stated in the Master Plan, the primary goals of the Development Plan are to: 1) provide for the College s incremental growth, 2) provide a new primary entry and improve overall vehicular and pedestrian circulation and 3) create a cohesive, pedestrian-friendly campus. The proposed Master Plan includes the extension of Dockweiler Drive through the southern part of the project site. Ultimately Dockweiler Drive is planned to be further extended to intersect with Railroad Avenue, however the precise alignment is yet to be determined by the City. The layout of the proposed Campus facilities capitalizes on this new roadway by reorienting the main campus entrance from Placerita Canyon Road to Dockweiler Drive. The proposed Master Plan includes the following key components (see Figure 1-2 for site plan): o o o o o o o o o o A new chapel and conference facility which will be up to 55,000 square feet in size; Two new academic buildings that will contain classrooms and a new library; A student plaza with an outdoor amphitheatre; Expansion of the gymnasium; A new 120 bed student dormitory and pedestrian connection bridge; A new computer sciences building and an expansion of the student center and dining hall; The removal of parking and older buildings along Placerita Canyon Road to allow for the creation of a large green-space and garden area; The creation of a large student/faculty parking area accessed from Dockweiler Drive and directly adjacent to the new chapel and academic buildings; The creation of additional dormitory parking; and The design of two major pedestrian links between the new academic facilities and the existing academic facilities along Placerita Canyon Road. Masters College Master Plan 1-1 Austin-Foust Associates, Inc rpt.doc
7


8
9 According to the Master Plan, current enrollment at The Masters College is 1,105 students (960 full-time/145 part-time), with a faculty of 127 (57 full-time/70 part-time) and a staff of 177 (142 fulltime/35 part-time). The proposed maximum enrollment is 1,700 students (1,500 full-time/200 part-time), with a faculty of 182 (82 full-time/100 part-time) and a staff of 285 (225 full-time/60 part-time). The proposed maximum enrollment results in an increased amount of traffic generation for the site. It results in approximately 1,900 additional daily trips, with approximately 120 additional trips during the am peak hour (88 inbound), and approximately 160 additional trips during the pm peak hour (97 outbound). Section 3.1 provides details regarding the derivation of the project s trip generation statistics. 1.2 STUDY AREA The study area includes the roadways and intersections near to the project site and those locations where project-generated traffic could be reasonably expected to cause a significant impact. The selection of the study area was determined based on the City s standard criteria of 50 or more new trips added to the peak travel direction along with additional study locations based on input from the City s traffic engineering staff. Figure 1-3 illustrates the intersections selected for study based on these criteria. 1.3 METHODOLOGY The traffic analysis evaluates the proposed project for a cumulative setting using the Interim Year version of the Santa Clarita Valley Consolidated Traffic Model (SCVCTM). The SCVCTM was developed jointly by the City of Santa Clarita and the County of Los Angeles and is the primary tool used for forecasting traffic volumes for the Santa Clarita Valley. Consistent with the EIR traffic studies done for other recent projects in the City, this analysis uses the SCVCTM Interim Year horizon as the basis for background traffic conditions. The Interim Year, which generally corresponds to horizon year of around 2018 to 2020, represents a cumulative increase in traffic volumes which are roughly halfway between existing conditions and buildout of the City s General Plan. An update to the SCVCTM was recently undertaken (see Reference 7 in Section 1.6) which included incorporating current land use information for planned and pending cumulative projects. As part Masters College Master Plan 1-4 Austin-Foust Associates, Inc rpt.doc
10
11 of the development of this traffic impact analysis, the SCVCTM land use database was updated based on the City s current listing of cumulative projects (see Section 2.3 for cumulative project information as it relates to the SCVCTM). The impact analysis is based on specific performance criteria which are outlined in the following section. Where appropriate, mitigation measures are identified for those scenarios in which significant impacts are determined based on the established impact thresholds. 1.4 PERFORMANCE CRITERIA For CEQA purposes, defined performance criteria are utilized to determine if a proposed project causes a significant impact. In most traffic studies, performance criteria are based on two primary measures. The first is capacity, which establishes the vehicle carrying ability of a roadway and the second is volume. The volume measure is either a traffic count (in the case of existing volumes) or a forecast for a future point in time. The ratio between the volume and the capacity gives a volume/capacity (V/C) ratio and based on that V/C ratio, a corresponding level of service (LOS) is defined. Traffic LOS is designated A through F with LOS A representing free flow conditions and LOS F representing severe traffic congestion. Traffic flow quality for each LOS is described in Table 1-1. Both the V/C ratio and the LOS are used in determining impact significance. Certain LOS values are deemed unacceptable by the City and increases in the V/C ratio which cause or contribute to the LOS being unacceptable are defined as a significant impact (see following sections for details). In establishing V/C based performance criteria, there are certain items that need to be addressed to obtain suitable V/C estimates and relate them to LOS. For instance, while average daily traffic (ADT) is a useful measure to show general levels of traffic on a facility and to provide data for other related aspects such as noise and air quality, highway congestion is largely a peak hour or peak period occurrence and ADT does not reflect peak period conditions very effectively. Because of this, ADT is not used here as the basis for capacity evaluation but instead this evaluation focuses on those parts of the day when such congestion can occur, specifically the AM and PM peak hours. Masters College Master Plan 1-6 Austin-Foust Associates, Inc rpt.doc
12 Table 1-1: Level of Service Descriptions LOS Arterial Roads Freeway Segments A Describes primarily free-flow operations at average travel speeds, usually about 90 percent of the free-flow speed for the given street class. Vehicles are completely unimpeded in their ability to maneuver within the traffic stream. Control delay at signalized intersections is minimal. Describes free-flow operations. Free-flow speeds prevail. Vehicles are almost completely unimpeded in their ability to maneuver within the traffic stream. The effects of incidents or point breakdowns are easily absorbed at this level. B Describes reasonably unimpeded operations at average travel speeds, usually about 70 percent of the free-flow speed for the street class. The ability to maneuver within the traffic stream is only slightly restricted, and control delays at signalized intersections are not significant. Represents reasonably free flow, and free-flow speeds are maintained. The ability to maneuver within the traffic stream is only slightly restricted, and the general level of physical and psychological comfort provided to drivers is still high. The effects of minor incidents and point breakdowns are still easily absorbed. C Describes stable operations; however, ability to maneuver and change lanes in midblock locations may be more restricted than at LOS B, and longer queues, adverse signal coordination, or both may contribute to lower average travel speeds of about 50 percent of the free-flow speed for the street class. Provides for flow with speeds at or near the free-flow speed of the freeway. Freedom to maneuver within the traffic stream is noticeably restricted, and lane changes require more care and vigilance on the part of the driver. Minor incidents may still be absorbed, but the local deterioration in service will be substantial. Queues may be expected to form behind any significant blockage. D Borders on a range in which small increases in flow may cause substantial increases in delay and decreases in travel speed. LOS D may be due to adverse signal progression, inappropriate signal timing, high volumes, or a combination of these factors. Average travel speeds are about 40 percent of free-flow speed. The level at which speeds begin to decline slightly with increasing flows and density begins to increase somewhat more quickly. Freedom to maneuver within the traffic stream is more noticeably limited, and the driver experiences reduced physical and psychological comfort levels. Even minor incidents can be expected to create queuing, because the traffic stream has little space to absorb disruptions. E Characterized by significant delays and average travel speeds of 33 percent or less of the free-flow speed. Such operations are caused by a combination of adverse signal progression, high signal density, high volumes, extensive delays at critical intersections, and inappropriate signal timing. At its highest density value, LOS E describes operation at capacity. Operations at this level are volatile, because there are virtually no usable gaps in the traffic stream. Vehicles are closely spaced, leaving little room to maneuver within the traffic stream at speeds that still exceed 49 miles per hour. Any disruption of the traffic stream, such as vehicles entering from a ramp or a vehicle changing lanes, can establish a disruption wave that propagates throughout the upstream traffic flow. At capacity, the traffic stream has no ability to dissipate even the most minor disruption, and any incident can be expected to produce a serious breakdown with extensive queuing. Maneuverability within the traffic stream is extremely limited, and the level of physical and psychological comfort afforded the driver is poor. F Characterized by urban street flow at extremely low speeds, typically one-third to one-fourth of the free-flow speed. Intersection congestion is likely at critical signalized locations, with high delays, high volumes, and extensive queuing. Describes breakdowns in vehicular flow. Such conditions generally exist within queues forming behind breakdown points. LOS F operations within a queue are the result of a breakdown or bottleneck at a downstream point. LOS F is also used to describe conditions at the point of the breakdown or bottleneck and the queue discharge flow that occurs at speeds lower than the lowest speed for LOS E, as well as the operations within the queue that forms upstream. Whenever LOS F conditions exist, they have the potential to extend upstream for significant distances. Source: Highway Capacity Manual 2000 (HCM 2000), Transportation Research Board, National Research Council. Masters College Master Plan 1-7 Austin-Foust Associates, Inc rpt.doc
13 For the arterial system, the peak hour is the accepted time period used for impact evaluation and a number of techniques are available to establish suitable V/C ratios and define the corresponding LOS. These definitions and procedures are established by individual local jurisdictions, such as the City of Santa Clarita, or by regional programs such as the Congestion Management Program (CMP). The analysis of the arterial road system is based on intersection capacity since this is the defining capacity limitation on an arterial highway system. There may be exceptions where certain facilities have long distances between signalized intersections, but within the traffic analysis study area, peak hour intersection performance is the most representative measure for evaluating the arterial road system. Levels of service for arterial roadway intersections are determined based on operating conditions during the AM and PM peak hours. For intersections, the intersection capacity utilization (ICU) methodology is applied, providing a planning level basis for determining V/C and LOS. This methodology sums the V/C ratios for the critical movements of an intersection and is the preferred procedure for intersection analysis by the City of Santa Clarita and the County of Los Angeles. The ICU methodology is generally compatible with the intersection capacity analysis methodology outlined in the HCM The ICU calculation methodology and associated impact criteria for the study area arterial system are summarized in Table DEFINITIONS Certain terms used throughout this report are defined below to clarify their intended meaning: ADT Average Daily Traffic. Generally used to measure the total two-directional traffic volumes passing a given point on a roadway. CMP Congestion Management Program. A state mandated program administered by the Los Angeles County Metropolitan Transportation Authority (MTA) that provides a mechanism for coordinating land use and development decisions. ICU Intersection Capacity Utilization. A measure of the volume to capacity ratio for an intersection. Typically used to determine the peak hour level of service for a given set of intersection volumes. Masters College Master Plan 1-8 Austin-Foust Associates, Inc rpt.doc
14 Table 1-2: Arterial Intersection Performance Criteria V/C Calculation Methodology Level of service to be based on peak hour intersection capacity utilization (ICU) values calculated using the following assumptions: Saturation Flow Rate: 1,750 vehicles/hour/lane for all lanes Clearance Interval:.10 Performance Standards LOS D or existing LOS, whichever is greater. Impact Thresholds An intersection is considered to be adversely impacted if: Compared to the ICU in the no-project alternative, the ICU in the with-project alternative increases the ICU by the following: With-Project ICU Project Increment (LOS D) greater than or equal to or more (LOS E & F) greater than or equal to.01 Abbreviations: V/C Volume/Capacity Ratio LOS Level of Service ICU Intersection Capacity Utilization Masters College Master Plan 1-9 Austin-Foust Associates, Inc rpt.doc
15 LOS Level of Service. A scale used to evaluate circulation system performance based on intersection ICU values or volume/capacity ratios of arterial segments. Peak Hour This refers to the hour during the AM peak period (typically 7 AM - 9 AM) or the PM peak period (typically 3 PM - 6 PM) in which the greatest number of vehicle trips are generated by a given land use or are traveling on a given roadway. Tripend A trip generation measure which represents the total trips entering and leaving a location. V/C Volume to Capacity Ratio. This is typically used to describe the percentage of capacity utilized by existing or projected traffic on a segment of an arterial or intersection. VPH Vehicles Per Hour. Used for roadway volumes (counts or forecasts) and trip generation estimates. Measures the number of vehicles in a one-hour period, typically the AM or PM peak hour. 1.6 REFERENCES 1. Highway Capacity Manual 2000, Transportation Research Board, National Research Council, Trip Generation 7 th Edition, Institute of Transportation Engineers, Preliminary Traffic Impact Report Guidelines, City of Santa Clarita, August Guide for the Preparation of Traffic Impact Studies, Caltrans, December Santa Clarita Valley Consolidated Traffic Model Report, County of Los Angeles Department of Public Works, Draft Santa Clarita Valley Consolidated Traffic Model 2004 Update and Validation, City of Santa Clarita and County of Los Angeles Department of Public Works, June Congestion Management Program for Los Angeles County, Los Angeles County Metropolitan Transportation Authority, July City of Santa Clarita General Plan Circulation Element, City of Santa Clarita, December Masters College Master Plan 1-10 Austin-Foust Associates, Inc rpt.doc
16 2.0 TRANSPORTATION SETTING This chapter describes the transportation setting for the traffic analysis. Existing conditions are first discussed, followed by a description of the future circulation system as outlined in the City s Circulation Element. 2.1 EXISTING CONDITIONS The following section describes existing traffic conditions in the study area. It includes a description of the study area roadway system, existing traffic volumes and corresponding levels of service as defined by the performance criteria outlined in the previous chapter Existing Roadway System The existing roadway network in the study area is illustrated in Figure 2-1 in the form of intersection lane configurations for the intersections being studied. Future planned roadways are also shown for comparison. Arterial roadways near the project site consist of Dockweiler Drive, Newhall Avenue, Railroad Avenue and Sierra Highway. The State Route 14 (SR-14) and the Interstate 5 (I-5) freeways provide regional access to the site. The SR-14 freeway is located approximately 1.5 miles east of the project site and can be accessed via interchanges at Newhall Avenue and Placerita Canyon Road. The I-5 freeway is located approximately 2.5 miles west of the project site and can be accessed via the Pico Canyon Road/Lyons Canyon Road interchange Existing Traffic Volumes and Levels of Service The existing average daily traffic (ADT) volumes on the study area roadway system are illustrated in Figure 2-2. Illustrations of peak hour turning movement volumes for the existing study area intersections can be found in Figure 2-3 and Figure 2-4 for the AM and PM peak hours, respectively. Peak hour counts have been collected specifically for this analysis in late 2006 and early For some locations, counts from the recent Downtown Newhall Specific Plan EIR (collected in 2005) were utilized. Each have been factored with a three percent annual growth factor to reflect 2008 conditions. Masters College Master Plan 2-1 Austin-Foust Associates, Inc rpt.doc
17
18
19
20
21 Not shown in the exhibits referenced in this section are the peak hour traffic counts that were collected within the Placerita Canyon neighborhood in the vicinity of the project site. These counts were collected in late 2006 and early 2007 specifically for this analysis and are discussed in greater detail in Section 3.1, Trip Generation. A listing of ICU values and the corresponding LOS for existing conditions is provided in Table 2-1. Detailed ICU calculation worksheets are provided in Appendix A. Table 2-1: ICU and LOS Summary - Existing (2008) Conditions AM Peak Hour PM Peak Hour Count Intersection ICU LOS ICU LOS Date 1 1. Railroad Ave & 13th Street.63 B.94 E Railroad Ave & Lyons Ave.30 A.34 A Newhall Ave & Lyons Ave.70 B.63 B Valle Del Oro & Dockweiler Drive.37 A.33 A Jan Valle Del Oro & Deputy Jake Drive.45 A.23 A Jan Valle Del Oro & Newhall Ave.58 A.62 B Feb Sierra Hwy & Dockweiler Drive.84 D.73 C Jan Sierra Hwy & Newhall Ave.85 D 1.06 F April SR-14 SB Ramps & Newhall Ave.46 A.67 B April SR-14 NB Ramps & Newhall Ave.23 A.55 A April All counts factored and adjusted to reflect 2008 conditions. 2 Source = Downtown Newhall Specific Plan EIR Level of service ranges: A B C D E Above 1.00 F Public Transportation Santa Clarita Transit provides fixed-route transit in the vicinity of the project site via Routes 1, 2, 5 and 6. Routes 1 and 2 provide service between Canyon County (Whites Canyon) and Castaic/Val Verde via Newhall Avenue. Routes 5 and 6 provide service between Newhall, Stevenson Ranch and Canyon Country via Lyons Avenue, Newhall Avenue, and Market Street. The nearest transit center is the Newhall Metrolink station, which is located just west of the project site near the intersection of Railroad Avenue and Market Street. Metrolink provides commuter rail service to areas such as Burbank and Downtown Los Angeles. Masters College Master Plan 2-6 Austin-Foust Associates, Inc rpt.doc
22 2.2 INTERIM YEAR SETTING The Interim Year setting includes roadway improvements and future infrastructure consistent with the cumulative projects included within this horizon. Generally, this corresponds to a horizon year of around 2018 to 2020 based on anticipated Santa Clarita Valley growth rates from sources such as the Southern California Association of Governments (SCAG). While this horizon does not coincide specifically with the buildout of the project site, it represents the best timeframe for planning purposes since it includes a comprehensive set of cumulative development projects that have been incorporated into the SCVCTM. With this, a conservative scenario is established for analyzing the impacts of the proposed project combined with projected and approved growth on a reasonably expanded circulation system. Major roadway projects that are part of the Interim Year setting include the following: the Cross Valley Connector gap closures, the Golden Valley Road extension, and the Via Princessa gap closure. Also typically included in the Interim Year setting is the extension of Dockweiler Drive to Railroad Avenue. For this analysis, the project has been evaluated both with and without the Dockweiler Drive extension to Railroad Avenue. Interim Year land use is based on data provided by the City and County and includes approved, pending and planned development projects. The Interim Year land use database was updated specifically for this analysis based on the most recent data from the City regarding these future projects. Table 2-2 summarizes the total land use and trip generation statistics for the entire Santa Clarita Valley area for existing (2004), Interim Year (2018/2020), and Long-range General Plan (2030) conditions. A list of known cumulative projects in the vicinity of the proposed project (approximately a three mile radius from the project site) is provided in Table 2-3. These cumulative projects are part of the Interim Year database noted above. Masters College Master Plan 2-7 Austin-Foust Associates, Inc rpt.doc
23 Table 2-2: Land Use and ADT Summary - Cumulative Conditions Existing (2004) Interim Year (2018/2020) Long-Range General Plan (2030) Land Use Type Units Amount ADT Amount ADT Amount ADT Single Family Residential DU 51, ,600 73, ,700 86, ,200 Multi-Family Residential DU 25, ,700 42, ,100 61, ,900 Commercial Retail MSF 9, ,000 15, ,900 21,600 1,153,500 Commercial Office MSF 2,300 28,500 7,800 95,400 15, ,900 Industrial Park MSF 18, ,000 42, ,400 41, ,200 Hotel Rooms 1,000 8,100 1,500 12,300 1,600 13,200 Elem/Middle School Stu. 32,500 47,100 46,800 67,900 50,500 73,200 High School Stu. 13,200 23,700 18,600 33,300 23,400 42,000 Other , , ,000 TOTAL -- 1,570,000 2,521,200 3,193,100 Notes: DU = Dwelling Units MSF = Million Square Feet Stu. = Students Masters College Master Plan 2-8 Austin-Foust Associates, Inc rpt.doc
24 Table 2-3: Cumulative Projects No. Name and/or Location Description 1 Tract North of Pico Cyn Rd, south of Stevenson Ranch Pkwy and west of I Single Family (SF) Residential Dwelling Units (DU), 4 Multi Family (MF) DU 2 Tract North of Pico Cyn Rd and west 8 Commercial Condo Units of I-5 3 Stevenson Ranch Phase III North of Pico Cyn Rd and west of The Old Road 94 SF DU 100 Condo/Townhouse DU 567 Apartment DU 5 Acre Park 4 Tract South of Pico Cyn Rd and west 6 MF DU of I-5 5 Riverpark/Tract North and south of Santa Clara River, terminus of Newhall Ranch Rd, south of Bouquet Cyn Rd and north of Soledad Cyn Rd 6 Heritage Hills/Tract Northwest and southwest corner of Dockweiler and Sierra Highway 7 UCLA Film Archives North of McBean Pkwy and west of Rockwell Cyn Rd 8 College of the Canyons Expansion South of Valencia Blvd and west of Rockwell Cyn Rd 9 Gate-King Industrial Park South of San Fernando Rd, west of Sierra Hwy 10 Milestone/Tract North side of Golden Valley Rd at Robert C. Lee Pkwy 11 Porta Bella/Whittaker-Bermite (partial) South side of Soledad Cyn Rd and east of Circle J Ranch area 439 SF DU 744 MF DU 40 Thousand Square Feet (TSF) of Commercial Uses 190 SF DU 250 TSF Commercial Office 28 TSF Commercial Office 6,500 Students (additional) 4,200 TSF Industrial Park 167 SF DU (33 total acres) 1,244 SF DU 1,667 MF DU 2,911 TSF of Commercial Uses Acres of Open Space (approximately 50% of total project shown above is included in the interim year horizon) 95 SF DU 95 Senior Housing 33 MF DU 12 Lyons Ranch/Tract West of I-5 and south of Calgrove Blvd 13 Tract South of Friendly Valley, north of Golden Valley Rd and terminus of Avenue of the Oaks 14 Northwest corner of Golden Valley Road and 105 TSF of Commercial Uses McKeon Drive 15 Tract North of Golden Valley Rd and 111 MF DU northwest of Sierra Highway 16 Downtown Newhall Specific Plan area 712 net new DU (1,402 total DU) net new TSF (1,107.4 total TSF) 17 North Newhall Specific Plan area 628 DU DU 585 TSF 840 TSF Non-Residential 1 Elementary School (673 DU, TSF, 1 Hotel and 1 Elem. School included in the interim year horizon) (Continued) Masters College Master Plan 2-9 Austin-Foust Associates, Inc rpt.doc
25 Table 2-3: Cumulative Projects (Continued) No. Name and/or Location Description 18 Golden Valley Ranch/Tract South of SR-14, north of Placerita Cyn Rd and west of Sand Cyn Rd 19 Bridgeport Market Place Northeast corner of McBean Pkwy and Newhall Ranch Rd 20 The Keystone Northeast portion of the future intersection of Newhall Ranch Rd and Golden Valley Rd 21 Soledad Circle Estates South of Soledad Cyn Rd at Penlon Court 22 Soledad Village South of Santa Clara River, north of Soledad Cyn Rd at Gladding Way 23 Henry Mayo Newhall Memorial Hospital Master Plan 498 SF DU TSF of Commercial Uses 1 Elementary School 130 TSF of Commercial Uses 30 TSF Church 5 Acre Park 319 SF DU 180 MF DU 147 SF DU 407 Condo DU (incl. 22 live/work units) 8 TSF of Commercial Uses net new TSF of Hospital net new TSF of Medical Office 24 Town Center Mall Expansion 490 TSF of Commercial Uses 25 Newhall Gateway Plaza Northeast corner of 22 TSF Shopping Center Sierra Hwy and Newhall Ave Sources: City of Santa Clarita Planning Division Downtown Newhall Specific Plan Draft North Newhall Specific Plan Land Use Matrix Henry Mayo Newhall Memorial Hospital Master Plan Traffic Study Town Center Mall Expansion Traffic Study Masters College Master Plan 2-10 Austin-Foust Associates, Inc rpt.doc
26 3.0 IMPACT ANALYSIS 3.1 TRIP GENERATION The project description and site plan were presented in Section 1.1. Trip generation for the project is summarized in Table 3-1 and is followed by a detailed discussion on the derivation of the trip generation estimates. Table 3-1: Trip Generation and Trip Rate Summary - Proposed Project AM Peak Hour PM Peak Hour Units In Out Total In Out Total ADT Existing College College 1,105 STU ,696 Future College College 1,700 STU ,148 Condominiums 54 DU Total ,580 Net New Trips ,884 Trip Rate College STU Condominium/Townhouse DU Trip rate sources: SCVCTM, ITE, Field Survey of Masters College The Institute of Transportations Engineers (ITE) Trip Generation Manual includes trip generation factors for Universities and Colleges (Category 550) that are derived from case studies of seven different institutions. Likewise, the SCVCTM includes a similar trip generation rate which has historically been used to estimate traffic generated by the colleges in the Santa Clarita Valley. However, due to the unique features of the Masters College facility, a detailed trip generation evaluation was undertaken for the purpose of determining appropriate rates for use in this Master Plan traffic study. Masters College requires all unmarried students who are not living with their parents to live on campus. Six of the seven dormitory buildings are located on the main campus site and the seventh dormitory is located in nearby downtown Newhall. Many colleges and universities require the freshman class to live on campus but it is less common for virtually all students to live on campus in this manner. Masters College Master Plan 3-1 Austin-Foust Associates, Inc rpt.doc
27 While Masters College students are allowed to have their own automobiles (currently there is approximately 654 total according to the Master Plan), it is nonetheless reasonable to consider that this required living arrangement may result in trip generation rates that are lower than the average college or university. The way that the Masters College facilities are distributed within the Placerita Canyon community makes it infeasible to take a direct measurement of the traffic volumes currently being generated by the school. Given the layout of the campus, College traffic is mixed in with the traffic generated by the adjacent community. To estimate the College s trip generation, traffic counts were collected on roadways (24 hour counts) and intersections (peak hour turning movement counts) within and immediately around the campus. Counts were collected in November 2006 while school was in session and again in January 2007 while the school was in winter recess. Appendix B contains these traffic count data sheets as reference. By defining a cordon boundary around the campus area and collecting counts at each intersecting roadway, an indication of the College s trip generation can be derived by comparing the volumes entering and exiting the cordoned area. In addition to the College, several residential homes and a church are within the cordon boundary and the College trip generation estimate has been adjusted accordingly to account for these other uses. The field survey trip generation estimate indicates that the College generates peak hour (peak direction) traffic that is less than the ITE average peak hour (peak direction) rate. However, the field survey ADT estimate is similar to the ITE average ADT rate. The City s traffic model (SCVCTM) estimates college trip generation with rates that are generally less than the ITE average rates. The SCVCTM rates are closer to the field survey estimates of a peak hour, peak direction rate but are lower than the estimated field survey ADT rate. Table 3-2 compares the field survey estimates of trip generation rates to the ITE and the SCVCTM rates. The table also shows the trip generation rates selected for use in this traffic study, which consist of a combination of the trip rates used by the SCVCTM and the rates derived from the survey of the existing Masters College area. The specific rates have been selected based on a criteria of providing a conservative analysis appropriate for an EIR impact study. The ITE rates are not utilized in this traffic study since the unique features of the campus, as noted above, differentiate it from the average college or university represented by the ITE rates Masters College Master Plan 3-2 Austin-Foust Associates, Inc rpt.doc
28 Table 3-2: Trip Rate Comparison - Masters College AM Peak Hour PM Peak Hour IB OB Total IB OB Total ADT Field Survey Estimate ITE Average Rate SCVCTM Rate Trip Rate utilized for EIR Traffic Study Combination of SCVCTM rate and Field Survey The Masters College project description also includes 54 condominium units in addition to the proposed expansion of the College facilities. Consistent with other traffic studies prepared by the City of Santa Clarita, the townhome/condominium trip generation rates from the SCVCTM are utilized in this analysis. As shown in the previously referenced table, the Master Plan project is forecast to generate an additional 1,900 daily trips as compared to the daily trips currently generated by the campus. Peak hour forecasts consist of 120 additional trips in the AM peak hour (88 inbound) and 164 additional trips in the PM peak hour (97 outbound). The Master Plan project total, including the existing trips generated by the College, is forecast to generate approximately 4,600 daily trips. Peak hour forecasts consist of 286 trips in the AM peak hour (243 inbound) and 396 trips in the PM peak hour (252 outbound). 3.2 TRIP DISTRIBUTION The distribution of trips to and from the project site is calculated by the Santa Clarita Valley Consolidated Traffic Model (SCVCTM). Figure 3-1 summarizes the general distribution of project traffic based on a 24 hour period, as derived using SCVCTM model runs prepared specifically for this analysis. Masters College Master Plan 3-3 Austin-Foust Associates, Inc rpt.doc
29
30 When using a traffic forecasting model to produce future traffic projections with and without a proposed land use development project, separate runs of the traffic model are typically performed with and without the project. These separate runs assume that no changes occur to the surrounding land uses or to traffic generation within or beyond the study area, other than on the project site. Hence, while there is a net increase in trip generation locally due to the project, many trips within the study area are redirected to the project site and therefore are not necessarily new trips as far as the study area circulation system is concerned. In other words, the project traffic is not merely added to no-project traffic conditions by the model, but instead the project trips interact with surrounding land uses in a manner that changes the distribution patterns of non-project trips. Because the model derives a discrete set of forecasts for each of the peak hours (i.e., the AM and the PM peak hour), the unique characteristics of each of these time periods is reflected in the assignment of traffic volumes. As noted previously, one of the scenarios evaluated in this study is based on the planned extension of Dockweiler Drive to Railroad Avenue. This connection will change the existing traffic patterns within the study area, including the existing Masters College traffic patterns, and is reflected in the model runs for this scenario. For the purpose of this study, the extension is presumed to connect with Railroad Avenue at the intersection of Lyons Avenue. ADT volumes for Interim Year conditions without the project are provided in Figure 3-2, with volumes illustrated for conditions with and without extension of Dockweiler Drive to Lyons Avenue. Figure 3-3 illustrates the Interim Year AM peak hour volumes for no project conditions without the extension of Dockweiler Drive to Lyons Avenue. Figure 3-4 illustrates the corresponding set of AM peak hour volumes with the Dockweiler Drive extension. Figure 3-5 and Figure 3-6 provide the comparable set of volumes for PM peak hour conditions. With the proposed project, the ADT volumes illustrated in Figure 3-7 result. Figure 3-8 illustrates the Interim Year AM peak hour conditions without the extension of Dockweiler Drive to Lyons Avenue. Figure 3-9 illustrates the corresponding set of AM peak hour volumes with the Dockweiler Drive extension, with the proposed project. Figure 3-10 and Figure 3-11 provide the comparable set of volumes for PM peak hour conditions with the proposed project. Masters College Master Plan 3-5 Austin-Foust Associates, Inc rpt.doc
31
32
33
34
35
36
37
38
39
40
41 In each of the figures referenced above, the estimated number of trips to and from the College is shown in parenthesis. For no project conditions, these trips utilize the 13 th Street connection to Placerita Canyon Road exclusively. For with project conditions, the majority of College trips will utilize the new Dockweiler Drive entry point and a reduction of College traffic on Placerita Canyon Road results. 3.3 LEVEL OF SERVICE ANALYSIS A level of service analysis is prepared to determine if the proposed project causes a significant impact to the intersections within the project study area. ICU values are calculated with and without project traffic and the impact criteria described in Section 1.4 is used to determine significant impacts. A matrix of ICU values for conditions with and without the proposed project and with and without the Dockweiler Drive extension is provided in Table 3-3. The ICUs have been calculated using the Interim Year traffic volume forecasts presented in the previous section and with the intersection lane geometry illustrated in Figure 3-12, which includes improvements anticipated to be in place before development of the project occurs. These improvements correspond with the 2010 Build roadway network documented in the Downtown Newhall Specific Plan EIR and are utilized for background conditions without the Dockweiler Drive extension to Lyons Avenue. For background conditions with the Dockweiler Drive extension, intersection lanes at the Newhall Avenue/Dockweiler Drive intersection were estimated based on the minimum lane requirements needed to accommodate the anticipated traffic at this location for no-project conditions. As shown in the previously referenced Table 3-3, the project does not result in a significant impact for the study area locations addressed here, for either the scenario with or without the Dockweiler Drive extension. However, a CMP impact has been identified as discussed in the following section. 3.4 CMP ANALYSIS The Los Angeles County Congestion Management Program (CMP) requires that a proposed development address two major subject areas with respect to traffic impacts. These are the project s impacts on the CMP highway system and on the local and regional transit systems. Masters College Master Plan 3-16 Austin-Foust Associates, Inc rpt.doc
42 Table 3-3: ICU and LOS Summary - Interim Year with and without Project Without Dockweiler Drive Extension With Dockweiler Drive Extension No Project With Proj. No Project With Proj. Location ICU LOS ICU LOS Chg. ICU LOS ICU LOS Chg. AM Peak Hour 1. Railroad Ave & 13th St.81 D.79 C D.81 D Railroad Ave & Lyons Ave 1.03 F 1.02 F D.87 D Newhall Ave & Lyons Ave.73 C.73 C C.79 C Valle Del Oro & Dockweiler Dr.38 A.43 A A.45 A Valle Del Oro & Deputy Jake Dr.44 A.46 A A.34 A Valle Del Oro & Newhall Ave.71 C.73 C A.55 A Sierra Hwy & Dockweiler Dr.72 C.75 C C.80 C Sierra Hwy & Newhall Ave 1.08 F 1.07 F F 1.03 F SR-14 SB Ramps & Newhall Ave.43 A.43 A A.43 A SR-14 NB Ramps & Newhall.23 A.23 A A.21 A.00 Ave 11. Masters College & Dockweiler A A -- PM Peak Hour 1. Railroad Ave & 13th St 1.26 F 1.21 F F 1.28 F Railroad Ave & Lyons Ave 1.01 F 1.01 F D.82 D Newhall Ave & Lyons Ave.62 B.61 B B.66 B Valle Del Oro & Dockweiler Dr.43 A.56 A B.62 B Valle Del Oro & Deputy Jake Dr.29 A.36 A A.31 A Valle Del Oro & Newhall Ave.65 B.68 B A.57 A Sierra Hwy & Dockweiler Dr.67 B.70 B C.75 C Sierra Hwy & Newhall Ave 1.00 E 1.00 E E.93 E SR-14 SB Ramps & Newhall Ave.54 A.54 A A.56 A SR-14 NB Ramps & Newhall.43 A.43 A A.42 A.00 Ave 11. Masters College & Dockweiler A A -- Level of service ranges: A B C D E Above 1.00 F Masters College Master Plan 3-17 Austin-Foust Associates, Inc rpt.doc
43
44 According to the CMP guidelines, the geographical area examined in a CMP traffic impact analysis (TIA) consists of the CMP monitoring locations that meet the following criteria: 1. CMP intersections where the proposed project will add 50 or more trips during either the AM or PM weekday peak hours (of adjacent street traffic). 2. Mainline freeway monitoring locations where the project will add 150 or more trips, in either direction, during either the AM or PM weekday peak hours. The nearest CMP intersections to the project site are Newhall Avenue at Lyons Avenue, Newhall Avenue at Sierra Highway, and Sierra Highway at Placerita Canyon Road. Of these three intersections, one (Sierra Highway at Placerita Canyon Road) meets the CMP criteria noted above. The net amount of new traffic added to the Sierra Highway at Placerita Canyon Road intersection is 55 vehicles in the AM peak hour and 97 in the PM peak hour, for the scenario without the Dockweiler Drive extension to Lyons Avenue. With the Dockweiler Drive extension, the net amount of new traffic added to this intersection is 40 vehicles in the AM peak hour and 97 in the PM peak hour. Important to note is that the traffic increases noted above include both the new traffic generated by the project and the redistribution of existing Masters College traffic that occurs with the proposed new main entry on Dockweiler Drive. When only the new traffic generated by the College expansion is considered (i.e., not including the redistribution of the existing College traffic due to the new entry location), the project is under the 50 trip threshold. Nonetheless, an evaluation of the intersection has been prepared in accordance with the CMP guidelines. Since the intersection in question is outside of the project study area, additional Interim Year forecasts were obtained for the purpose of this CMP analysis from the same SCVCTM model runs used for the evaluation of the study area intersections. CMP methodology states that a significant project impact occurs when the proposed project increases traffic demand at a CMP monitoring location by two percent of capacity (V/C.02), causing or worsening LOS F. A summary of the CMP intersection analysis is provided in Table 3-4, which shows that the project results in a significant impact at this location. Mitigation that addresses the impact is provided in Section 4.0. The CMP freeway monitoring location nearest to the project site is SR-14 between Newhall Avenue and I-5. The net amount of new traffic added to the freeway monitoring location (by direction) is Masters College Master Plan 3-19 Austin-Foust Associates, Inc rpt.doc
45 16 vehicles in the AM peak hour and 12 in the PM peak hour. Therefore the project does not meet the CMP criteria for a freeway analysis. Table 3-4: ICU and LOS Summary CMP Intersection Analysis Without Dockweiler Drive Extension With Dockweiler Drive Extension No Project With Proj. No Project With Proj. Location ICU LOS ICU LOS Chg. ICU LOS ICU LOS Chg. AM Peak Hour 12. Sierra Highway & Placerita Canyon with CMP methodology.97 E.98 E F 1.03 F.01 with City methodology.90 D.91 E E.95 E.01 PM Peak Hour 12. Sierra Highway & Placerita Canyon with CMP methodology 1.23 F 1.25 F F 1.29 F.02 with City methodology 1.13 F 1.15 F F 1.18 F.01 Values shown in bold represent a significant project impact (see Section 3.4 for CMP impact criteria and Section 1.4 for City impact criteria). Level of service ranges: A B C D E Above 1.00 F Another component of the CMP transportation impact analysis is a review of transit impacts. This review includes evidence that transit operators received the Notice of Preparation (included in the project EIR), identification of existing transit services near the project, estimation of the number of project trips assigned to transit, information on facilities and/or programs that will encourage public transit use, and an analysis of project impacts on transit service. The existing transit services in the vicinity of the project site are discussed in Section An estimation of total project transit trips is accomplished by using the CMP guidelines to first estimate total project person trips and from that value, estimate total project transit trips. The CMP guidelines specify an occupancy factor of 1.4 to convert ADT to person trips. Since the project is further than ¼ mile (walking distance) from an existing transit center, the CMP guidelines then prescribe using a factor of 3.5% to convert person trips to transit trips. Applying these factors results in 90 new total daily transit trips and approximately 8 new peak hour transit trips due to the proposed project. Masters College Master Plan 3-20 Austin-Foust Associates, Inc rpt.doc
46 The City of Santa Clarita does not have level of service standards for transit service that are applicable to future development such as the proposed project. Transit service is evaluated and funded on an as-needed basis. If enhancements to the current fixed route service, such as to the existing transit center, will be needed in the future, the project should coordinate with the transit provider to identify appropriate measures. Masters College Master Plan 3-21 Austin-Foust Associates, Inc rpt.doc
47 4.0 MITIGATION 4.1 PROPOSED MITIGATION MEASURES Section 3.4 identified significant project impacts for CMP monitoring intersections based on CMP impact analysis methodology. The impacted intersection is as follows: Sierra Highway & Placerita Canyon Road At the CMP monitoring intersection of Sierra Highway & Placerita Canyon Road, the project has been shown to cause a significant impact. Intersection improvements have been identified that mitigate the projects impacts. The recommended improvements are as follows: Add a separate northbound (Sierra Highway) right-turn lane (striping). Reconfigure the two westbound (Placerita Canyon Road) through lanes to a shared left/through/right-turn lane and a dedicated right-turn lane (striping). Modify the traffic signal for split-phasing for Placerita Canyon Road approaches and provide right-turn overlap phasing for northbound (Sierra Highway) right-turns. Table 4-1 summarizes the mitigation measures noted above. Table 4-2 summarizes the intersection ICUs and LOS with the implementation of these recommended mitigation measures and shows that the recommended mitigation measures will fully mitigate the impacts of the proposed project. Table 4-1: Mitigation Summary Intersection Mitigation 12. Sierra Highway & Placerita Canyon Add a separate northbound (Sierra Highway) right-turn lane (striping) Reconfigure the two westbound (Placerita Canyon Road) through lanes to a shared left/through/right-turn lane and a dedicated right-turn lane (striping) Modify the traffic signal for split-phasing for Placerita Canyon Road approaches (signal modification) Modify the traffic signal to provide right-turn overlap phasing for northbound (Sierra Highway) right-turns (signal modification) Masters College Master Plan 4-1 Austin-Foust Associates, Inc rpt.doc