The Impacts of the Recent Hurricanes to Energy Infrastructure and Markets
|
|
|
- Bernadette Bell
- 5 years ago
- Views:
Transcription


1 The Impacts of the Recent Hurricanes to Energy Infrastructure and Markets Powering Up: A Discussion About the Future of Louisiana s Energy Industry Sponsored by the Kean Miller Law Firm October 13, 2005 David E. Dismukes Center for Louisiana State University

2 Information Available For Download
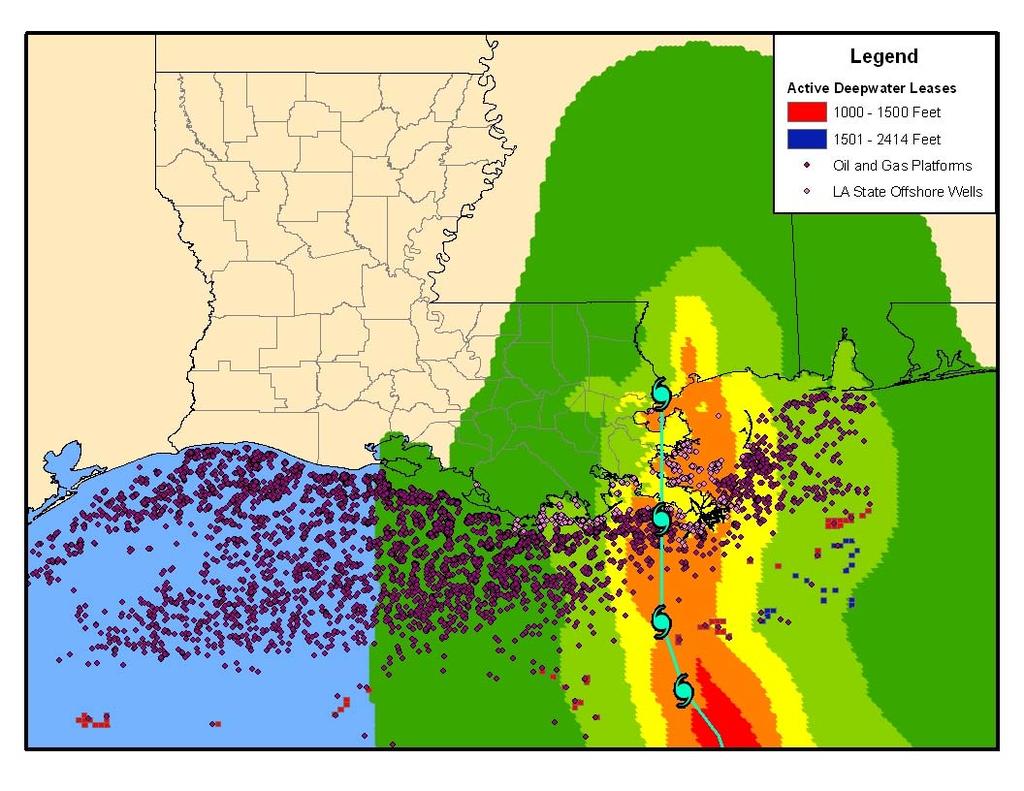
3 Platforms/Structures Impacted by Katrina
4 Katrina versus Other Major Hurricanes - Shut-in Oil Production as a Percent of Daily GOM Production 120% 100% Katrina (Landfall: August 29, 2005) Dennis (Landfall: July 10, 2005) Ivan (Landfall: September 16, 2004) 80% percent 60% 40% 20% 0% Landfall Source: Minerals Management Service
5 Refineries Impacted by Katrina Gulf Coast, Port Arthur and Lake Charles Company Location Processing Capacity Status (barrels per day) (as of August 31) ExxonMobil Baton Rouge, LA 493,500 reduced runs ChevronTexaco Pascagoula, MS 325,500 shutdown Citgo Lake Charles, LA 324,300 total supply loss ConocoPhillips Belle Chasse, LA 247,000 shutdown Marathon Garyville, LA 245,000 shutdown ConocoPhillips Lake Charles, LA 239,400 total supply loss Motiva (Shell) Convent, LA 235,000 shutdown Motiva (Shell) Norco, LA 226,500 shutdown Total Port Arthur, TX 211,500 reduced runs ExxonMobil Chalmette, LA 187,200 shutdown Valero St. Charles 185,000 shutdown Murphy Meraux 120,00 shutdown Valero Krotz Springs, LA 80,000 reduced runs Shell Chemical Saraland, AL 80,000? Shell Chemical St Rose, LA 55,000 shutdown Placid Oil Port Allen, LA 48,500 reduced runs Source: Energy Information Administration, Department of Energy
6 Gasoline Price Increases August 30, 2005 to September 6, Regional Changes in Gasoline Prices (cents per gallon) 60.1 Mid-Atlantic 54.9 Northeast 51 South Atlantic 46.9 Midwest 39.5 South 38.5 Mountain 25.3 West 44.7 US Colonial / Plantation Pipeline Systems < > Source: American Petroleum Institute
7 Total Immediate Refinery Impact LA/MS/AL Gulf Coast Refiners (reduced runs and shutdowns) 2,528 thousand bbls/day 15% of US operating capacity Port Arthur/Lake Charles (reduced runs and supply loss) 775 thousand bbls/day 5% of US operating capacity Midwest (reduced runs supplied by Capline Pipeline) 1,628 thousand bbls/day 10% of US operating capacity Remaining US Operating Capacity 12,075 thousand bbls/day 70% of US operating capacity Total Refinery Impact 4,931 thousand bbls/day 30% of US operating capacity Source: Energy Information Administration, Department of Energy
8 Katrina versus Other Major Hurricanes - Shut-in Gas Production as a Percent of Daily GOM Production 100% 90% Katrina (Landfall: August 29, 2005) Dennis (Landfall: July 10, 2005) Ivan (Landfall: September 16, 2004) 80% 70% percent 60% 50% 40% 30% 20% 10% 0% Landfall Source: Minerals Management Service
9 Number of Natural Gas Processing Facilities Out Capacity 2004 as of Average Plant Location Jan 1, 2005 Throughput Status (as of September 10) (MMcf/d) Duke Energy Bay, AL available for service, but waiting on pipeline outlet for liquids BP Pascagoula, MS 1, power restored. waiting for pipelines to deliver gas Dynegy Venice, LA 1, seawater damage. Could take 3-6 months to repair Dynegy Yscloskey, LA 1,850 1,343 seawater damage. Could take 3-6 months to repair Enterprise Prod. Toca, LA 1, assessment ongoing ExxonMobil Garden City, LA 630 n.a. waiting on power ExxonMobil Grand Isle, LA waiting on power Marathon Burns Point, LA waiting on power Source: Energy Information Administration, Department of Energy

10 Shell Mars Tension Leg Platform Source: Shell.com

11 Ocean Warwick Dauphin Island, AL

12 Semi-Sub Stuck Under Bridge North Mobile Bay

13 Venice Port, Supply & Crew Bases

14 Chevron Refinery Pascagoula, MS
15 Then, Along Comes Rita

16 Platforms/Structures Impacted by Rita
17 Shut-in Statistics Crude Oil Percent Rita Percent Total Percent Shut-in of Daily Cumulative of Annual Cumulative of Annual Oil GOM Oil Shut-in Oil GOM Oil Shut-in Oil GOM Oil Date Production Production Production Production Production 1 Production (bbls/day) (%) (bbls) (%) (bbls) (%) 20-Sep , % 877, % 26,000, % 21-Sep-05 1,097, % 1,974, % 27,104, % 22-Sep-05 1,379, % 3,353, % 28,483, % 23-Sep-05 1,486, % 4,840, % 30,280, % 24-Sep-05 1,500, % 6,341, % 31,781, % 25-Sep-05 1,501, % 7,843, % 33,283, % 26-Sep-05 1,527, % 9,370, % 34,811, % 27-Sep-05 1,512, % 10,883, % 36,361, % 28-Sep-05 1,511, % 12,395, % 37,881, % 29-Sep-05 1,478, % 13,874, % 39,360, % 30-Sep-05 1,467, % 15,341, % 40,828, % 3-Oct-05 1,391, % 1,391, % 45,119, % 4-Oct-05 1,349, % 2,741, % 46,457, % 5-Oct-05 1,299, % 4,041, % 47,756, % 6-Oct-05 1,202, % 5,243, % 48,959, % 7-Oct-05 1,162, % 6,406, % 50,105, % 11-Oct-05 1,062, % 1,062, % 54,557, % Note: 1 cumulative production is as of August 26, 2005 Source: Minerals Management Service
18 Rita versus Other Major Hurricanes - Shut-in Oil Production as a Percent of Daily GOM Production 100% 90% Rita (Landfall: September 24, 2005) Katrina (Landfall: August 29, 2005) Dennis (Landfall: July 10, 2005) Ivan (Landfall: September 16, 2004) 80% 70% percent 60% 50% 40% 30% 20% 10% 0% Landfall Source: Minerals Management Service

19 Refineries Shutdown Due to Rita Barrels Plant Location per Day Louisiana Plants 1 Calcasieu Refining Lake Charles 30,000 6 Citgo Petroleum Lake Charles 324,300 8 ConocoPhillips Westlake 239, Valero Energy Krotz Springs 80,000 Texas Plants 1 Fina Oil and Chemical Co Pasadena 80,000 2 Valero Refining Co Texas City 90,000 3 Exxon Coal USA Baytown 75,000 4 BP Amoco Corp Texas City 84,000 5 Lubrizol Corp Deer Park 80,000 6 Motiva Enterprises Port Arthur 59,000 7 Mobil Oil Corp Beaumont 82, Lyondell-Citgo Refining Houston 99, Shell Oil Co Deer Park 88, Lubrizol Corp Pasadena 80, Premcor Refining Group Port Arthur 100, Marathon Ashland Petroleum Texas City 96, Sartomer Co Inc Houston 100, Valero Refining Houston 92, Fina Oil and Chemical Co Port Arthur 85, Phillips Petroleum Old Ocean 100,000
20 Total Immediate Refinery Impact Port Arthur/Lake Charles (shutdowns and damaged facilities) 1,715 thousand bbls/day 10% of US operating capacity Houston/Texas City (shutdowns and damaged facilities) 2,292 thousand bbls/day 13.5% of US operating capacity Corpus Christi (shutdown and reduced runs) 706 thousand bbls/day 4% of US operating capacity Remaining US Operating Capacity 11,954 thousand bbls/day 70% of US operating capacity Midwest (reduced runs from supply loss) 338 thousand bbls/day 2% of US operating capacity Total Refinery Impact 5,052 thousand bbls/day 30% of US operating capacity Source: Energy Information Administration, Department of Energy
21 Shut-in Statistics Natural Gas Percent Rita Percent Total Percent Shut-in of Daily Cumulative of Annual Cumulative of Annual Natural Gas GOM Gas Shut-in Gas GOM Gas Shut-in Gas GOM Gas Date Production Production Production Production Production 1 Production (MMcf/day) (%) (MMcf) (%) (Bcf) (%) 20-Sep-05 3, % 3, % % 21-Sep-05 4, % 8, % % 22-Sep-05 6, % 14, % % 23-Sep-05 7, % 21, % % 24-Sep-05 7, % 29, % % 25-Sep-05 8, % 37, % % 26-Sep-05 7, % 45, % % 27-Sep-05 7, % 53, % % 28-Sep-05 8, % 61, % % 29-Sep-05 7, % 69, % % 30-Sep-05 7, % 77, % % 3-Oct-05 7, % 7, % % 4-Oct-05 7, % 14, % % 5-Oct-05 6, % 21, % % 6-Oct-05 6, % 28, % % 7-Oct-05 6, % 34, % % 11-Oct-05 6, % 6, % % Note: 1 cumulative production is as of August 26, 2005 Source: Minerals Management Service
22 Rita versus Other Major Hurricanes - Shut-in Gas Production as a Percent of Daily GOM Production 100% 90% 80% Rita (Landfall: September 24, 2005) Katrina (Landfall: August 29, 2005) Dennis (Landfall: July 10, 2005) Ivan (Landfall: September 16, 2004) 70% percent 60% 50% 40% 30% 20% 10% 0% Landfall Source: Minerals Management Service
23 Number of Natural Gas Processing Facilities Out Potential Impacts on GOM Gas Supply from Processing Facility Outages Number of Facilities Capacity (MMcf/d) Throughput (MMcf/d) Katrina Facilities (Central GOM) 4 4,250 2,948 Rita Facilities (Western GOM) Cameron Facilities 6 2,155 1,231 Vermillion Facilities 3 1, Total Rita Impacts 9 3,625 2,005 Total (All Katrina and Rita) 7,875 4,953 Assume GOM Gas Production 10,000 10,000 Percent of Total (Katrina + Cameron Only) 64% 42% Percent of Total (Katrina + Cameron & Vermillion) 79% 50% Source: Energy Information Administration, Department of Energy

24 Gas Processing Facilities Impacted by Rita

25 Henry Hub, September 25, 2005 Source: LIOGA

26 Entergy Transmission Source: Entergy.com


27 Single Well Caisson Western GOM Source: MMS


28 Natural Gas Pipeline Leak Source: MMS


29 Chevron Typhoon TLP
30 Longer Run Impacts of Hurricanes Katrina and Rita
31 Estimated Decrease in Refining Production from both Katrina and Rita 6,000 Refining capacity should return to normal soon, but there will be a stubborn five percent of total capacity that has unknown return date not good for tight markets 100% 5,000 Total Lost Production Lost Production as a Percent of US Total Capacity 90% 80% thousand bbls per day 4,000 3,000 2,000 70% 60% 50% 40% 30% percent of US capacity 1,000 20% 10% 0 0% Landfall Source: Assumes 95 percent capacity factor; assumes 4 week recovery for facilities damaged by Rita.
32 Cumulative Refining Production 4,000 3,500 Impacts of Katrina result in a loss of million barrels, or 4 percent of total production, by the end of the year. Impacts of Katrina and Rita result in a loss of million barrels, or over 5 percent of total, by the end of the year. Cumulative Production - Business as Usual Cumulative Production - After Katrina Cumulative Production - After Katrina and Rita 3,000 2,500 million bbls 2,000 1,500 1, Jun-05 Jul-05 Aug-05 Sep-05 Oct-05 Nov-05 Dec-05 Source: Assumes 95 percent capacity factor
33 Estimated Return of Existing Crude Production 1,800 1,600 If crude production returns follow path similar to Ivan, we could still be experiencing production shut-ins for some time. 100% 90% thousand bbls per day 1,400 1,200 1, % 70% 60% 50% 40% 30% 20% percent of daily GOM production (%) % 0 Landfall Ivan Katrina Rita days after landfall % of Daily GOM Production - Ivan % of Daily GOM Production - Katrina % of Daily GOM Production - Rita 0% Note: Assuming recovery of 2,685 barrels per day for remaining days.
34 Forecast versus New Forecast Crude Oil 6 5 million barrels per day EIA Short-Term Outlook Outlook after Katrina Outlook after Rita Q Q Q Q Q Q Note: Assuming recovery of bcf per day for 150 days.
35 Estimated Return of Existing Natural Gas Production 10 9 If natural gas production returns follow path similar to Ivan, we could still be experiencing production shut-ins for some time. 100% 90% bcf per day % 70% 60% 50% 40% 30% 20% Percent of Daily GOM Production (%) 1 10% 0 Landfall Ivan Katrina Rita % of Daily GOM Production - Ivan % of Daily GOM Production days - Katrina after landfall % of Daily GOM Production - Rita 0% Note: Assuming recovery of bcf per day for remaining days.
36 Forecast versus New Forecast Natural Gas 6 5 EIA Short-Term Outlook Outlook after Katrina Outlook after Rita 4 tcf Q Q Q Q Q Q Note: Assuming recovery of bcf per day for 150 days.
37 Estimated Decrease in Natural Gas Storage Using 5-Year Average Using 2005 Average Weekly Injection Weekly Injection Katrina Katrina Katrina and Rita Katrina and Rita (Bcf) (Bcf) Current Natural Gas Storage Amount: (stocks as of September 30, 2005) 2,929 2,929 2,929 2,929 Total Remaining Injection Amount: (from September 30, 2005) Estimated Storage Level, Nov. 1: 3,169 3,169 3,111 3,111 Estimated Lost Natural Gas Production (Sep 30-Nov 1): Estimated Natural Gas Production (Sep 30-Nov 1): 1,581 1,498 1,581 1,498 Estimated Natural Gas Consumption (Sep 30-Nov 1): 1,406 1,406 1,406 1,406 Balance after Consumption Difference between Injection Amount and Balance (65) (149) (7) (91) Estimated Storage Level, Nov 1 (Corrected): 3,104 3,020 3,104 3,020
38 Where Have We Been? Where Are We Now?
39 Historic Trends in Louisiana Electric Rates by Customer Class, 1990 through cents per kwh Residential Commercial Industrial Source: Energy Information Administration, Department of Energy
40 Comparison of Industrial Electric Rates in the Southeast, cents per kwh Florida Louisiana Texas US Average Mississippi Georgia Alabama Arkansas Source: Energy Information Administration, Department of Energy
41 Estimated Expenditures on Electric Power by Selected Industrial Sectors in Louisiana (2002) Estimated Percent of Electric Total Energy SIC Expenditures Expenditures ($) (%) 20 Food and Kindred Products $ 20,234,550 54% 22 Textile Mill Products $ 5,456,401 60% 23 Apparel & Textile Products $ 428,472 89% 24 Lumber and Wood Products $ 16,155,979 61% 26 Paper and Allied Products $ 376,284,930 81% 27 Printing & Publishing $ 2,092,766 94% 28 Chemicals and Allied Products $ 1,150,674,843 39% 29 Petroleum and Coal Products $ 411,393,500 65% 30 Rubber & Misc. Plastic Prods. $ 27,876,814 97% 31 Leather & Leather Products $ 93, % 32 Stone, Clay & Glass Products $ 7,077,421 42% 33 Primary Metal Industries $ 42,166,137 79% 34 Fabricated Metal Products $ 4,449,155 61% 35 Machinery & Computer Equip. $ 3,778,519 85% 36 Electric & Electronic Equip. $ 46,420,441 97% 37 Transportation Equipment $ 17,078,545 78% 38 Instruments & Related Products $ 53,757 76% 39 Misc. Manufacturing Industries $ 26,592 78% Source: Major Industrial Plant Database, IHS Energy
42 What is the Source of the Problem?
43 Louisiana Generation Shares by Fuel Type, 1999 and Petroleum Other 2% Renewables 3% Other 2% Hydroelectric 1% Other 3% Petroleum 4% Other Renewables 3% Hydroelectric 1% Nuclear 15% Natural Gas 53% Nuclear 18% Natural Gas 46% Coal 24% Coal 25% Source: Energy Information Administration, Department of Energy
44 Natural Gas Generation Efficiency 16, ,000 12,000 Btu per kwh 10,000 8,000 6,000 4,000 2,000 0 CLECO EGS-LA ELI ENO Source: Energy Information Administration, Department of Energy
45 What About Natural Gas?
46 $14 $12 $10 $8 $6 $4 $2 $0 Historic Natural Gas Prices Jan-94 Jul-94 Jan-95 Jul-95 Jan-96 Jul-96 Jan-97 Jul-97 Jan-98 Jul-98 Jan-99 Jul-99 $ per Mcf Jan-00 Jul-00 Jan-01 Jul-01 Jan-02 Jul-02 Jan-03 Jul-03 Jan-04 Jul-04 Jan-05 Jul-05 Monthly Henry Hub Price Annual Average Henry Hub Price Source: Federal Reserve Bank of St. Louis
47 Historic Trends in Louisiana Electric Rates by Customer Class, 1990 through 2004 $12 $10 Residential Commercial Industrial $8 $ per Mcf $6 $4 $2 $ Source: Energy Information Administration, Department of Energy
48 Estimated Expenditures on Natural Gas by Selected Industrial Sectors in Louisiana (2002) Estimated Percent of Natural Gas Total Energy SIC Expenditures Expenditures ($) (%) 20 Food and Kindred Products $ 17,252,320 46% 22 Textile Mill Products $ 3,565,055 40% 23 Apparel & Textile Products $ 54,465 11% 24 Lumber and Wood Products $ 10,448,491 39% 26 Paper and Allied Products $ 88,336,715 19% 27 Printing & Publishing $ 141,937 6% 28 Chemicals and Allied Products $ 1,828,571,137 61% 29 Petroleum and Coal Products $ 220,698,192 35% 30 Rubber & Misc. Plastic Prods. $ 880,450 3% 31 Leather & Leather Products $ - 0% 32 Stone, Clay & Glass Products $ 9,907,030 58% 33 Primary Metal Industries $ 11,033,333 21% 34 Fabricated Metal Products $ 2,815,290 39% 35 Machinery & Computer Equip. $ 664,405 15% 36 Electric & Electronic Equip. $ 1,527,169 3% 37 Transportation Equipment $ 4,887,193 22% 38 Instruments & Related Products $ 16,716 24% 39 Misc. Manufacturing Industries $ 7,318 22% Source: Major Industrial Plant Database, IHS Energy

49 Price Outlook
50 Forecast for Energy Commodity Prices Natural Gas Futures $16 $ Actual Futures $12 $10 $ per Mcf $8 $6 $4 $2 $0 Nov Dec Jan Feb Mar Apr May Jun Jul Aug Sep Oct Note: Prices recorded on October 11, 2005 Source: Federal Reserve Bank of St. Louis; and Nymex.com
51 Forecast for Energy Commodity Prices Heating Oil Futures $ $ $ per Mcf $ $ $50.00 $0.00 Nov-05 Dec-05 Jan-06 Feb-06 Mar-06 Apr-06 May-06 Jun-06 Jul-06 Aug-06 Sep-06 Oct-06 Note: Prices recorded on October 11, 2005 Source: Energy Information Administration, Department of Energy; and Nymex.com
52 Industrial Natural Gas Usage, Expenditures and Taxes Estimated Estimated Taxable Estimated Sector Usage Natural Gas Usage Natural Gas Expenditures Natural Gas Taxes Shares (%) (MMcf) ($ 000) ($ 000) 20 Food and Kindred Products 0.8% 6,513 6,578 $ 86,132 $ 67,259 $ 3,273 $ 2, Textile Mill Products 0.2% 1,346 1,359 $ 17,798 $ 13,898 $ 676 $ Apparel & Textile Products 0.0% $ 272 $ 212 $ 10 $ 8 24 Lumber and Wood Products 0.5% 3,944 3,984 $ 52,164 $ 40,734 $ 1,982 $ 1, Paper and Allied Products 4.0% 33,347 33,680 $ 441,014 $ 344,382 $ 16,759 $ 13, Printing & Publishing 0.0% $ 709 $ 554 $ 27 $ Chemicals and Allied Products 83.0% 689, ,629 $ 7,705,935 $ 6,017,476 $ 292,826 $ 228, Petroleum and Coal Products 10.2% 84,390 85,234 $ 1,116,061 $ 871,519 $ 42,410 $ 33, Rubber & Misc. Plastic Prods. 0.0% $ 4,396 $ 3,432 $ 167 $ Stone, Clay & Glass Products 0.4% 3,740 3,777 $ 49,460 $ 38,623 $ 1,879 $ 1, Primary Metal Industries 0.5% 4,165 4,207 $ 55,084 $ 43,014 $ 2,093 $ 1, Fabricated Metal Products 0.1% 1,063 1,073 $ 14,055 $ 10,976 $ 534 $ Machinery & Computer Equip. 0.0% $ 3,318 $ 2,591 $ 126 $ Electric & Electronic Equip. 0.1% $ 7,624 $ 5,954 $ 290 $ Transportation Equipment 0.2% 1,845 1,863 $ 24,399 $ 19,053 $ 927 $ Instruments & Related Products 0.0% 6 6 $ 84 $ 65 $ 3 $ 2 39 Misc. Manufacturing Industries 0.0% 3 3 $ 37 $ 29 $ 1 $ 1 Total 100.0% 831, ,641 $ 9,578,541 $ 7,479,772 $ 363,985 $ 284,231
53 Energy Market Outlook Fall Signal Winter Signal Overall 6 Months (Sep-Oct) (Nov-Mar) Bullish, weather and supply concerns Bullish, weather and supply concerns -- daily super spikes probable Bullish, low injections set up chornic tight market conditions -- potential lows going into next injection season. Range: Range: Range: Short term (September-October) weather futures prices are bullish for natural gas in the South and West, but neutral in the East and Midwest Forecast of $58 to $70 crude through the end of Refining capacity challenges will keep pressure on prices. Diminishing natural gas surpluses especially in the aftermath of Katrina and Rita. Storage forecasts call into question the supply adequacy heading into the winter season given our preliminary winter assessments. Katrina and Rita impacts felt until next hurricane season.
54 November March HDD Seasonal Strips % Difference 10 Year from 10-Year City Market Average Average Atlanta % Boston % Cleveland Cincinnati % Denver Dallas % Houston % Kansas City % Tuscon % Source: First Enercast Financial
55 November March HDD Forecast % Difference 10-Year from 10-Year Region Market Average Average Northeast % Midwest % South % West % Average % Source: First Enercast Financial

56 Future CES Events to Note
57 Questions, Comments, & Discussion