A Tiered Response to Climate Adaptation
|
|
|
- Francine Gray
- 5 years ago
- Views:
Transcription
1 Climate Change and Water Utilities Workshop January 19 20, 2009 Madrid, Spain A Tiered Response to Climate Adaptation Nancy Ahern Seattle Public Utilities Seattle, WA USA nancy.ahern@seattle.gov
2 Purpose of Briefing Brief background on Seattle Projected impacts on water supply and drainage in the Seattle area Approaches to enhance adaptation and coping capacities Broader application
3 Mitigation and Adaptation Greenhouse gas (GHG) mitigation can avoid, reduce or delay the impacts of climate change Some impacts are unavoidable due to past emissions, hence the need for adaptation Complementary approaches to a comprehensive climate strategy: Mitigation limits the magnitude of climate change Adaptation limits the impacts of climate change A portfolio of adaptation and mitigation measures can diminish the risks associated with climate change - Intergovernmental Panel on Climate Change, 2007

4 Location Seattle Washington - 13th most populous state 3750 kms Washington DC

5 Greater Seattle Region million Seattle proper - 600,000 Moderate growth, high tech, service, manufacturing, trade Wet and grey winters, typically dry summers


6 Location: Seattle s Water System S. Fork Tolt River Cedar River Responsibilities: Retail and wholesale water to 1.4 million people Instream flows for salmon habitat in perpetuity Flood management Hyrdopower generation Asset replacement value: $3-4 billion Mountain-based surface water supplies, nominal groundwater Largest supply is unfiltered Rely on snowpack and rain, may be more dependent on rain than snow

7 Background and Context: Chester Morse Lake Reservoir The acre Cedar River watershed supplies the majority of Seattle s water demand. Snowpack accumulation above elevation 2500 feet averages about 30 inches of snow water equivalent each year Chester Morse Lake Reservoir at elevation 1560 feet receives about 100 inches of precipitation each year Adapted From: SPU Archives

8 Official Demand Forecast
9 Climate Vulnerability is a function of: Nature of supply and demand Behavioral & sociological LOCATION Location specific Impacts assessment AND CAPACITY TO COPE Local impacts Institutional Technological Technical Operational & structural Political Legal & financial


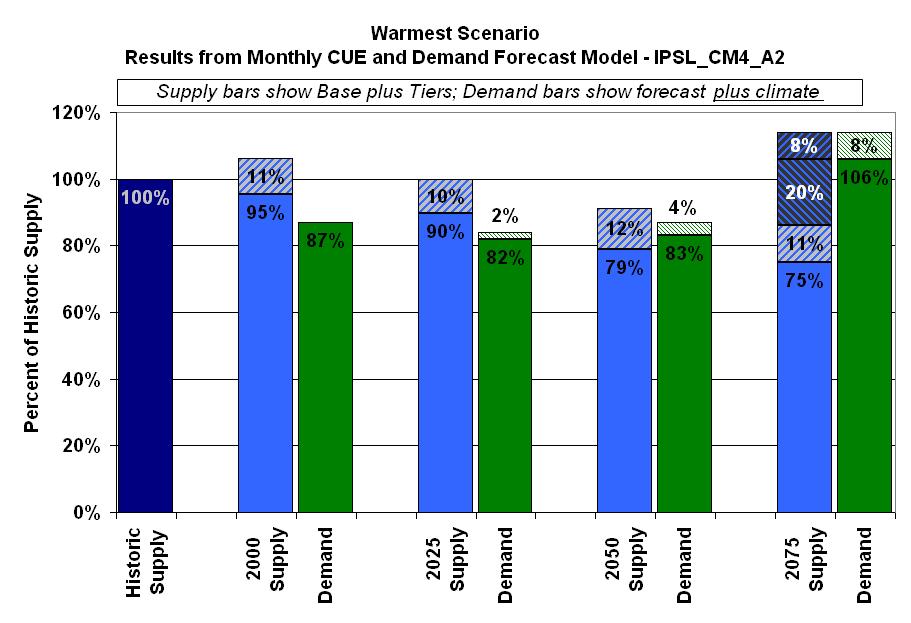
10 Regional Climate Impacts Downscaled GCM outputs to regional scale 3 Climate Change Scenarios for 2000, 2025, 2050, 2075: Warm: GISS_ER-B1 Warmer: Echam5-A2 Warmest: IPSL_CM4-A2 Temperature Warming trend, primarily in winter and summer Average warming is generally 1 C per 25-year period Precipitation Less agreement between models than there is with temperature In general, more precipitation in winter, less in summer Hydrology Shift towards higher winter flows and lower spring/early summer flows Subsituted future hydrology for historic in SPU s systems models
11

12
13 Portfolio of Adaptation Options Portfolio of options instead of single, large projects Identify system operation and non structural modifications before new supply Grouped options into tiers. Tiers are dynamic; will change and evolve. Increase in risk and level of investment.
14 Tier 1 Modifications Refill Chester Morse Lake 1 m higher Adds 12% more useable storage Raise Overflow Dike to 1.2m Reduces seepage losses New project under development Lake Youngs model 1.5m of storage Current practice but not modeled Adds 7% more useable storage Drawdown Tolt additional 6 m Adds 18% more useable storage Low cost, first step actions Enhance flexibility, operational capacity of current assets and infrastructure to reflect dynamic conditions Offset loss of storage from reduced snowpack by accessing more reservoir storage
15 Technical Options: Tier 1 Modifications Cedar River Increased storage design: 1570' 1563' 1560' Maximum Elevation Chester Morse Lake 5966 Acre - Feet Higher refill Reduced seepage Refill to 1563 m Current practice but 1560 used for firm yield 12% more useable storage 1550' 1554' <1532 Dead Storage Masonry Dam Overflow Dike
16 Technical Options: Tier 1 Modifications - Tolt River Increased storage design: 1765' South Fork Tolt Reservoir Lower drawdown Draw down to 1690 Currently 1710 used for firm yield 18% more useable storage 1710' 7517 Acre - Feet 1690' 1660 Lowest Intake Level
17 Next Tiers Available to SPU Tier 2 Next Tier of Intra-System Modifications Include additional use of Lake Youngs Storage Modified/optimized conjunctive use operations Additional conservation programs after 2030 Tier 3 Greater Use of Storage Higher refill levels at Chester Morse Lake Higher flood pool level at CML (assumes max level increased to 1575) Tier 4 New Supply Alternatives Deeper drawdown of South Fork Tolt reservoir Deeper drawdown of Lake Youngs, Cedar Filtration Use of Dead Storage for normal supply, after pumping plant replacement Develop North Fork Tolt Diversion Develop Snoqualmie Aquifer Project Northshore and Woodinville develop Weyerhaeuser/Everett supply Reclaimed water projects in Retail Service Area Additional conservation programs Tier 5 New Supply Concepts Reclaimed water projects in Wholesale Service Area Desalination plant Higher refill levels at Tolt reservoir (raising ring gate) Etc.
18

19
20

21 A Tale of Two Storms: 1 hr precip
22
23 Drainage Workshop Purpose hear from researchers and practitioners about how they re approaching drainage adaptation 100 attendees Participants from UK, Netherlands, NYC, SF, Vancouver, Chicago and local cities
 Dual Infrastructure that serves multiple functions (roads & parks as storage) Public engagement Planning with uncertainty Integration of flood control & water")
24 Drainage Workshop: Themes Capacity building (physical and institutional), enhancing resiliency We can t build our way out of this challenge Portfolio approach (structural vs. non-structural approaches) Dual Infrastructure that serves multiple functions (roads & parks as storage) Public engagement Planning with uncertainty Integration of flood control & water quality; use of LID/BMPs

25


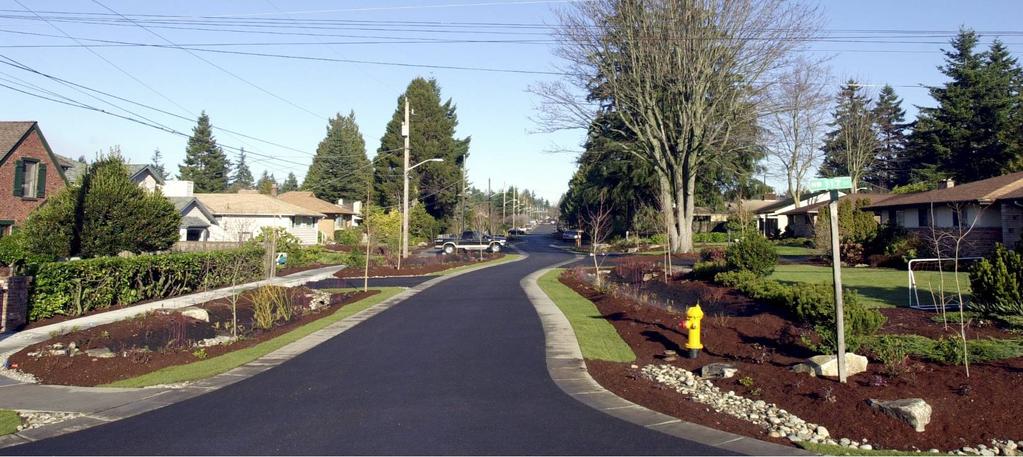
26 Portland s s Green Street Demonstration Projects: NE Siskiyou Green Street SW 12 th Avenue Green Street Glencoe Elementary Raingarden Others Drawn by: Kevin Perry April 27, 2005
27 Multiple Adaptation Realms Operational and Structural Behavioral/sociological Technological Political Technical/Research Legal/Financial Institutional
28 Operational and Structural Traditional domain, focus of utilities Optimize system operations to enhance flexibility Modify infrastructure to reflect changing conditions But..Can t always build your way out of the problem
29 Behavioral/Sociological: Conservation Since mid 80 s: Population up, consumption down ~ 25% Significant reductions in water use 44 mgd of savings since 1980 Another 15 mgd of savings through 2030 Delayed impacts of climate change Flood Response/Preparedness 1,400,000 1,400,000 1,300,000 1,300,000 Growth in Population and Water Consumption Growth in Population and Water Consumption Seattle Regional Water System: Seattle Regional Water System: ,200,000 1,200,000 Population ,100,000 1,100,000 Population ,000,000 1,000, , ,000 Water Consumption Total Consumption , ,000 Non-Revenue , , , , , , , ,000 Billed Consumption , , Since the peak in 1984, total consumption has 200, , fallen 27% while population has grown by 25%. 100, , Population Water Consumption in MGD

30 Technological: Urban water as supply Use of rain, storm, grey and waste water is emergent Opportunities for integrated water management High quality drinking water used for non-potable purposes ~ 50% + Too much water in urban environment during winter, flooding problems Interest amongst early adopters in design and developer community Gates Foundation liter cistern, use rainwater to flush 100+ toilets


31 Political: Collaboration and Leverage (EU)
32 Technical: Research Water Research Foundation Developing multi-year climate research program for water sector Initial focus: vulnerability assessments, information clearinghouse, impacts on demand Water Environment Research Foundation Focus on stormwater & wastewater Potential collaboration with two EU research proposals Water supply and sanitation Urban flood management Need for collaborative partnerships between utilities and researchers
33 Legal & Financial: Buying Efficiency and Certainty Pricing strategies Seattle has tiered rate structure, the more one consumes the more one pays Also seasonal rates, water is more expensive in the dry summer than wet winter Sewer rates tied to water consumption, much more expensive, reduce water use also reduce sewer bill Southern NV Water Authority (Las Vegas) Pay $2 per square foot of turf/grass removed Melbourne Water & Victorian Government Offering to invest in agriculture efficiency 1/3 of savings stay with farmer, 1/3 goes to Melbourne Water, 1/3 to environment Certainty Seattle settled historic and future claims with Muckleshoot Indian Tribe
34 Institutional: Enhancing our Knowledge Base Building/joining network of utilities and researchers working on climate change Building internal capacity to understand technical/policy implications of climate change Tapping into network to incorporate info. into internal decision-making and planning Non-structural implies new mindset, potentially new skills
35 Conclusions/Broader Application Climate impacts are region-specific, but adaptation approaches can be shared Need an expanded concept of what constitutes adaptation Political support and capacity building essential Opportunity to network among utilities/jurisdictions to share experiences Need accessible and reliable sources of data

36 Managing in Uncertainty

37 Thank You