Summary for Policymakers Climate Change 2007: The Physical Science Basis
|
|
|
- Daniela Gordon
- 5 years ago
- Views:
Transcription


1 Summary for Policymakers Climate Change 2007: The Physical Science Basis Robert Sausen DLR-Institut für Physik der Atmosphäre Oberpfaffenhofen

2 Guidance Notes for Lead Authors of the IPCC Fourth Assessment Report on Addressing Uncertainties
3
4
5
6 WG I: Summary for Policymakers Drafting Authors Richard B. Alley, Terje Berntsen, Nathaniel L. Bindoff, Zhenlin Chen, Amnat Chidthaisong, Pierre Friedlingstein, Jonathan M. Gregory, Gabriele C. Hegerl, Martin Heimann, Bruce Hewitson, Brian J. Hoskins, Fortunat Joos, Jean Jouzel, Vladimir Kattsov, Ulrike Lohmann, Martin Manning, Taroh Matsuno, Mario Molina, Neville Nicholls, Jonathan Overpeck, Dahe Qin, Graciela Raga, Venkatachalam Ramaswamy, Jiawen Ren, Matilde Rusticucci, Susan Solomon, Richard Somerville, Thomas F. Stocker, Peter A. Stott, Ronald J. Stouffer, Penny Whetton, Richard A. Wood, David Wratt Draft Contributing Authors J. Arblaster, G. Brasseur, J.H. Christensen, K.L. Denman, D.W. Fahey, P. Forster, E. Jansen, P.D. Jones, R. Knutti, H. Le Treut, P. Lemke, G. Meehl, P. Mote, D.A. Randall, D.A. Stone, K.E. Trenberth, J. Willebrand, F. Zwiers
7 Human and Natural Drivers of Climate Change Global atmospheric concentrations of carbon dioxide, methane and nitrous oxide have increased markedly as a result of human activities since 1750 and now far exceed pre-industrial values determined from ice cores spanning many thousands of years. The global increases in carbon dioxide concentration are due primarily to fossil fuel use and land use change, while those of methane and nitrous oxide are primarily due to agriculture.


8 Atmospheric concentrations of CO 2, CH 4 and N 2 O
9 Human and Natural Drivers of Climate Change The understanding of anthropogenic warming and cooling influences on climate has improved since the TAR, leading to very high confidence that the global average net effect of human activities since 1750 has been one of warming, with a radiative forcing of +1.6 [+0.6 to +2.4] W m 2 (see Figure SPM.2).


10 Radiative forcing components
11 Direct Observations of Recent Climate Change Warming of the climate system is unequivocal, as is now evident from observations of increases in global average air and ocean temperatures, widespread melting of snow and ice, and rising global average sea level (see Figure SPM.3).
 global average surface temperature, (b) global average sea level from tide gauge (blue) and satellite (red) data and (c) Northern Hemisphere snow cover for March- April.")
12 Observed changes in global average surface temperature, global average sea level and Northern Hemisphere snow cover for March- April. Figure SPM.3. Observed changes in (a) global average surface temperature, (b) global average sea level from tide gauge (blue) and satellite (red) data and (c) Northern Hemisphere snow cover for March- April. All changes are relative to corresponding averages for the period Smoothed curves represent decadal average values while circles show yearly values. The shaded areas are the uncertainty intervals estimated from a comprehensive analysis of known uncertainties (a and b) and from the time series (c)

13 Observed rate of sea level rise and estimated contributions from different sources.
14 Direct Observations of Recent Climate Change At continental, regional and ocean basin scales, numerous long-term changes in climate have been observed. These include changes in arctic temperatures and ice, widespread changes in precipitation amounts, ocean salinity, wind patterns and aspects of extreme weather including droughts, heavy precipitation, heat waves and the intensity of tropical cyclones.
15 Recent trends, assessment of human influence on the trend and projections for extreme weather events
16 Direct Observations of Recent Climate Change Some aspects of climate have not been observed to change. Diurnal temperature range (DTR) Antarctic sea ice extend Meridional overturning circulation (MOC) of the global ocean
17 A Palaeoclimatic Perspective Palaeoclimatic information supports the interpretation that the warmth of the last half century is unusual in at least the previous 1,300 years. The last time the polar regions were significantly warmer than present for an extended period (about 125,000 years ago), reductions in polar ice volume led to 4 to 6 m of sea level rise.
18 Understanding and Attributing Climate Change Most of the observed increase in global average temperatures since the mid-20th century is very likely due to the observed increase in anthropogenic greenhouse gas concentrations. This is an advance since the TAR s conclusion that most of the observed warming over the last 50 years is likely to have been due to the increase in greenhouse gas concentrations. Discernible human influences now extend to other aspects of climate, including ocean warming, continental-average temperatures, temperature extremes and wind patterns (see Figure SPM.4 and Table SPM.2).

19
20 Recent trends, assessment of human influence on the trend and projections for extreme weather events
21 Understanding and Attributing Climate Change Analysis of climate models together with constraints from observations enables an assessed likely range to be given for climate sensitivity for the first time and provides increased confidence in the understanding of the climate system response to radiative forcing. Likely range for CO 2 doubling: K. Best estimate for CO2 doubling: 3 K. Very unlikely that value is less than 1.5 K, values higher than 4.5 K cannot be excluded. It is very unlikely that climate changes of at least the seven centuries prior to 1950 were due to variability generated within the climate system alone.
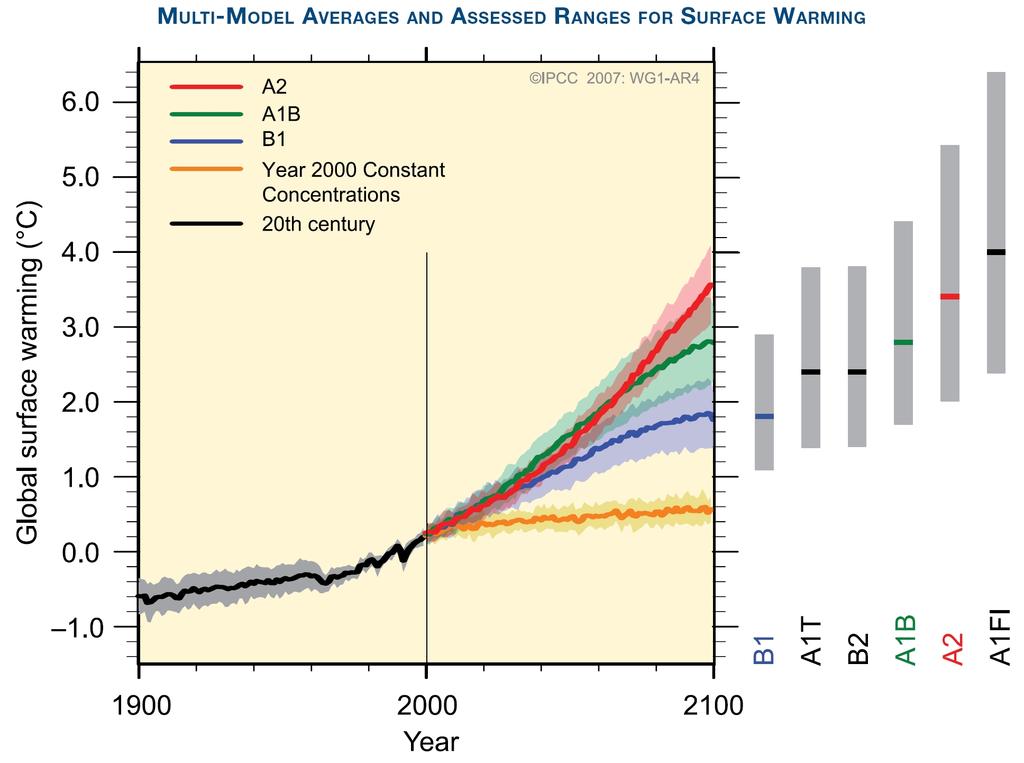
22 Projections of Future Changes in Climate For the next two decades, a warming of about 0.2 C per decade is projected for a range of SRES emission scenarios. Even if the concentrations of all greenhouse gases and aerosols had been kept constant at year 2000 levels, a further warming of about 0.1 C per decade would be expected.
23 Projections of Future Changes in Climate Continued greenhouse gas emissions at or above current rates would cause further warming and induce many changes in the global climate system during the 21st century that would very likely be larger than those observed during the 20th century.

24 Recent trends, assessment of human influence on the trend and projections for extreme weather events
25
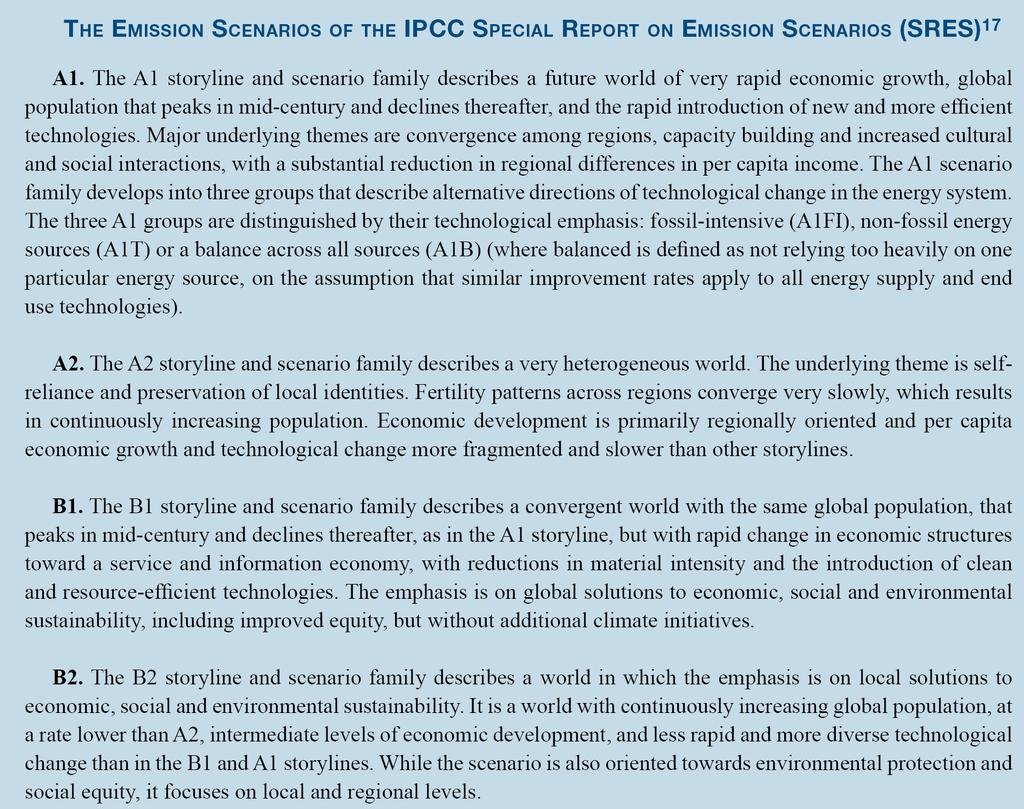
26 SRES scenarios: CO 2 emissions IPCC, TAR TS Fig 17

27 Projected global average surface warming and sea level rise at the end of the 21st century.
28
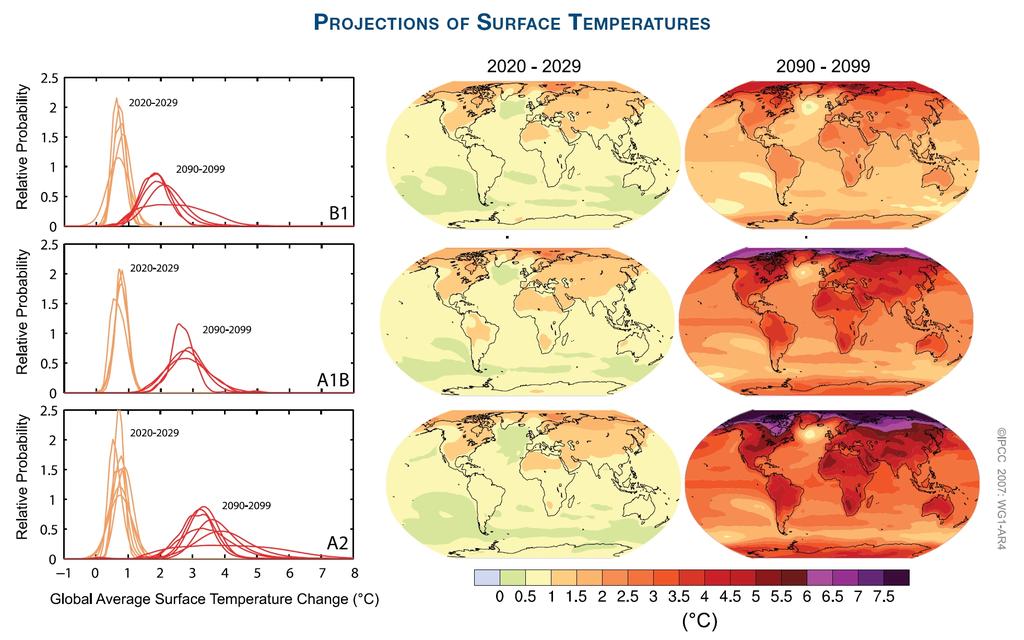
29 Projections of Future Changes in Climate There is now higher confidence in projected patterns of warming and other regional-scale features, including changes in wind patterns, precipitation and some aspects of extremes and of ice.

30

31
32 Projections of Future Changes in Climate Anthropogenic warming and sea level rise would continue for centuries due to the time scales associated with climate processes and feedbacks, even if greenhouse gas concentrations were to be stabilised.
33 Nächste Vorlesungen SPM WG II: Impacts, Adaptation and Vulnerability SPM WG III: Mitigation of Climate Change PDF-Version der Vorlesung: