GIS Assessment of Acid Mine Drainage from the Big Brown Mine, Freestone County, TX. by Julie Fryman. Term Project
|
|
|
- Carmella Hunter
- 5 years ago
- Views:
Transcription
1 GIS Assessment of Acid Mine Drainage from the Big Brown Mine, Freestone County, TX by Julie Fryman Term Project The University of Texas at Austin December 5, 2013
2 Problem Recently Luminant Mining, operator of eight of the 20 coal mines in Texas, announced the possibility of bankruptcy next year (2014). This caused concern at the Texas Railroad Commission, regulators of coal mining, because Luminant Mining is on the hook to cover around $1billion to restore Texas land damaged by strip mining. One of these mines is the Big Brown Mine (BBM) located in Freestone County, just north of Fairfield, TX. Acid mine drainage from this mine directly affects the Carrizo Aquifer system, a major Texas aquifer that spans from the northeastern Piney Woods to the southwestern Texas-Mexico border. Acid mine drainage (AMD) is characterized by low ph and high concentrations of heavy metals and other toxic elements and can severely contaminate surface and groundwater, as well as surrounding soils. Waste rocks containing sulfides are a significant source of AMD, which makes management of waste dumps of utmost importance. What cities are at greater risk of groundwater contamination if the remediation of the mine is delayed? How far does this hazard zone extend away from the Big Brown Mine? Goal This project aims to provide visual representation of the groundwater solute transport through the Carrizo aquifer from the Big Brown Mine. This visualization can then be used to assess city usage in potential hazard zones and the extent within the aquifer the mine s drainage currently reaches. Arsenic -a common element found in AMD- will serve as a reference solute to track diffusion and dispersion within the aquifer. Data Sources 1) Texas Water Development Board: Major Aquifers shapefile, Major Rivers shapefile and Texas hillshade 2) National Atlas GIS: Highly Populated cities (current data release 2004) 3) Environmental Protection Agency (EPA)- TRI Explorer: Facility chemical report, Big Brown Mine 4) Sharp, J.M. Jr, 2013, Groundwater Hydrology Dispersion formula, Groundwater arsenic standards (Texas shapefile from Lab_1_data folder>texas_data>usgs_geology) *Hydraulic properties of aquifer determined for Groundwater Hydrology term paper, accepted and approved by Dr. Jack Sharp, UT Austin. Fryman 2

3 Procedure No data pre-processing was needed to begin this project. The first step was to determine the exact coordinates of the Big Brown Mine in Fairfield, TX. This was done with Google Maps using the coordinates to create a spatially accurate polygon for the ArcMap. As seen in Figure 1, dropping a pin allows you to view the latitude and longitude at this point. Figure 1. Using Google Satellite image to mark off Big Brown Mine area The original ArcMap began with simply the Texas shapefile and the shapefile of the Major and Minor Aquifer systems of Texas (Figure 2.1). The Big Brown Mine directly overlays the Carrizo Regional Aquifer System, so this aquifer is of great significance. To isolate this one aquifer the others were selected with the Editor toolbar and removed to focus the map appropriately (Figure 2.2). Fryman 3
: Carrizo isolated to be become only aquifer on map Because the area and exact")

 to create the mine area polygon")
4 Figure 2.1 (left): shapefile of Texas aquifers Figure 2.2 (right): Carrizo isolated to be become only aquifer on map Because the area and exact location of the mine are essential to this project, a polygon was created in a new Personal Geodatabase to represent the BBM. The polygon was made by marking off the vertices with the Absolute X,Y function. Each Latitude and Longitude was manually input (6 points total) to create the mine area polygon (Figure 3). Figure 3. Creating polygon vertex with right click>absolute X,Y and inputting mine area outline coordinates. Fryman 4

5 Off the computer, manual calculations were needed to estimate the hydraulic properties of the Carrizo and how solutes (such as AMD) disperse within it. Through thorough research it was determined that the Carrizo aquifer has a transmissivity of 300 sq.ft/day, a recharge rate of 4 in/yr in the NE section, and a specific storage of 4.5e-6 (dimensionless). A facility report was then run using the Environmental Protection Agency s TRI Explorer to determine the amount of arsenic disposed of by the BBM operators per year (Figure 4). Figure 4. Report generated by EPA for facilities in all industries, for all chemicals in Freestone Co, TX (2012). The Big Brown Mine Facility has an onsite disposal rate of 10, lbs of arsenic per year. With the recommended maximum values from the EPA for concentrations of arsenic in drinking water (.05 mg/l), irrigation (.1 mg/l), and livestock (.2 mg/l), all of the variables needed calculate the extent the AMD reaches within the aquifer are now defined. Calculations Fick s First Law: J= -D( C/ x) Conversions were made as needed. This equation represents the arsenic concentration (mg/l) in the recharge over the transmissivity (sq.ft/yr), yielded a Fryman 5
 yields a distance away from the mine the constituents travel over a given time period.")
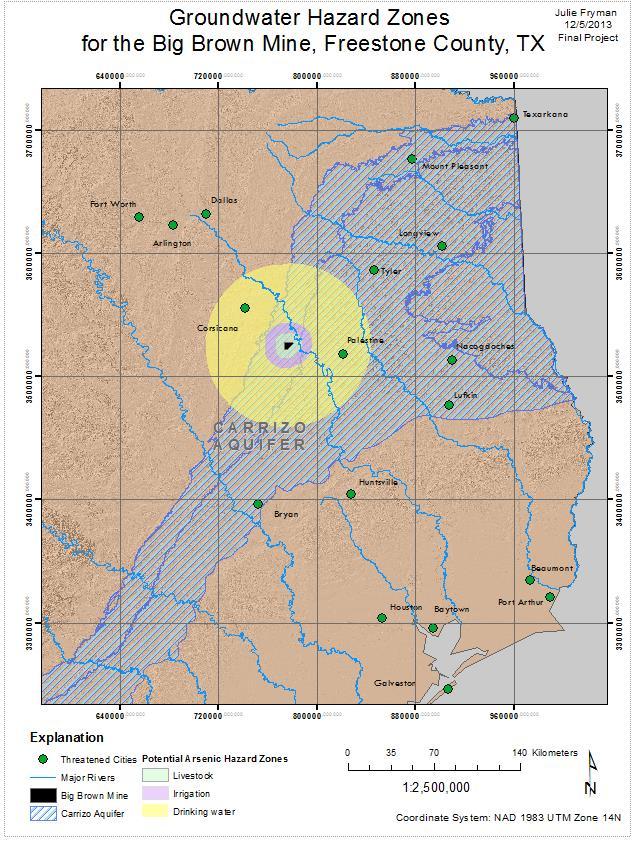
6 rate of dispersion of 6.83e5 mg L -1 ft -2. This value along with the recommended concentration values (stated above) yields a distance away from the mine the constituents travel over a given time period. With these values a buffer was generated around the outside of the mine polygon to represent the flow patterns/distances of arsenic transport. 5 years was used as a representative value for solute transport to be substantial enough to be useful as a visual aid. The dispersion rate, along with the recommended concentration values, yielded distances of the solute travel flowing away from the mine that were then transformed into buffer zones (Figure5). Figure 5. Multiple buffer rings generated around outside of mine, which geometry taken into consideration (hence oblong shapes) The rings were generated with the Multiple Ring Buffer tool with distances of (green), (purple), and sq.ft (yellow) as hazard zones for water usage for irrigation, livestock, and drinking water respectively. From here the population point data representing higher density cities was added and the cities with no usage relevance to this system were removed. The TCEQ Major Rivers Fryman 6

7 shapefile was then added to show the possible surface dispersion risk areas and their surrounding cities, generating the map below (Figure 6). Figure 6. Cities and rivers which directly correlate to the studied system added to assess risk areas. Conclusion The final map (see below) shows the area that will be directly affected by the absence of remediation if operations at the Big Brown Mine are delayed due to bankruptcy issues. If remediation is delayed, the strip mining waste rock will be exposed for longer than normal time periods and the sulfides will have more time to react with the air and precipitation, producing acid mine drainage with higher concentrations of harmful constituents. Currently the mine is effectively able to manage these chemicals while operations are continuing and there is no immediate threat to groundwater surrounding the well as all EPA standards have been met. This project visually represents the potential threat to the surrounding areas if these concentration levels change, on-site chemical Fryman 7

8 disposal increases, increased recharge occurs within and around the mine, or any combination of these scenarios. It is important for the cities highlighted on this map to be aware of the potential hazards and prepare a continuing risk assessment and management plan to be prepared for the possibility of these situations. Final map in full extent with area of interest boxed Fryman 8
9 Fryman 9