Coastal Defense and Climate Change An overview of NatCap work and a plea for help
|
|
|
- Jeremy Carson
- 5 years ago
- Views:
Transcription

1 Coastal Defense and Climate Change An overview of NatCap work and a plea for help Anne Guerry, Greg Guannel, Greg Verutes, Jess Silver, Joe Faries, Katie Arkema, Rob Griffin, Suzanne Langridge Annual Meeting and Training, Stanford, March 2013
2
3 NCA 2013
4 Persons per Square Mile Population Density Coastal Watershed Counties Inland Counties US NOAA, State of the Coast
5
6
7

8 Are natural habitats providing protection now? What level of protection do different types/arrangements of habitats provide? Will conservation/restoration of habitats provide adequate protection? How does natural infrastructure compare with engineered infrastructure? How will habitats and their protective abilities be affected by climate change? Where should we restore and protect habitats to get maximal protection now and in the future?


9 Compare alternatives impacts on natural systems? strengths/weaknesses for natural hazard protection and adaptation to climate change? impacts on ES delivery now and under future climate? Net benefits of alternative adaptation investments within context of adaptation decisions
10


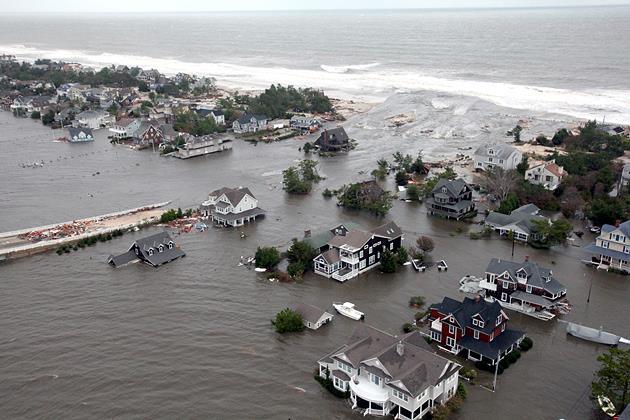
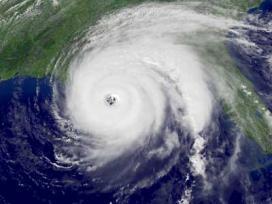
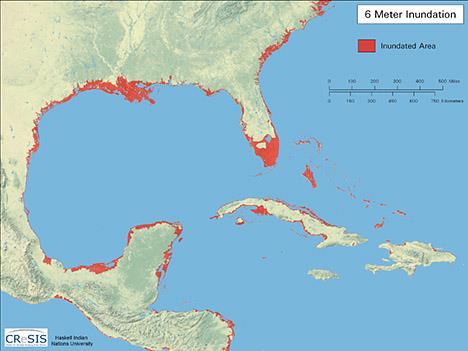
11 Where and to what extent do coastal ecosystems protect the most vulnerable human populations and highest value properties from sea level rise and storms?

12 Arkema et al. in review, Nature Climate Change

13 Arkema et al. in review, Nature Climate Change

14 Escambia Santa Rosa Okaloosa Walton Bay Wakulla Jefferson Taylor Baldwin Escambia Santa Rosa Okaloosa Walton Bay Gulf Franklin Wakulla Jefferson Taylor Dixie Levy Citrus Hernando Pasco Pinellas Hillsborough Manatee Sarasota Charlotte Lee Collier Monroe Gulf Franklin Dixie Levy Hernando Pinellas Citrus Pasco Hillsborough Manatee Sarasota Coastal Hazard Lowest Intermediate Highest Charlotte Lee Collier Population (thousands) Monroe
15
16 What is the value of coastal habitats in the region, now and under future climate? How do habitats compare to engineered solutions?
17


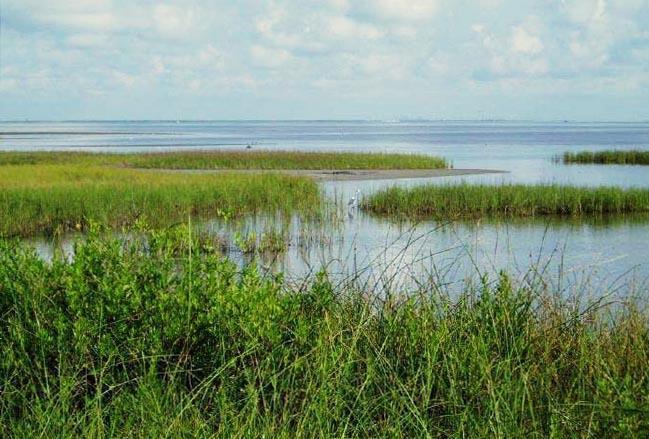
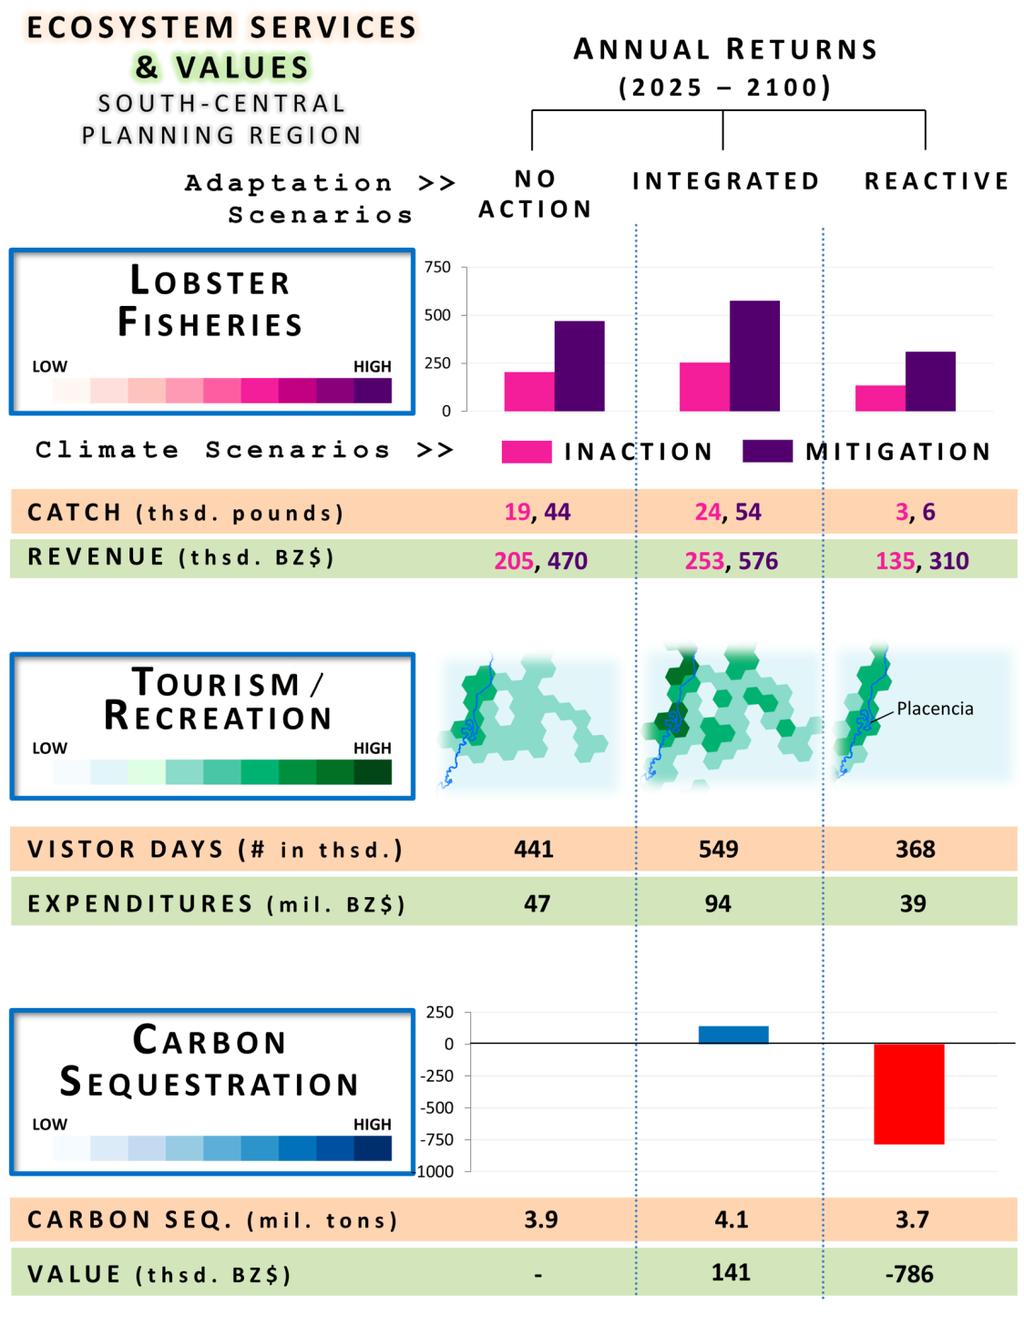
18 Lone Star Coastal National Recreation Area

19 Protection from storms, fisheries, recreation, and carbon storage and sequestration

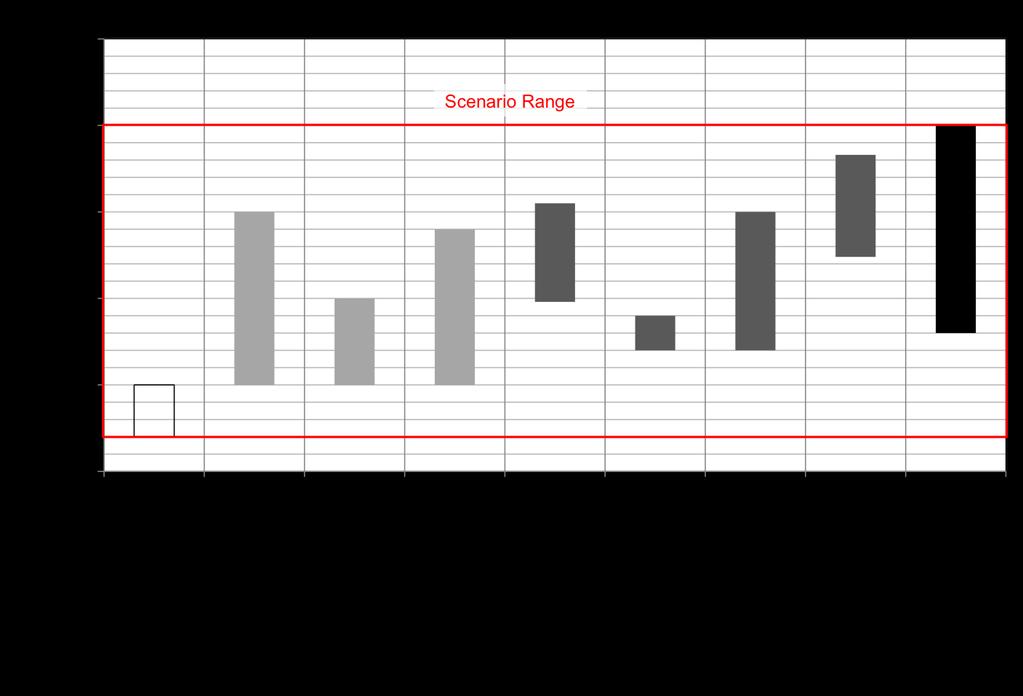
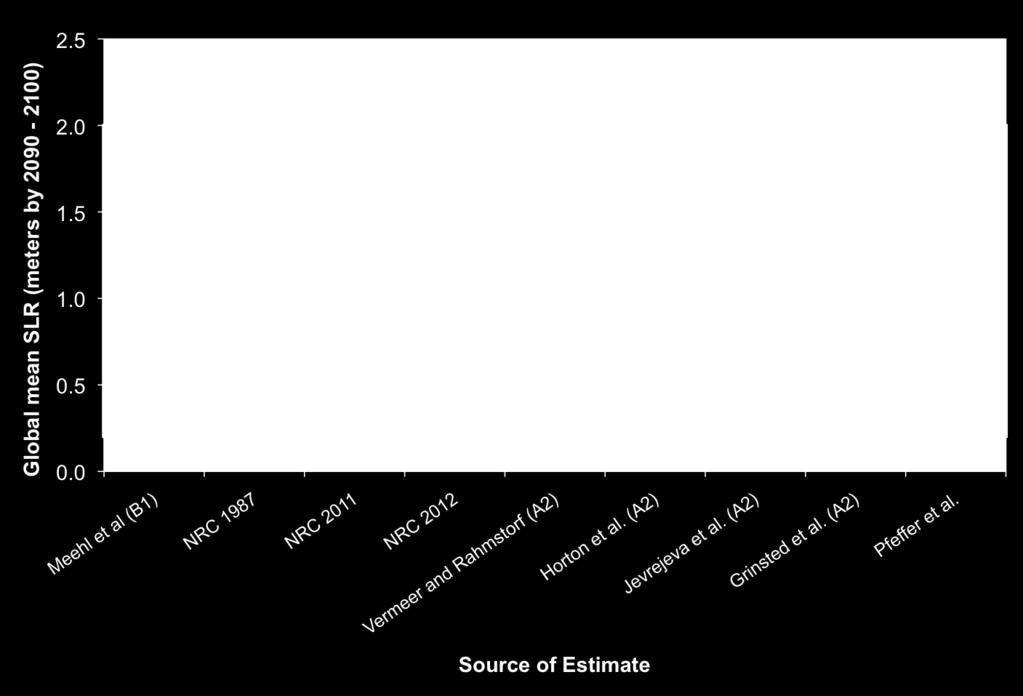
20 Increase in Wave Exposure 1m SLR 1.5m SLR
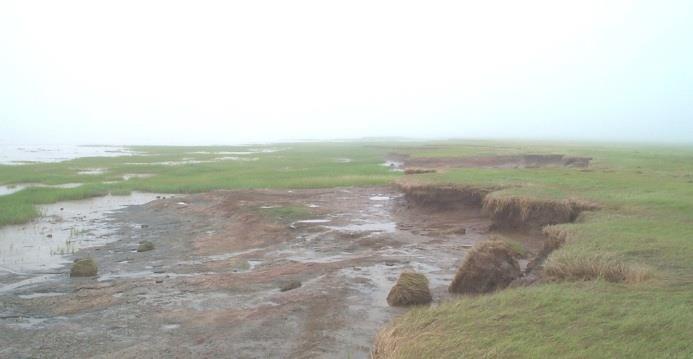
21 Oyster to The Rescue Erosion

22 Green/Grey or Green&Grey? Surge Height Levee Vegetati on Levee No Vegetation Seawall 1 m 0 m 0.43 m 2.0 m 2 m 0.4 mm 1 m 3.8 m
 m 2 m 0 (0.")
23 Green/Grey or Green&Grey? 0.5m SLR Surge Height Levee Vegetati on 1 m 0 (0.03) m 2 m 0 (0.2) mm Levee No Vegetation Seawall 0.19 m 2.3 m 1.4 m 4 m
24

25 Dow, Freeport, TX Stratton Ridge Largest Undeveloped Parcel Brazoria National Wildlife Refuge Plant B Oyster Creek San Bernard Wildlife Refuge Plant A Outside of levee system
 Biodiversity and ecosystem health What")
26 Coastal Analyses What will the future look like under different scenarios of management and climate? Natural hazard mitigation services Other coastal ecosystem services (fisheries, recreation, carbon storage & sequestration) Biodiversity and ecosystem health What are the costs and benefits of green and gray infrastructure options?
27 Dow Results Salt marsh restoration does not significantly reduce damages in this area to Dow or Freeport NPV of carbon sequestration is $30 million Recreation expenditures increase $130 million 12 fisheries benefit

28

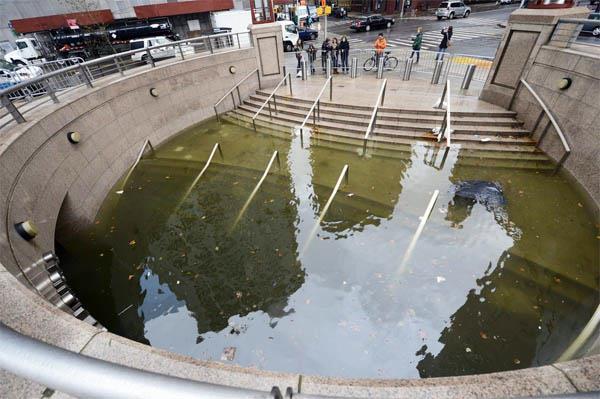
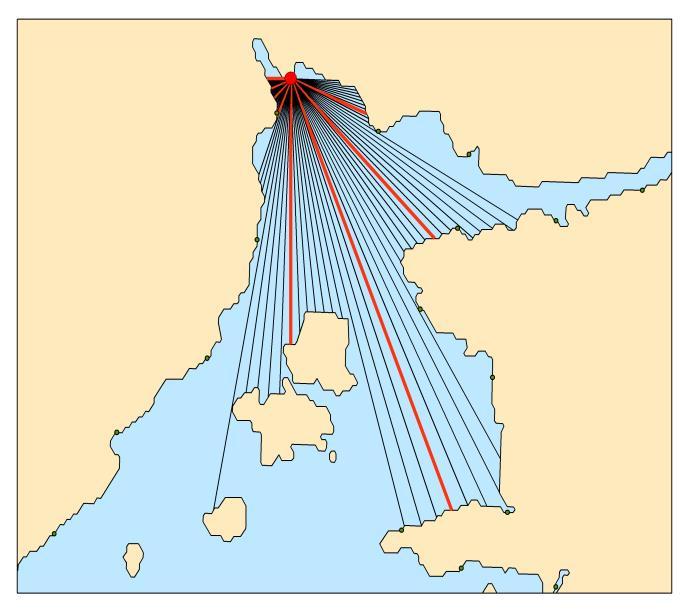
29 Where do habitats protect people and water infrastructure from sea-level rise?


30 Habitats decrease the vulnerability of people and water infrastructure to erosion and inundation hazards Coastal Vulnerability Habitat protection Vulnerability of the Santa Cruz coastline by Sea Level Rise People Pipes Habitat loss Water Infrastructure Where habitat reduces vulnerability in the highest vulnerability regions Coastal area at risk Percentage Habtat Protection Habitat Loss
31


32 What are the costs and benefits of alternative climate adaptation options? Green Grey Value suite of services Scenarios for climate change and adaptation options
33 Integrated Reactive Protection of coastal mangroves and littoral forest Some restoration of mangroves Establishment of MPAs Strategic construction of sea walls to avoid undeveloped and conservation areas and beaches that are used for tourism Construction of sea walls along all coastlines with development Some protection of mangroves and littoral forest
34


35 Adaptation Scenarios No Action Integrated Reactive NPV of total benefits $0.790 $1.300 $0.650 NPV Lobster fishing $0.008 $0.009 $0.006 NPV Tourism & recreation $0.782 $1.273 $0.702 NPV Carbon storage & sequestration - $ $0.061 NPV of total implementation costs -$ $ $0.191 NPV of erosion damages from sea level rise and storms -$ $ $2.005 Total NPV of all benefits, costs and damages -$ $ $1.550 NPV compared to No Action scenario - $0.456 billion $0.181 billion Arkema et al. report to IDB

36 Tools 1. InVEST coastal vulnerability model 2. InVEST coastal protection models 3. InVEST models for co-benefits 4. InVEST habitat climate adaptation tool
37 Coastal protection Forcing Conditions Waves Baseline tide Long-term sea-level rise Currents Wind Attenuation Biogenic habitat Abiotic morphology Hard structures Hydrodynamic Output Wave height Mean water level Runup Storm surge Erosion Flooding Near property and people


38 Coastal hazard index and data layers Sandy Beach 1 Rocky Coast 2 3 GEOMORPHOLOGY NATURAL HABITATS WIND EXPOSURE WAVE EXPOSURE RELIEF SEA LEVEL RISE
39 Offshore Beach Coastal protection 15 hrs Storm H max =1.5m T=4s Erosion Difference: 1.5m

40 Coastal protection NOT TO SCALE Avoided re-nourishment cost Avoided property damages Avoided people displaced

41 Habitat Climate Adaptation Tool Identify key climate change stressors that may affect marine habitats in a particular region Indicate relative vulnerability of current habitats to climate-change Produce future habitat footprints based on climaterelated changes in distribution
42 Tools for differing data availability Future habitat footprint Relative vulnerability index Global vulnerability Spatially explicit Predicts future habitat footprint Requires high quality data (DEM) Model specific to habitat and climate stressor Spatially explicit (some criteria) Predicts vulnerability of current habitat footprint Does not produce future habitat footprint Method easily generalizable to multiple habitats Not spatially explicit high-level, big picture tool Can be parameterized by the user without GIS layers Can qualitatively compare among regions, habitat types & climate stressors


43 Site applications for model dev t Marshes in Galveston Bay Mangroves in Belize

44 InVEST Habitat C.A.T A new footprint of future marsh habitat will be produced based on a sea-level rise scenario, tidal elevation and barriers to marsh migration. Inputs: ** Like SLAMM this analysis requires a high quality DEM.

45 InVEST Habitat C.A.T Step 1: Adjacent land use determines whether marshes can migrate inland based on a relative likelihood of migration. General Classification Marsh Migation Potential Developed Land 0.0 Example LULC included in this category Low-High intensity dev't, Multiple family dwelling units, etc. Water 0.0 Open water, Ocean, Bay Agriculture 0.3 Cultivated, etc. Bare Land 0.5 Forest 0.7 Freshwater Wetland Scrub/Shrub Wetland 1.0 Tidal Wetland 1.0 Bare land, Grassland, Open pasture, etc. Evergreen forest, Mixed forest, Deciduous forest Palustrine emergent wetland, Palustrine forested wetland 1.0 Scrub/shrub wetland Estuarine emergent wetland, irregularly & regularly flooded marsh, brackish wetland, etc. Schoreline 1.0 unconsolidate shoreline

46 InVEST Habitat C.A.T Step 2: Future tidal elevation will identify where marshes can grow given the new sea level.

47 InVEST Habitat C.A.T Step 3: Steps 1 and 2 combine to generate a new marsh footprint.


48 Social Metrics American Community Survey and Zillow Home Value Index Population Density Low High
49