Circuit Reliability Review
|
|
|
- Marvin Maxwell
- 5 years ago
- Views:
Transcription
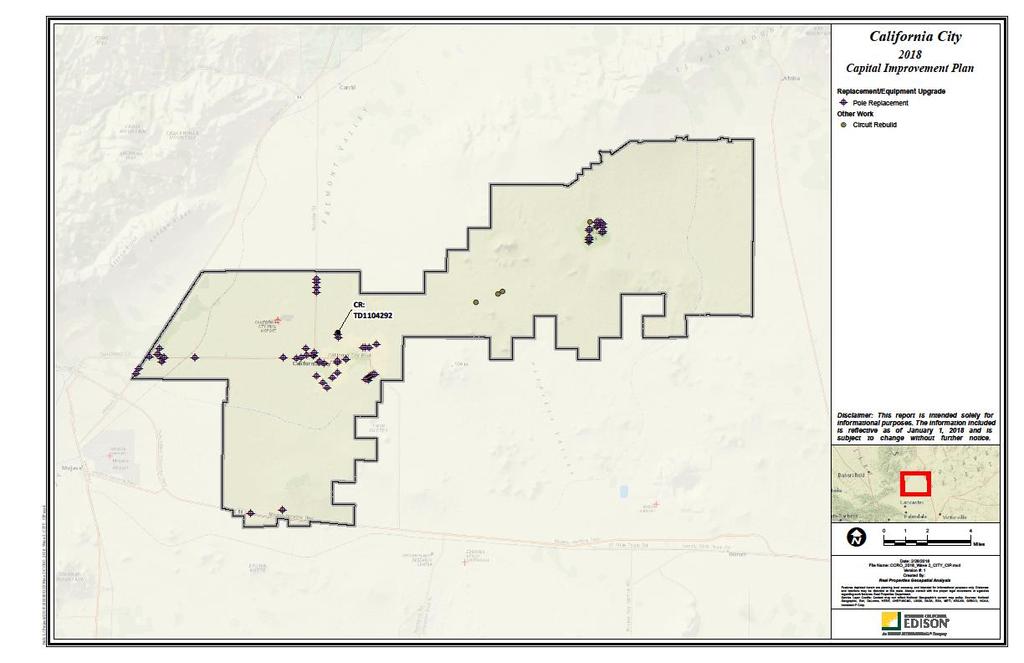
1 Circuit Reliability Review California City January 2018
.")
2 Building a Smarter Grid for Southern California Southern California Edison is developing an electric grid to support California s transition to a clean and sustainable future that meets the needs and expectations of our customers. We are investing more than $13 billion in the power distribution grid over three years ( ). Our main investment goal is to increase power reliability through significant upgrades. The investments include: Upgrading cables, poles, switches and transformers Updating the grid so it can accommodate new technologies, such as smart inverters that will allow for the twoway flow of solar energy Adapting the power system to accommodate future California policy related to energy storage, electric transportation and renewable energy Providing enhanced automation and monitoring devices to allow us to better respond to changes on the grid Our investments in local communities will help ensure that customers receive safe, reliable, and affordable electricity now and in the future. Learn more at edison.com/innovation 2
3 Understanding Your Reliability Report As your electric utility, we want you to always have power when you need it. To get there, we constantly track and monitor electric outages across our service territory, and we measure our system reliability from this data. The two metrics we rely on are common in the electric utility industry: the System Average Interruption Duration Index (SAIDI) and the System Average Interruption Frequency Index (SAIFI). Both are described in more detail on the next page. Replacing and upgrading our infrastructure will help SCE maintain or improve SAIDI and SAIFI measurements. This report provides historical reliability data for the circuits that serve your jurisdiction and our proposed infrastructure upgrades for the current year. To view other reliability reports, visit sce.com>outage Center>Maintaining Reliable Service 3
4 Reliability Metrics MOMENTARY OUTAGES: OUTAGES LASTING 5 MINUTES OR LESS SUSTAINED OUTAGES: OUTAGES LASTING LONGER THAN 5 MINUTES MAIFI: o The number of times the average customer is interrupted by Momentary outages each year. SAIFI: o The number of times the average customer is interrupted by Sustained outages each year. SAIDI: o The cumulative amount of time the average customer is interrupted by Sustained outages each year. 4
5 Cities in the RIDGECREST District CityList1 BORON CALIFORNIA CITY CANTIL CHINA LAKE ACRES EDWARDS AFB FURNACE CREEK HOMEWOOD CANYON-VALLEY WELLS INYOKERN JOHANNESBURG NORTH EDWARDS PEARSONVILLE RANDSBURG RIDGECREST SEARLES VALLEY DEATH VALLEY TIMBISHA SHOSHONE TRIBE 5

6 * Exclusions are days which utilities are allowed to remove from their metrics because the outages on those days were caused by a severe acts of nature. **In the columns showing Rank, lower numbers indicate poorer performance. 6
7 Overview of California City CircuitList1 There are 8 circuits that serve California City 1 Circuit Type Customers Circuit Type Customers Circuit Type Customers Circuit Type Customers BOXCAR(12KV) BRITTLE BUSH(12KV) 1, CASTLE BUTTE(33KV) DOGBANE(12KV) 1, GALILEO(12KV) GREASEWOOD(12KV) 1, HEAVY(33KV) OVERALL(12KV) 1, Grand Total 6,075 7
 3.0 2.5 2.0 1.5 1.0 0.5 0.0 1.9 2.0 1.0 0.9 1.8 2.8 1.1 1.2 SCE SYSTEMWIDE ** Exclusions are days which utilities are allowed to MAIFI (average frequency of momentary interruptions) 10.")
8 Reliability History of Circuits Serving California City (No Exclusions) BarChart SAIDI (average minutes of sustained interruptions) California City 0.0 SAIFI (average frequency of sustained interruptions) SCE SYSTEMWIDE ** Exclusions are days which utilities are allowed to MAIFI (average frequency of momentary interruptions) remove from their metrics because the outages on those days were caused by acts of nature. **Data is as of 02/20/2018, data can be slightly different due to outage data validation process 0.0 8
9 Causes of Repair Outages in California City 2017 SAIDIChart Vegetation /Animal 0.0% Weather /Fire /Earthquake 0.0% Contributions to SAIDI by Outage Cause 3rd Party 0.0% Operation 3.9% Equipment Failure e.g., in-service failure of transformer, switch, or conductors Vegetation/Animal e.g., tree branch, rodent, or bird causing a short circuit between conductors Other e.g., patrolled but no cause found Operations e.g., urgent maintenance w/o 3-day notice 3 rd Party e.g., balloon, car hit pole, dig-in Other 10.1% Equipment Failure 85.9% 3rd Party Equipment Failure Operation Other Vegetation /Animal Weather /Fire /Earthquake SAIDI = the cumulative amount of time the average customer is interrupted by sustained outages each year. 9
10 Causes of Repair Outages in California City 2017 SAIFIChart Vegetation /Animal 0.0% Weather /Fire /Earthquake 0.0% Contributions to SAIFI by Outage Cause 3rd Party 0.0% Equipment Failure e.g., in-service failure of transformer, switch, or conductors Vegetation/Animal e.g., tree branch, rodent, or bird causing a short circuit between conductors Other e.g., patrolled but no cause found Operations e.g., urgent maintenance w/o 3-day notice 3 rd Party e.g., balloon, car hit pole, dig-in Operation 11.7% Other 28.0% Equipment Failure 60.3% 3rd Party Equipment Failure Operation Other Vegetation /Animal Weather /Fire /Earthquake SAIFI = the number of times the average customer is interrupted by sustained outages each year 10

11 11
12 12
13 Back-up Slides Reliability Histories of Circuits Serving California City Updated through Dec 2017
14 Average Reliability of 8 Circuits Serving California City CitySummary st Qtr nd Qtr rd Qtr th Qtr SAIDI SAIFI MAIFI SAIDI SAIFI MAIFI SAIDI SAIFI MAIFI SAIDI SAIFI MAIFI SAIDI SAIFI MAIFI SAIDI SAIFI MAIFI SAIDI SAIFI MAIFI SAIDI SAIFI MAIFI 8 Circuits Serving California City -- Total Customers: 6, rd Party 64% 37% - 5% 18% - 23% 14% 3% - 0% 0% Equipment Failure 9% 6% 14% 21% 26% - 4% 2% 2% 99% 89% 15% 33% 18% 29% 56% 49% - 58% 58% 100% 86% 60% 24% Operation 1% 4% 0% 2% 1% 4% 23% 23% 8% 1% 11% 3% 9% 3% - 23% 44% - 42% 42% - 4% 12% 1% Other 17% 41% 63% 69% 43% 79% 31% 60% 87% % 59% 79% 60% 21% 7% 100% % 28% 69% Vegetation/Animal 0% 0% 18% 0% 0% 14% 10% 5% Weather/Fire/Earthquake 9% 12% 5% 3% 12% 2% 20% 1% 0% SCE SYSTEMWIDE Notes: No outages are excluded from the metrics. Outage Causes: Other: e.g., patrolled but no cause could be found Operations: e.g., urgent maintenance w/o 3-day notice to customers 3 rd Party: e.g., balloons, car hit pole, dig-in Vegetation/Animal: e.g., tree branch, rodent, or bird causing short circuit across conductors SAIDI (minutes) = the cumulative amount of time the average customer is interrupted by sustained (longer than 5 minutes) outages. SAIFI (interruptions) = the number of times the average customer is interrupted by sustained outages. MAIFI (interruptions) = the number of times the average customer is interrupted by momentary " (lasting 5 minutes or less) outages. 14
15 Reliability Histories for Individual Circuits Serving California City - 1 of st Qtr nd Qtr rd Qtr th Qtr SAIDI SAIFI MAIFI SAIDI SAIFI MAIFI SAIDI SAIFI MAIFI SAIDI SAIFI MAIFI SAIDI SAIFI MAIFI SAIDI SAIFI MAIFI SAIDI SAIFI MAIFI SAIDI SAIFI MAIFI BOXCAR(12KV) - Customers: CircuitHistory rd Party Equipment Failure 60% 25% 2% 20% 5% - 4% 4% 17% 100% 100% 100% % 5% - 100% 100% - 73% 46% 100% Operation 39% 74% 50% 90% 83% % 100% - 58% 95% 27% 54% - Other 1% 1% 33% 77% 36% 82% - - Vegetation/Animal % - Weather/Fire/Earthquake % 3% 59% 18% 46% 6% BRITTLE BUSH(12KV) - Customers: 1, rd Party 88% 28% - - Equipment Failure 10% 13% 20% 83% 99% - 30% 2% - 98% 90% 67% 88% 89% 56% - Operation 1% 3% - 17% 1% - 70% 98% - 2% 10% 12% % 100% - 2% 4% 4% Other 2% 56% 60% % % % 100% 100% 83% 33% 12% 100% % 39% 86% Vegetation/Animal % % 17% 10% Weather/Fire/Earthquake CASTLE BUTTE(33KV) - Customers: rd Party Equipment Failure % % 100% 33% 100% 100% % 50% - Operation % - Other 100% 100% 50% % % % 100% 100% 80% % 50% 88% Vegetation/Animal % % 20% 13% Weather/Fire/Earthquake 33% DOGBANE(12KV) - Customers: 1, rd Party 12% 45% - 23% 25% Equipment Failure 1% 0% - 12% 25% - 3% 0% - 97% 72% 25% 100% 100% 74% 100% 100% % 98% 80% 48% Operation 0% 0% - 33% 2% 27% 0% 0% - 3% 28% - - 2% 20% - Other 87% 55% 100% 32% 49% 65% 97% 100% 100% % % % - 52% Vegetation/Animal - 7% - - Weather/Fire/Earthquake 15
16 Reliability Histories for Individual Circuits Serving California City - 2 of 2 CircuitHistory st Qtr nd Qtr rd Qtr th Qtr SAIDI SAIFI MAIFI SAIDI SAIFI MAIFI SAIDI SAIFI MAIFI SAIDI SAIFI MAIFI SAIDI SAIFI MAIFI SAIDI SAIFI MAIFI SAIDI SAIFI MAIFI SAIDI SAIFI MAIFI GALILEO(12KV) - Customers: rd Party Equipment Failure % % 50% 28% 100% 100% % 50% - Operation % - Other 100% 100% 50% % 56% 50% 44% % 100% 100% 80% % 50% 88% Vegetation/Animal % 100% 100% 10% 20% 13% Weather/Fire/Earthquake 28% GREASEWOOD(12KV) - Customers: 1, rd Party % 97% 17% Equipment Failure 8% 8% 20% 56% 27% - 0% 0% - 100% 100% % % 67% - 73% 33% 23% Operation 0% 1% 6% 3% % 33% - 0% 0% - Other 36% 48% 60% 44% 73% 87% % % 100% 100% 56% % 67% 69% Vegetation/Animal % % 11% 8% Weather/Fire/Earthquake 55% 44% - - HEAVY(33KV) - Customers: rd Party 71% 75% - 2% 3% Equipment Failure % 45% 100% 100% 100% 100% 100% 100% 100% - 38% 24% 7% Operation Other % 48% 93% 100% 100% 100% - 100% 100% 100% 100% % 76% 93% Vegetation/Animal 29% 25% - 1% 3% 7% - - Weather/Fire/Earthquake OVERALL(12KV) - Customers: 1, rd Party 99% 100% - 50% 26% - 20% 1% - - 6% 1% Equipment Failure 1% 0% - 13% 25% - 0% 0% - 100% 100% 33% 100% 100% 100% 28% Operation % 0% Other % 49% - 79% 99% 100% % % % - 71% Vegetation/Animal - 100% - - Weather/Fire/Earthquake 16