Dead Lake DNR ID:
|
|
|
- Corey Hamilton
- 5 years ago
- Views:
Transcription
: 6,880 Lake Classification: Drainage lake % Littoral area: 91% Major Drainage Basin: Red River Max depth (ft): 61 Latitude/Longitude: 46.45833333/-95.")

1 East Otter Tail County Water Quality Factsheet Dead Lake DNR ID: Vitals Physical Characteristics MN Lake ID: Surface area (acres): 7,567 Zoning Authority: The City of Perham Littoral area (acres): 6,880 Lake Classification: Drainage lake % Littoral area: 91% Major Drainage Basin: Red River Max depth (ft): 61 Latitude/Longitude: / Mean depth (ft): 9 Water Body Type: Public Inlets/Outlets/Accesses: 5/1/3 Invasive Species: None as of 2011 Lakeshed to lake area ratio: 2:1 Total Phosphorus Dead lake is phosphorus limited, which means that algae and aquatic plant growth is dependent upon available phosphorus. Total phosphorus was evaluated in Dead Lake in All sites show relatively similar phosphorus concentration and seasonal patterns. There is no total phosphorus trend at this time. Chlorophyll a Chlorophyll a is the pigment that makes plants and algae green. It is tested in lakes to determine the algae concentration or how green the water is. Chlorophyll a concentrations greater than 10 ug/l are perceived as a mild algae bloom, while concentrations greater than 20 ug/l are perceived as a nuisance. Chlorophyll a was evaluated in Dead Lake in Concentrations reached 10 ug/l most years, and 20 ug/l in some years, indicating algae blooms. All sites are relatively similar in concentration and seasonal pattern. Chlorophyll a concentrations had no trend. Transparency (Secchi Depth) Transparency is how easily light can pass through a substance. In lakes it is how deep sunlight penetrates through the water. Plants and algae need sunlight to grow, therefore they are only found in areas of lakes where the sun penetrates. Water transparency depends on the amount of particles in the water. An increase in particulates results in a decrease in transparency. The annual mean transparency for Dead Lake ranges from 5.1 to 12.6 feet. The transparency is consistently best at site 205, which is deeper than the other sites. The Dead Lake lowest transparency was consistently as site 211, a very shallow bay. Transparency on the lake has shown an improving trend. Trophic State Index (TSI) Phosphorus (nutrients), chlorophyll a (algae concentration), and Secchi depth (transparency) are interrelated. As phosphorus increases, there is more food available for algae, resulting in increased algal concentrations. When algal concentrations increase, the water becomes less transparent and the Secchi depth decreases. The results from these three measurements cover different units and ranges and thus cannot be directly compared or averaged. In order to standardize these measurements to make them directly comparable, we convert them to a tropic state index (TSI). The mean TSI for Dead Lake is 48, and falls within the mesotrophic range. Mesotrophic lakes (TSI 40-50) are characterized by moderately clear water most of the summer. Meso means middle and the root trophy means nutrients, therefore, mesotrophic literally means a medium amount of productivity. These lakes are commonly found in Central Minnesota and have clear water with algal blooms late in the summer. They are also good walleye fishing. Dead Lake total phosphorus, chlorophyll a, and transparency historical ranges. The arrow represents the range and the black dot represents the historical mean (Primary Site 206). Figure adapted after Moore and Thornton, [Ed.] Lake and Reservoir Restoration Guidance Manual. (Doc. No. EPA 440/ ) Hypereutrophic Eutrophic Mesotrophic Oligotrophic Local association information: The Dead Lake Association

2 Dead Lake OTTER TAIL COUNTY Lake Water Quality Summary Dead Lake is located 12 miles southwest of Perham, MN in Otter Tail County. It has covers 7,567 acres, which places it in the upper 10% of lakes in Minnesota in terms of size. Dead Lake has five inlets and one outlet, which classify it as a drainage lake. It receives water from Mud and Peterson lake (Maine township) and Mud Lake located in Amor township. The larger middle bay contains the Dead River outlet, which flows into Walker Lake and then Otter Tail Lake. Water quality data have been collected on Dead Lake in 1976 and (Tables 2 3). These data show that the lake is at the oligotrophic/mesotrophic border (TSI 39 41), with characteristic clear water throughout the summer and excellent recreational opportunities (page 9). The Dead Lake Association is committed to the protection of the lake ecology primarily through community education. The Association has been involved in raising awareness through special informative events, funding efforts to raise interest in a local walleye hatchery, invasive species prevention, and wildlife habitat restoration. They are also a member of the Otter Tail County Coalition of Lake Associations (COLA). Table 1. Dead Lake location and key physical characteristics. Location Data MN Lake ID: County: Ecoregion: Major Drainage Basin: Otter Tail Northern Central Hardwood Forests Red River Latitude/Longitude: / Invasive Species: None as of 2011 Table 2. Availability of primary data types for Dead Lake. Data Availability Transparency data Physical Characteristics Surface area (acres): 7567 Littoral area (acres): 6880 % Littoral area: 91% Max depth (ft), (m): 61, 18.5 Inlets: 5 Outlets: 1 Public Accesses: 3 Excellent data set from the Citizens Lake Monitoring Program. Chemical data Excellent data set through the RMBEL Lakes Program. Inlet/Outlet data No data available. Recommendations For recommendations refer to page 18. RMB Environmental Laboratories, Inc. 1 of Dead Lake

3 Lake Map Figure 1. Map of Dead Lake with 2010 aerial imagery and illustrations of lake depth contour lines, sample site locations, inlets and outlets, and public access points. The light green shaded areas in the lake illustrate the littoral zone, where the sunlight can usually reach the lake bottom allowing aquatic plants to grow. Table 3. Monitoring programs and associated monitoring sites. Monitoring programs include Minnesota Pollution Control Agency (MPCA); Citizens Lake Monitoring Program (CLMP); RMB Environmental Laboratories Lakes Program (RMBEL). Lake Site Depth (ft) Monitoring Programs MPCA: CLMP: ; MPCA: *secondary 20 CLMP: ; RMBEL: CLMP: CLMP: *primary 50 CLMP: , ; RMBEL: CLMP: *secondary 15 CLMP: 1993, , 2003, ; MPCA: 1993 RMBEL: CLMP: 1993, ; MPCA: CLMP: CLMP: *secondary 15 CLMP: ; RMBEL: CLMP: ; RMBEL: RMB Environmental Laboratories, Inc. 2 of Dead Lake
4 Average Water Quality Statistics The information below describes available chemical data for the primary site (205) of Dead Lake through The data set is limited, and all parameters with the exception of total phosphorus, chlorophyll a, and Secchi depth, are means for just 1986 data. Minnesota is divided into 7 ecoregions based on land use, vegetation, precipitation, and geology. The MPCA has developed a way to determine the average range of water quality expected for lakes in each ecoregion. For more information, and expected water quality ranges, see page 11. Table 4. Water quality means compared to ecoregion ranges and impaired waters standard. Impaired Parameter Mean Ecoregion Range 1 Waters Standard 2 Interpretation Total phosphorus (ug/l) > 40 3 Chlorophyll a (ug/l) > 14 Chlorophyll a max (ug/l) Secchi depth (ft) < 7 Dissolved oxygen Total Kjeldahl Nitrogen (mg/l) Polymictic See page 8 Results are within the expected range for the ecoregion. Dissolved oxygen depth profiles show that the lake mixes often in the summer < Indicates insufficient nitrogen to support summer nitrogeninduced algae blooms. Alkalinity (mg/l) Indicates a low sensitivity to acid rain and a good buffering capacity. Color (Pt-Co Units) Indicates clear water with little to no tannins (brown stain). ph Within the expected range for the ecoregion. Lake water ph less than 6.5 can affect fish spawning and the solubility of metals in the water. Chloride (mg/l) Within the expected range for the ecoregion. Total Suspended Solids (mg/l) Specific Conductance (umhos/cm) Total Nitrogen:Total Phosphorus Within the expected range for the ecoregion. Indicates low suspended solids and clear water Within the expected range for the ecoregion. 40:1 25:1 35:1 Indicates the lake is phosphorus limited, which means that algae growth is limited by the amount of phosphorus in the lake. 1 The ecoregion range is the 25 th 75 th percentile of summer means from ecoregion reference lakes 2 For further information regarding the Impaired Waters Assessment program, refer to 3 Chlorophyll a measurements have been corrected for pheophytin Units: 1 mg/l (ppm) = 1,000 ug/l (ppb) RMB Environmental Laboratories, Inc. 3 of Dead Lake
: 24 25 21 24 20 Total Phosphorus Min: 5 17 11 5 12 Total Phosphorus Max: 41 40 43 44 30 Number of Observations: 72 28 32 60 22 Chlorophyll a")
5 Water Quality Characteristics - Historical Means and Ranges Table 5. Water quality means and ranges for primary sites. Parameters Primary Site 205 Total Phosphorus Mean (ug/l): Total Phosphorus Min: Total Phosphorus Max: Number of Observations: Chlorophyll a Mean (ug/l): Chlorophyll a Min: Chlorophyll a Max: Number of Observations: Secchi Depth Mean (ft): Secchi Depth Min: Secchi Depth Max: Number of Observations: Site 202 Site 207 Site 211 Site 212 Figure 2. Dead Lake total phosphorus, chlorophyll a, and transparency historical ranges. The arrow represents the range and the black dot represents the historical mean (Primary Site 205). Figure adapted after Moore and Thornton, [Ed.] Lake and Reservoir Restoration Guidance Manual. (Doc. No. EPA 440/ ) RMB Environmental Laboratories, Inc. 4 of Dead Lake
6 Secchi Depth (ft) Transparency (Secchi Depth) Transparency is how easily light can pass through a substance. In lakes, it is how deep sunlight penetrates through the water. Plants and algae need sunlight to grow, so they are only found in areas of lakes where the sun penetrates. Water transparency depends on the amount of particles in the water. An increase in particulates results in a decrease in transparency. The transparency varies year to year due to changes in weather, precipitation, lake use, flooding, temperature, lake levels, etc. For all the main sites in Dead Lake, the mean transparency ranges from 5.1 to 12.6 feet. The transparency is consistently the best at site 205, which is deeper than the other sites. The lowest transparency is consistently at site 211, a very shallow bay. Transparency monitoring should be continued annually at all sites to track water quality changes. 14 Transparency: Annual Means Site 202 Site 205 Site 207 Site 211 Site Figure 3. Annual mean transparency comparison between sites. Dead Lake transparency ranges from 5 to 22 feet at site 205. Figure 4 shows the seasonal transparency dynamics. The maximum Secchi reading is usually obtained in late spring or early summer. Dead Lake transparency is high in May and June, and then declines through October. If Secchi readings were taken later in October, the transparency would most likely show a rebound after fall turnover. The dynamics are influenced by algae and zooplankton population dynamics and lake turnover. It is important for lake residents to understand the seasonal transparency dynamics in their lake so they are not concerned as to why visibility is lower in August than June. It is typical for a lake to vary in transparency throughout the summer. RMB Environmental Laboratories, Inc. 5 of Dead Lake
. The black line represents the pattern in the data.")

7 Secchi Depth (ft) Seasonal Transparency Dynamics pattern Poly. (pattern) Figure 4. Seasonal transparency dynamics and year to year comparison (Primary Site 205). The black line represents the pattern in the data. User Perceptions When volunteers collect Secchi depth readings, they record their perceptions of the water based on the physical appearance and the recreational suitability. These observations can be compared to water quality parameters to see how the lake user would experience the lake at that time. When examining transparency data it illustrates that as the Secchi depth decreases, the lake's physical appearance rating decreases. Dead Lake was rated as being not quite crystal clear 73% of the time between , and % 25% Physical Appearance Rating 25% Crystal clear water 73% Not quite crystal clear a little algae visible 2% Definite algae green, yellow, or brown color apparent 0% High algae levels with limited clarity and/or mild odor apparent 73% 0% Severely high algae levels Figure 5. Physical appearance rating, as rated by the volunteer monitor. RMB Environmental Laboratories, Inc. 6 of Dead Lake


8 Total Phosphorus (ug/l) As the secchi depth decreases, the perception of recreational suitability of the lake decreases. Dead Lake was rated as being beautiful 57% of the time from , and Recreational Suitability Rating 57% Beautiful, could not be better 43% 43% Very minor aesthetic problems; excellent for swimming, boating 57% 0 % Swimming and aesthetic enjoyment of the lake slightly impaired because of algae levels Figure 6. Recreational suitability rating, as rated by the volunteer monitor. 0% Desire to swim and level of enjoyment of the lake substantially reduced because of algae levels 0% Swimming and aesthetic enjoyment of the lake nearly impossible because of algae levels Total Phosphorus Dead Lake is phosphorus limited, which means that algae and aquatic plant growth is dependent upon available phosphorus. Total phosphorus was evaluated in Dead Lake in All sites show relatively similar phosphorus concentrations and seasonal patterns (Figure 7) Total Phosphorus Site 205 Site 202 Site 207 Site 211 Site 212 Phosphorus Figure 7. Historical total phosphorus concentrations (ug/l) for Dead Lake. monitoring should continue in order to track any future changes in water quality. RMB Environmental Laboratories, Inc. 7 of Dead Lake
9 Dissolved Oxygen (mg/l) Chlorophyll a (ug/l) Chlorophyll a Chlorophyll a is the pigment that makes plants and algae green. It is tested in lakes to determine the algae concentration or how green the water is. Chlorophyll a concentrations greater than 10 ug/l are perceived as a mild algae bloom, while concentrations greater than 20 ug/l are perceived as a nuisance Chlorophyll a Site 205 Site 202 Site 207 Site 211 Site 212 Minor Algae Nuisance Algae Chlorophyll a was evaluated in Dead Figure 8. Chlorophyll a concentrations (ug/l) for Dead Lake. Lake from Concentrations reach 10 ug/l most years, and 20 ug/l in some years, indicating algae blooms (Figure 8). All sites are relatively similar in concentration and seasonal pattern. Dissolved Oxygen Secchi Depth (m) Dissolved Oxygen (mg/l) /11/1993 6/6/1993 7/12/1993 9/8/ /4/1993 Secchi Depth (m) Dissolved Oxygen (DO) is the amount of oxygen dissolved in lake water. Oxygen is necessary for all living organisms to survive, except for some bacteria. Living organisms breathe in oxygen that is dissolved in the water. Dissolved oxygen levels of <5 mg/l are typically avoided by game fisheries. Dead Lake is a relatively shallow lake. The maximum depth is 61 feet; however, the majority of the lake is approximately 20 feet deep. In a shallow lake the water column never completely stratifies; any wind can mix the water. Figure 9 illustrates stratification in the summer of 1993 at site 102. This is a representative dissolved oxygen profile for Dead Lake Figure 9. Dissolved oxygen profile for Dead Lake in 1993 at site RMB Environmental Laboratories, Inc. 8 of Dead Lake
10 Trophic State Index Phosphorus (nutrients), chlorophyll a (algae concentration), and Secchi depth (transparency) are related. As phosphorus increases, there is more food available for algae, resulting in increased algal concentrations. When algal concentrations increase, the water becomes less transparent and the Secchi depth decreases. The results from these three measurements cover different units and ranges and thus cannot be directly compared or averaged. In order to standardize these three measurements and make them comparable, they are converted to a trophic state index (TSI). The mean TSI for Dead Lake falls into the mesotrophic range. There is good agreement between the TSI for phosphorus and chlorophyll a, indicating that these variables are strongly related (Table 6). The TSI for Secchi disk readings are lower Dead Lake than the other two parameters. This could be due to loss of rooted vegetation, large particulates dominating the algal community, or selective grazing by zooplankton on the smaller algal cells. Table 6. Trophic State Index for site 205. Trophic State Index Site 205 TSI Total Phosphorus 50 TSI Chlorophyll a 51 TSI Secchi 43 TSI Mean 48 Trophic State: Mesotrophic Numbers represent the mean TSI for each parameter. Hypereutrophic Eutrophic Mesotrophic Mesotrophic lakes (TSI 40 50) are characterized by moderately clear water most of the summer (Table 7). "Meso" means middle or mid; therefore, mesotrophic means a medium amount of productivity. These lakes are commonly found in central Minnesota and have clear water with algal blooms in late summer. They are also good for walleye fishing. Oligotrophic 0 Table 7. Trophic state index attributes and their corresponding fisheries and recreation characteristics. TSI Attributes Fisheries & Recreation <30 Oligotrophy: Clear water, oxygen throughout Trout fisheries dominate the year at the bottom of the lake, very deep cold water Bottom of shallower lakes may become anoxic (no oxygen). Trout fisheries in deep lakes only. Walleye, Cisco present Mesotrophy: Water moderately clear most of the summer. May be "greener" in late summer. No oxygen at the bottom of the lake results in loss of trout. Walleye may predominate Eutrophy: Algae and aquatic plant problems possible. "Green" water most of the year. Warm-water fisheries only. Bass may dominate Blue-green algae dominate, algal scums and aquatic plant problems. Dense algae and aquatic plants. Low water clarity may discourage swimming and boating Hypereutrophy: Dense algae and aquatic Water is not suitable for recreation. plants. >80 Algal scums, few aquatic plants Rough fish (carp) dominate; summer fish kills possible Source: Carlson, R.E A trophic state index for lakes. Limnology and Oceanography. 22: RMB Environmental Laboratories, Inc. 9 of Dead Lake
11 Secchi Depth (ft) Trend Analysis For detecting trends, a minimum of 8 10 years of data, with 4 or more readings per season, are recommended. Minimum confidence accepted by the MPCA is 90%. This means that there is a 90% chance that the data are showing a true trend and a 10% chance that the trend is a random result of the data. Only short-term trends can be determined with just a few years of data, because there can be different wet years and dry years, water levels, weather, etc., that affect the water quality naturally. There is enough historical data to perform trend analysis for total phosphorus, chlorophyll a, and transparency on Dead Lake (Table 8, Figure 11). The data was analyzed using the Mann Kendall Trend Analysis. Table 8. Trend analysis for Dead Lake. Lake Site Parameter Date Range Trend Probability 205 Transparency Improving 95% 202 Transparency Improving 99% 205 Total Phosphorus No trend Chlorophyll a No trend Transparency Trend for Dead Lake Figure 11. Transparency (ft) trend for site 205 from Sites 205 and 202 show a significant improving trend in transparency, by an average of 2 feet. Transparency monitoring should continue at both sites so that this trend can be tracked in future years. There are no significant trends in total phosphorus or chlorophyll a. RMB Environmental Laboratories, Inc. 10 of Dead Lake


12 Ecoregion Comparisons Minnesota is divided into 7 ecoregions based on land use, vegetation, precipitation, and geology (Figure 12). The MPCA has developed a way to determine the average range of water quality expected for lakes in each ecoregion. From , the MPCA evaluated the lake water quality for reference lakes. These lakes are not considered pristine, but have little human impact and, therefore, are representative of the typical lakes within the ecoregion. The average range refers to the 25 th 75 th percentile range for data within each ecoregion. For the purpose of this graphical representation, the means of the reference lake data sets were used. Dead Lake is in the Central Hardwood Forests Ecoregion. The mean total phosphorus, chlorophyll a, and transparency (Secchi depth) for Dead Lake are all within the expected ecoregion ranges (Figure 13). Figure 12. Minnesota Ecoregions. increased algae crystal clear CHF Ecoregion Dead Figures 13a-c. Dead Lake ranges compared to the Central Hardwood Forest Ecoregion ranges. The Dead Lake total phosphorus and chlorophyll a ranges are from 72 data points collected in May September of The Dead Lake Secchi depth range is from 230 data points collected in May September from RMB Environmental Laboratories, Inc. 11 of Dead Lake

13 Lakeshed Data and Interpretations Lakeshed Understanding a lakeshed requires an understanding of basic hydrology. A watershed is defined as all land and water surface area that contribute excess water to a defined point. The MN DNR has delineated three basic scales of watersheds (from large to small): 1) basins, 2) major watersheds, and 3) minor watersheds. The Otter Tail River Major Watershed is one of the watersheds that make up the Red River Basin, which drains north to Lake Winnipeg (Figure 14). This major watershed is made up of 106 minor watersheds. Dead Lake is located in minor watershed (Figure 15). Figure 14.Otter Tail River Watershed. Figure 15. Minor Watershed The MN DNR has also evaluated catchments for each individual lake with greater than 100 acres surface area. These lakesheds (catchments) are the building blocks for the larger scale watersheds. Dead Lake falls within lakeshed (Figure 16). Though very useful for displaying the land and water that contribute directly to a lake, lakesheds are not always true watersheds because they may not show water flowing into a lake from upstream streams or rivers. While some lakes may have only one or two upstream lakesheds draining Figure 16. Dead Lake s Lakeshed ( ) with land ownership, lakes, into them, others may be and wetlands illustrated. connected to a large number, reflecting a larger drainage area via stream or river networks. For further discussion of Dead Lake s RMB Environmental Laboratories, Inc. 12 of Dead Lake
14 full watershed, containing all the lakesheds upstream of Dead Lake lakeshed, see page 17. The data interpretation of the Dead Lake lakeshed includes only the land surface that flows directly into it. The lakeshed vitals table identifies where to focus organizational and management efforts for each lake (Table 9). Criteria were developed using limnological concepts to determine the effect to lake water quality. KEY Possibly detrimental to the lake Warrants attention Beneficial to the lake Table 9. Lakeshed vitals for Dead Lake. Lakeshed Vitals Rating Lake Area 7567 acres descriptive Littoral Zone Area 6880 acres descriptive Lake Max Depth 61 feet descriptive Lake Mean Depth 9 feet Water Residence Time NA NA Miles of Stream 2.0 descriptive Inlets 5 Outlets 1 Major Watershed 56 - Otter Tail River descriptive Minor Watershed descriptive Lakeshed descriptive Ecoregion North Central Hardwood Forests descriptive Total Lakeshed to Lake Area Ratio (total lakeshed includes lake area) 2:1 Standard Watershed to Lake Basin Ratio (standard watershed includes lake areas) 11:1 Wetland Coverage 12.4% Aquatic Invasive Species None as of 2011 Public Drainage Ditches Public Lake Accesses 3 Yes Miles of Shoreline 40.0 miles descriptive Shoreline Development Index 3.5 Public Land to Private Land Ratio 0.09:1 Development Classification Natural Environment Miles of Road 39.1 descriptive Municipalities in lakeshed Forestry Practices None No county forest plan Feedlots 3 Sewage Management Individual waste treatment systems (last county-wide inspection in 1997) Lake Management Plan None Lake Vegetation Survey/Plan None RMB Environmental Laboratories, Inc. 13 of Dead Lake

 lakeshed land cover (http://land.umn.edu). hydrology of a lakeshed.")
15 Land Cover / Land Use Activities that occur on land within the lakeshed can greatly impact a lake. Land use planning helps ensure the use of resources in an organized fashion, so the needs of the present and future generations can be best addressed. The purpose of land use planning is to ensure acreage will be used in a manner that provides maximum social benefits without degradation of land resource. Changes in land use, and ultimately land cover, impact the Figure 17. The Dead Lake ( ) lakeshed land cover ( hydrology of a lakeshed. Cover is directly related to the land s ability to absorb and store water, rather than forcing it to flow overland (gathering nutrients and sediment as it moves) towards the lowest point on the landscape. Impervious intensity describes the lands inability to absorb water, the higher the % impervious intensity the more area water cannot penetrate into the soil. Monitoring the changes in land use can assist in future planning procedures to address the needs of future generations. Phosphorus export, the main cause of lake eutrophication, depends on the type of land cover occurring in the lakeshed. Figure 17 depicts the land cover in Dead lakeshed. The University of Minnesota has online records of land cover statistics from years 1990 and 2000 ( Although this data is 11 years old, it is the only data set available to compare over a decade of time. Table 10 describes Dead lakeshe s land cover statistics and percent change from 1990 to Due to factors that influence demographics, one cannot determine with certainty the projected statistics over the next 10, 20, 30+ years, but one can see the transition from agriculture, grass/shrub/wetland, to forest and urban acreages. The largest change in percentage is the increase in forest cover (30%). In addition, the impervious intensity has increased, which has implications for storm water runoff into the lake. The increase in impervious intensity is consistent with the increase in urban acreage. RMB Environmental Laboratories, Inc. 14 of Dead Lake
16 Table 10. Dead Lake s lakeshed land cover statistics and % change from 1990 to 2000 ( % Change Land Cover Acres Percent Acres Percent 1990 to 2000 Agriculture % Decrease Grass/Shrub/Wetland % Decrease Forest % Increase Water % Decrease Urban % Increase Impervious Intensity % % Decrease % Decrease % Decrease % Increase % Increase % Increase % Increase Total Area Total Impervious Area (Percent Impervious Area Excludes Water Area) % Increase Demographics Dead Lake is classified as a natural environment lake. These lakes usually have less than 150 total acres, less than 60 acres per mile of shoreline, and less than three dwellings per mile of shoreline. They may also have winter kill of fish, shallow, swampy shoreline, and are less than 15 feet deep. The Minnesota Department of Administration Geographic and Demographic Analysis Division extrapolated the future population of the area, in 5-year increments, out to Compared to Otter Tail County as a whole, Star and Dead Lake Townships have a higher extrapolated growth projection, while Maine Township has a similar extrapolated growth projection (Figure 18). Figure 18. Population growth projection for Star Lake, Dead Lake, Maine Township, and Otter Tail County. (source: ate.mn.us/resource.html?i d=19332) RMB Environmental Laboratories, Inc. 15 of Dead Lake
17 Dead Lake Lakeshed Water Quality Protection Strategy Each lakeshed has a unique combination of public and private lands. Looking detail at the makeup of these lands can offer insight on where to focus protection efforts. The protected lands (easements, wetlands, and public land) are the future water quality infrastructure for the lake. Developed land and agriculture have the highest phosphorus runoff coefficients, so this land should be minimized for water quality protection. The majority of the land within Dead Lake s lakeshed is made up of agriculture and private forested uplands (Table 11). This land can be the focus of development and protection efforts in the lakeshed. Table 11. Percent land use in private versus publicly owned land with corresponding phosphorus loading and protection/restoration ideas (Sources: Otter Tail County parcel data, National Wetlands Inventory, and the 2006 National Land Cover Dataset). Private (55%) 40% Public (5%) Developed Agriculture Forested Uplands Other Wetlands Open Water County State Federal Land Use (%) 2.6% 21.0% 17.1% 4.8% 9.5% 40% 0.4% 3.4% 1.2% Runoff Coefficient Lbs of phosphorus/acre/ year Estimated Phosphorus Loading Acerage x runoff coefficient Description Focused on Shoreland Cropland Focus of development and protection efforts Open, pasture, grassland, shrubland Protected Potential Phase 3 Discussion Items Shoreline restoration Restore wetlands; CRP Forest stewardship planning, 3 rd party certification, SFIA, local woodland cooperatives Protected by Wetland Conservation Act County Tax Forfeit Lands State Forest National Forest DNR Fisheries approach for lake protection and restoration Credit: Peter Jacobson and Michael Duval, Minnesota DNR Fisheries In an effort to prioritize protection and restoration efforts of fishery lakes, the MN DNR has developed a ranking system by separating lakes into two categories, those needing protection and those needing restoration. Modeling by the DNR Fisheries Research Unit suggests that total phosphorus concentrations increase significantly over natural concentrations in lakes that have watershed with disturbance greater than 25%. Therefore, lakes with watersheds that have less than 25% disturbance need protection and lakes with more than 25% disturbance need restoration (Table 12). Watershed disturbance was defined as having urban, agricultural and mining land uses. Watershed protection is defined as publicly owned land or conservation easement. RMB Environmental Laboratories, Inc. 16 of Dead Lake
 (%) < 25% > 75% Vigilance < 75% Protection 25-60% n/a Full Restoration > 60% n/a Partial Restoration Sufficiently protected --")
18 Table 12. Suggested approaches for watershed protection and restoration of DNR-managed fish lakes in Minnesota. Watershed Watershed Management Disturbance Protected Comments Type (%) (%) < 25% > 75% Vigilance < 75% Protection 25-60% n/a Full Restoration > 60% n/a Partial Restoration Sufficiently protected -- Water quality supports healthy and diverse native fish communities. Keep public lands protected. Excellent candidates for protection -- Water quality can be maintained in a range that supports healthy and diverse native fish communities. Disturbed lands should be limited to less than 25%. Realistic chance for full restoration of water quality and improve quality of fish communities. Disturbed land percentage should be reduced and BMPs implemented. Restoration will be very expensive and probably will not achieve water quality conditions necessary to sustain healthy fish communities. Restoration opportunities must be critically evaluated to assure feasible positive outcomes. The next step was to prioritize lakes within each of these management categories. DNR Fisheries identified high value fishery lakes, such as cisco refuge lakes. Ciscos (Coregonus artedi) can be an early indicator of eutrophication in a lake because they require cold hypolimnetic temperatures and high dissolved oxygen levels. These watersheds with low disturbance and high value fishery lakes are excellent candidates for priority protection measures, especially those that are related to forestry and minimizing the effects of landscape disturbance. Forest stewardship planning, harvest coordination to reduce hydrology impacts, and forest conservation easements are some potential tools that can protect these high value resources for the long term. Dead Lake is classified with having 47.9% of the watershed protected and 27.1% of the watershed disturbed (Figure 19), therefore, it should have a full restoration focus. Goals for the lake should be to limit any increase in disturbed land use. Figure 20 displays the upstream lakesheds that contribute water to the lakeshed of interest. All of the land and water area in this figure has the potential to contribute water to Dead Lake, whether through direct overland flow or through a creek or river. Eighteen of the 27 upstream lakesheds have the same management focus (full restoration). Percent of the Watershed Protected 0% 75% 100% Dead Lake (47.9%) Percent of the Watershed with Disturbed Land Cover 0% 25% 100% Dead Lake (27.1%) Figure 19. Dead lakeshed s percentage of watershed protected and disturbed. Figure 20. Upstream lakesheds that contribute water to the Dead lakeshed. Color-coded based on management focus (Table 12). RMB Environmental Laboratories, Inc. 17 of Dead Lake
19 Dead Lake, Status of the Fishery (as of 08/10/2009) Dead Lake is a 7,901-acre mesotrophic (moderately fertile) lake located in central Otter Tail County, approximately three miles south of Dent, MN. The Dead River outlet is located along the southeast shoreline and flows south into Walker and Otter Tail Lakes. The Walker Lake State Fish Hatchery is located on the Dead River. Dead Lake is also connected to Star Lake by a nonnavigable channel under County Road 35. The watershed is composed primarily of agricultural and marsh land interspersed with hardwood woodlots. The maximum depth of Dead Lake is 65 feet; however, 83% of the lake is less than 15 feet in depth. The Secchi disk reading during the 2009 lake survey was 4.9 feet. Previous Secchi disk readings have ranged from 3.0 to 6.0 feet. Water clarity in the lake occasionally diminishes during the summer months due to plankton/algae blooms. The majority of the shoreline of Dead Lake remains undeveloped. Approximately 70% of the shoreline is composed of mixed hardwoods or marshlands. Homes, cabins, and resorts occupy the shoreline that is developed. Three DNR-owned public water accesses are available. They are located along the north, west, and east shorelines. Large stands of hardstem bulrush and wild rice are prevalent throughout the lake. Emergent aquatic plants, such as bulrush and wild rice, provide valuable fish and wildlife habitat, and are critical for maintaining good water quality. They protect shorelines and lake bottoms, absorbing and breaking down pollutants. Emergent plants provide spawning areas for fish such as northern pike, largemouth bass, and panfish. They also serve as important nursery areas for all species of fish. Due to their ecological value, emergent plants may not be removed without a DNR permit. To maintain the excellent water quality and angling, it is imperative to preserve the quality of aquatic habitats. Dead Lake has a reputation as one of the best fishing lakes in Otter Tail County. Northern pike, walleye, largemouth bass, black crappie, and bluegill are the dominant game species. The prolificacy of these species can be attributed to the abundance of suitable spawning habitat. The test-net catch rate of walleye has remained stable in recent surveys. Walleye ranged in length from 8.9 to 27.8 inches with an average length and weight of 14.3 inches and 1.1 pounds. They reach an average length of 15.0 inches at four years of age. The northern pike test-net catch rate indicates that are abundant. Age data from recent assessments indicate that northern pike reproduction is consistently good, but mortality is high and growth is slow. Pike ranged in length from 9.7 to 32.0 inches with an average length and weight of 17.1 inches and 1.2 pounds. Bluegill test-net catch rates have remained stable over the recent series of surveys. The short term trend has been an increase in bluegill size distribution. Thirty-six percent of the bluegills in this assessment were at least 7.0 inches or greater in length, reaching an average length of 7.1 inches at seven years of age. Anglers can help maintain the quality of angling by practicing selective harvest. This management practice encourages the release of medium to large-size fish while allowing the harvest of more abundant, smaller fish for table fare. Releasing the medium to large fish will ensure that the lake has enough spawning-age fish annually and will provide anglers with more opportunities to catch large fish in the future. The western basin of Dead Lake is susceptible to periodic winterkill. A partial winterkill was most recently documented during the winter of Data from population assessments indicate that this basin has been repopulated with fish from the main lake basin. Dead Lake is also a popular waterfowl hunting lake. Many hunters pursue diving ducks at various locations on the lake. Large stands of emergent vegetation are abundant and offer convenient blinds for hunters. A State Wildlife Management Area is located along the northeast shoreline. See the link below for specific information on gillnet surveys, stocking information, and fish consumption guidelines. RMB Environmental Laboratories, Inc. 18 of Dead Lake
20 Key Findings / Recommendations Monitoring Recommendations Transparency monitoring at sites 202, 205, 207, 211 and 212 should be continued annually. It is important to continue transparency monitoring weekly, or at least bimonthly, every year to enable annual comparisons and trend analyses. Phosphorus and chlorophyll a monitoring should continue, as the budget allows, to track future water quality trends. Overall Summary Dead Lake is a healthy, shallow, and natural eutrophic lake. Its lakeshed would benefit from additional protection against disturbed land uses. Five percent (5%) of the lakeshed is public ownership, 48% of is protected, and 27% is disturbed (Figure 19). Dead Lake has an improving trend in transparency since It is often difficult to pin point why a lake is improving; it could be attributed to natural causes. The last county septic system upgrade was in 1997, which could have contributed to improving water quality. Dead Lake receives a lot of water from upstream lakes (Star and Big McDonald Lakes), continually flushing the lake. Priority Impacts to the lake Agricultural land use in the lakeshed is high (21%), and is therefore classified as partial restoration (Table 11, Figure 20). There are three animal feedlots in the Dead Lake lakeshed (Table 9). Shoreline buffers are thin in many farmed sections (especially the west side), so nutrient and sediment runoff from agricultural lands could reach the lake in those areas. However, most of the agriculture land is pasture, which has less runoff than row crops or animal feedlots. Dead Lake is an exceptional natural environment lake, with excellent fish and wildlife habitat. Because it is a shallow lake, it is very important to protect native aquatic plant beds to preserve fish habitat and water clarity. Dead Lake is currently not heavily developed. Future development could impact fish and wildlife habitat, and therefore should be managed carefully. From , the urban area in the lakeshed increased by 58 acres, and the impervious area increased by 19 acres. Best Management Practices Recommendations The management focus for Dead Lake should be to protect the current water quality, and restore and protect more of the lakeshed. Partnering with farmers in the lakeshed to implement conservation farming practices, restore wetlands, increase lake shoreline buffers, or place priority parcels into land retirement programs can decrease the impacts of agriculture in the lakeshed. Native aquatic plants stabilize the lake s sediments and tie up phosphorus in their tissues. When aquatic plants are uprooted from a shallow lake, the lake bottom is disturbed, and the phosphorus in the water column gets used by algae instead of plants. This contributes to greener water and more algae blooms. Protecting native aquatic plant beds will ensure a healthy lake and healthy fishery. Protection efforts should be also focused on managing and/or decreasing the impact caused by additional development, including second tier development, and impervious surface area. Project ideas include protecting land with conservation easements, enforcing county shoreline ordinances, smart development, shoreline restoration, rain gardens, and septic system maintenance. RMB Environmental Laboratories, Inc. 19 of Dead Lake
21 Organizational contacts and reference sites Dead Lake Association DNR Fisheries Office Regional Minnesota Pollution Control Agency Office Otter Tail Soil and Water Conservation District st Avenue North, Fergus Falls, MN Lake Ave., Suite 220, Detroit Lakes, MN , Western Ave N, Fergus Falls, MN ext.3 RMB Environmental Laboratories, Inc. 20 of Dead Lake
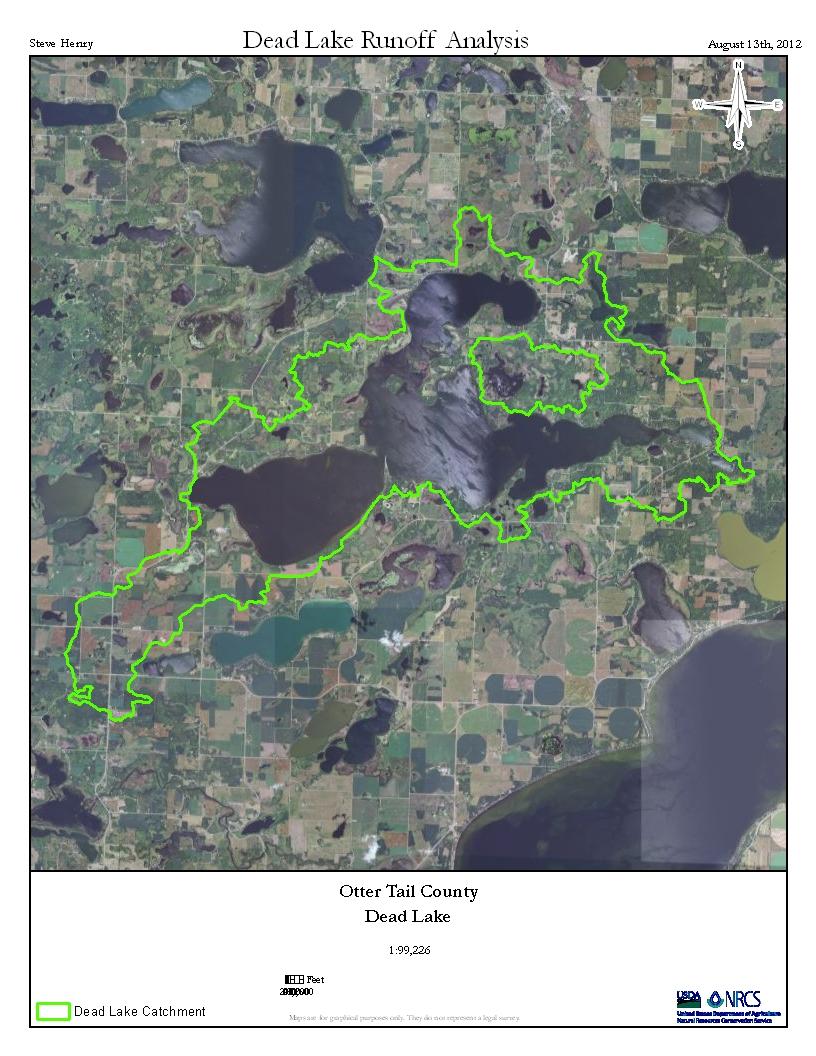
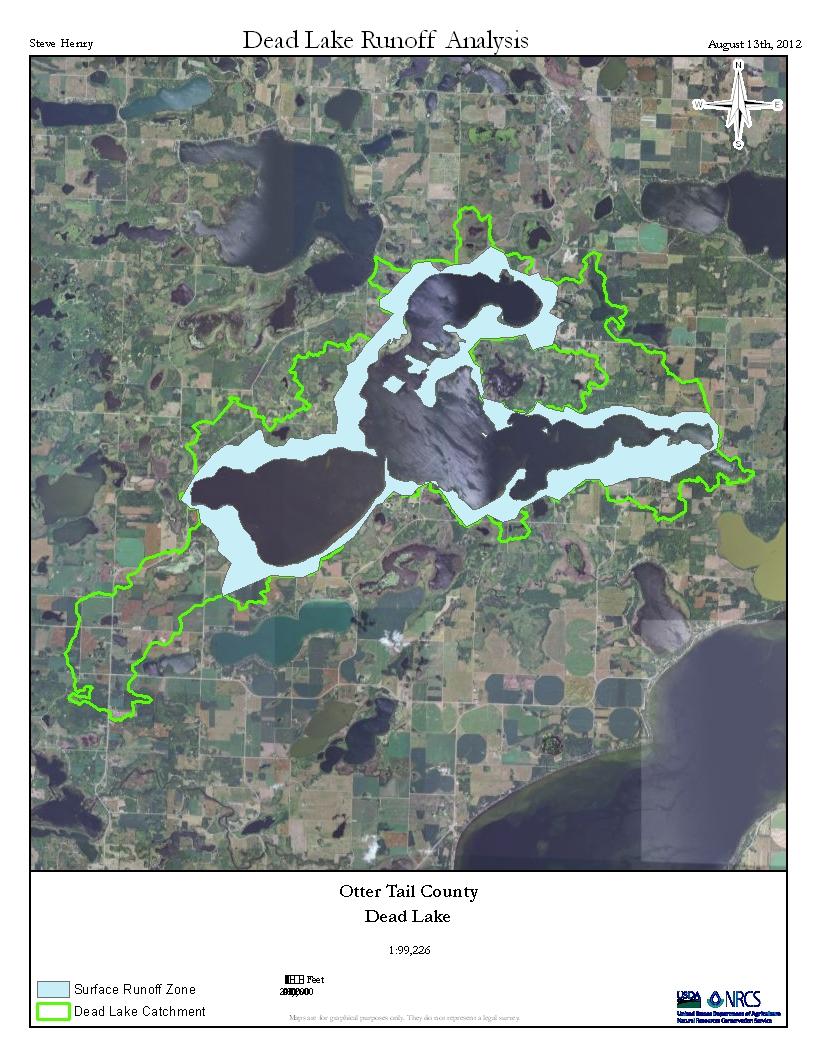
22 Surface Runoff Analysis This analysis is for Dead Lake and utilizes new laser elevation data and computer processes. Evaluating landscape shape and positioning this analysis generates a relative threat number that equates to the likelihood of pollution reaching the lake from that location. Current land use is not incorporated into this analysis. Steve Henry Douglas County Water Resource Technician 8/15/2012
23
24

25
26