Heat storage based on a NaCH3COO water mixture for solar heating systems
|
|
|
- Rhoda Patrick
- 5 years ago
- Views:
Transcription
1 Downloaded from orbit.dtu.dk on: Nov 01, 2018 Heat storage based on a NaCH3COO water mixture for solar heating systems Furbo, Simon; Fan, Jianhua Publication date: 2012 Document Version Publisher's PDF, also known as Version of record Link back to DTU Orbit Citation (APA): Furbo, S., & Fan, J. (2012). Heat storage based on a NaCH3COO water mixture for solar heating systems. Technical University of Denmark, Department of Civil Engineering. DTU Civil Engineering Reports, No. SR General rights Copyright and moral rights for the publications made accessible in the public portal are retained by the authors and/or other copyright owners and it is a condition of accessing publications that users recognise and abide by the legal requirements associated with these rights. Users may download and print one copy of any publication from the public portal for the purpose of private study or research. You may not further distribute the material or use it for any profit-making activity or commercial gain You may freely distribute the URL identifying the publication in the public portal If you believe that this document breaches copyright please contact us providing details, and we will remove access to the work immediately and investigate your claim.
2 HeatStoragebasedonaNaCH3COOWater MixtureforSolarHeatingSystems Simon Furbo Jianhua Fan Department of Civil Engineering 2012 DTU Civil Engineering-Report SR (UK) December 2012
3
4 FOREWORD This report is the final report of the EUDP projects: EUDP-08-II, IEA Task 42 Compact Thermal Energy Storage: Material development and system integration, j.no.: , EUDP-09-I, IEA Task 42 Compact Thermal Energy Storage: Material development and system integration, 2. og 3. års deltagelse, j.no.: and EUDP11-I, IEA Task 42 Compact Thermal Energy Storage 4. år, j.no.: The projects, which are financed by the Danish Energy Agency, are the Danish part of the IEA Task 42 Compact thermal energy Storage project for the period
5 1Concept A conceptual diagram of a solar heating system conceived by the Technical University of Denmark is shown in Figure 1, [1], [2], [3], [4], [5], [6], [7], [8], [9]. The solar heating system with a compact seasonal heat storage based on stable supercooling of a sodium acetate water mixture is intended to cover the total yearly heat demand and hot water consumption of a low energy one family house. Calculations have shown that a 36 m 2 solar heating system can fully cover the yearly heat demand of a low energy house in Denmark if the solar heating system is equipped with a 6 m 3 seasonal heat storage with a sodium acetate water mixture supercooling in a stable way. The heat storage is divided into a number of separate heat storage modules. The heat storage module concept is based on the advantage of stable supercooling. By using this concept the heat storage module will have no heat loss for a long period making seasonal heat storage possible. If a sodium acetate water mixture, which has a melting point of 58 C, has been fully melted during the sunny summer, it can cool down in its liquid phase to the surrounding temperature and still preserve the latent heat related to the heat of fusion. The heat storage module can be left in this state with no heat loss until a heat demand occurs in the house in the winter, in which case solidification is activated, the heat of fusion is released, and the heat storage temperature increases almost immediately to the melting point. The principle of supercooling is shown in Figure 2, [5]. PCM storage
6 Heat storage capacity of sodium acetate compared to water Sodium acetate Stored energy [kj/litre] Supercooling Activation of solidification Water 100 Melting point = 58 C Temperature [ C] Figure 2: Illustration of energy content of sodium acetate compared to water as well as the supercooling process. 2 Status of development Three differently designed heat storage modules with a sodium acetate mixture consisting of 58% (weight%) sodium acetate and 42% (weight%) water have been tested in a laboratory heat storage test facility. The salt water mixture volumes of the heat storage modules are 234 l, 208 l and 160 l, see papers in appendixes 1, 2, 3, 4 and 5. Figure 3 shows a schematic sketch of the first heat storage module with approximated dimensions in mm. The module material is steel and the wall thickness is 2 mm. Both the upper and lower surfaces of the flat module are used as heat transfer areas for heat transfer to and from the module. Water, which is used as the heat transfer fluid, is pumped through two copper absorbers placed below and above the module as shown in Figure 4. Wooden slats are placed above and below the absorber strips in such a way that there will be a good thermal contact between the fins and the module surfaces. The construction is insulated with 100 mm mineral wool. Figure 3: Principle sketch of the first heat storage module with two holes used to fill in the salt water mixture.


7 1: Wooden slats. 2: Salt water mixture in steel module. 3 & 9: Copper pipes. 4 & 8: Absorber fin. 5: Mineral wool. 6: Bottom of module. 7: Paste with good thermal conductivity. Figure 4: Principle sketch of the first heat storage module with heat transfer system and insulation. The module is filled with 305 kg salt water mixture correspondi ing to a module volume of about 234 l. Figure 5 shows photos of thee module inclusive thermocouples for measurements of the module surface temperatures. The flat module is placed with w a small tilt from horizontal.


8 The heat storage module has been tested by means of two different heat transfer methods. Figure 6 shows photos of the heat storage module using the second heat transfer method. Figure 7 shows a schematic sketch of the lower part of the heat storage module. The heat storage module is placed in a stainless steel container with small separate rooms for water below and above the module. Silicone pipes are attached to the upper and lower surfaces of the module in such a way, that water pumped through the separate rooms will flow through the rooms in a serpentine way, guided by the silicon pipes. The water will therefore flow through the lower room in direct contact with all parts of the lower module surface, and water will flow through the upper room in direct contact with all parts of the upper module surface. Heat is transferred from/to the salt water mixture, to/from the upper or lower module surface and the water is flowing through the upper or lower room. Figure 8 shows a photo of the second heat storage module and Figure 9 shows a schematic sketch of the heat exchangers of the second heat storage module. The heat storage module material is steel and all wall thicknesses are 2 mm. The heat storage module is a flat sandwich construction with a 5 cm salt water mixture room surrounded by two 2 mm heat exchanger rooms with water below and above the salt water mixture room. The heat exchanger rooms are welded together with the salt water mixture room. Heat is transferred to and from the salt water mixture by means of water flowing through the heat exchanger rooms in a serpentine way. Rigid steel bars are welded together with the module


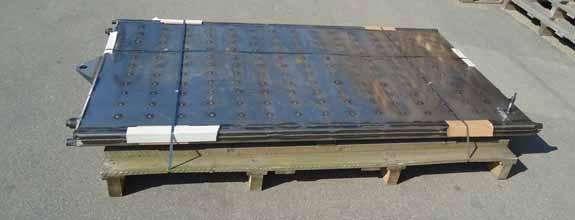
9 with the aim to maintain the geometry of the module. The length and the width of the module are 3000 mm and 2000 mm. The volume of the salt water mixture in the module is 208 l. Figure 10 shows a photo of the third heat storage module.

10
11 The heat storage module material is steel and all wall thicknesses are 2 mm. The heat storage module is a flat sandwich construction with a 5 cm salt water mixture room surrounded by two 2 mm heat exchanger rooms with water below and above the salt water mixture room. The heat exchanger rooms are welded together with the salt water mixture room. Heat is transferred to and from the salt water mixture by means of water flowing through the heat exchanger rooms in 16 parallel channels. The length and the width of the module are m and m. The volume of the salt water mixture is 160 l. 4 steel bars inside the salt water mixture room are welded together with the inner surfaces of the room in order to maintain the geometry of the module, and two pipes used to fill in the salt water mixture are located at one end of the module in such a way that the salt water mixture is filled in the module, when the module is in a vertical position. The pipes are placed in such a way, that a part of the salt water mixture will be placed outside the m and m plane. A small brass tank shown in Figure 11 is in good thermal contact attached to the outer surface of the side of the modules. This brass tank, which has a pressure of 5 bar, can be filled with liquid CO 2 from a pressure container. The boiling point of the CO 2 in the brass tank is thus - 78 C. The solidification of the salt water mixture can be started by cooling down a small part of the supercooled salt water mixture to -16 C by boiling a small amount of CO 2 in the small brass tank. The three heat storage modules have been tested in a laboratory heat storage test facility. The following short term tests have been carried out for the modules: Charge tests through the bottom of the modules Charge tests though the bottom and the top of the modules Test periods without charge and discharge Discharge tests through the top of the modules Discharge tests through the top and the bottom of the modules Activation of solidification by boiling CO 2 on outer surface of modules

12 Further, calculations with CFD models have been carried out in order to elucidate the heat exchange capacity rates to and from the salt water mixture for charge and discharge periods with different operation conditions. Furthermore, experience on filling in the salt water mixture in the modules has been gained. The following experience was gained from the investigations: Stable supercooling is achieved in the first and second module if all crystals are melted Supercooling is not achieved in the third module, most likely due the irregular inner surface of the salt water mixture room caused by the 4 steel bars or by unmelted crystals remaining in the pipes used to fill in the salt water mixture The activation of solidification by using boiling CO 2 is reliable No problems on reliability/durability of the salt water mixture so far The measured heat content of the modules is reasonable close to the calculated heat content of the modules The heat exchange capacity rates to and from the first module are far lower than the required 500 W/K, both when using the copper absorbers and by using water in direct contact with the surfaces of the module. The heat exchange capacity rates to and from the second module are close to the required 500 W/K, if both the upper and lower heat exchangers are used. The second module is too heavy to fill in horizontal position. Only 271 kg salt water mixture, corresponding to 208 l, that is 69% of the potential salt water mixture volume of 300 l, was filled in the module. Air remained in the salt water room during the tests. The pressure established by circulation pumps circulating water through the heat exchangers of the second module is so high, that it resulted in deformation of the module, see Figure The heat exchange capacity rates to and from the third module are, assuming that the module is upscaled to 320 l, close to the required 500 W/K.
13 3 Recommendations on design of heat storage modules Based on the test results and experience gained with the modules the following recommendations for the design of heat storage modules can be given: A height of about 5 cm of the salt water mixture room of a heat storage module is suitable. Heat exchangers above and below the salt water mixture room with water rooms with a height of 2 mm and with parallel channels, through which water is flowing, are suitable. The heat exchangers must be point welded to the outer surfaces of the salt water room to make a durable construction. The inner part of the salt water room must be smooth without any equipment to stabilize the construction. The holes used to fill the salt water mixture into the salt water room must be placed at the end of the module, so that the module can be completely filled in a vertical position. The holes must be designed, so that no crystals can be placed outside the dimensions of the salt water mixture room. References [1] Schultz, J.M. and Furbo, S., 2004, Heat of fusion storage systems for combined solar systems in low energy buildings. EuroSun 2004 Congress Proceeding. Freiburg,Germany. [2] Schultz, J.M. and Furbo, S., 2005, Investigation of heat of fusion storage for solar low energy buildings. ISES Solar World 2005 Congress Proceedings. Orlando, USA. [3] Furbo S., Andersen E. and Schultz, J.M., 2006, Advanced storage concepts for thermal systems in low energy buildings. Slutrapport. Report no. SR Department of Civil Engineering, Technical University of Denmark, can be downloaded from: [4] Schultz, J.M. and Furbo, S., 2006, Heat of fusion storage with high solar fraction for solar low energy buildings. EuroSun 2006 Congress Proceedings. Glasgow, Scotland [5] Schultz, J.M. and Furbo, S., 2007, Solar heating systems with heat of fusion storage with 100% solar fraction for low energy buildings. ISES Solar World 2007 Congress Proceedings. Beijing, China. [6] Schultz, J.M., 2008, Type 185. Phase change material storage with supercooling. Department of Civil Engineering, Technical University of Denmark [7] Streicher W. (editor), 2008, Final report of Subtask C Phase Change Materials. The overview. A report from IEA Solar heating and Cooling Programme Task 32 Advanced Storage Concepts for solar and low energy buildings. Report C7 of Subtask C, Can be downloaded from: [8] Schultz J.M., Andersen E. and Furbo S., 2008, Advanced storage concepts for solar and low energy buildings, IEA-SHC Task 32. Slutrapport. Report no. SR Department of Civil Engineering, Technical University of Denmark, can be downloaded from: [9] Streicher, W., Heinz, A., Bony, J., Citherlet, S., Cabeza, L., Schultz, J.M. and Furbo, S., 2008, Results of IEA SHC Task 32: Subtask C: Phase Change Materials. EuroSun 2008 Congress Proceedings. Lisbon, Portugal.
14 Appendix 1 EuroSun 2010 Congress Proceedings.
15 Towards seasonal heat storage based on stable super cooling of sodium acetate trihydrate Simon Furbo *, Janne Dragsted, Ziqian Chen, Jianhua Fan, Elsa Andersen and Bengt Perers Department of Civil Engineering, Technical University of Denmark, Brovej, building 118, DK-2800 Kgs. Lyngby, Denmark * Corresponding Author, sf@byg.dtu.dk Abstract Small scale laboratory experiments have been carried out with the aim of elucidating how best to design a seasonal heat storage based on the salt hydrate sodium acetate trihydrate. The heat storage will be suitable for solar heating systems, which can fully cover the heat demand of low energy buildings under Danish conditions. The heat storage concept is based on the advantage of stable supercooling of the salt hydrate to achieve a partly heat loss free heat storage. Based on the experiments, a laboratory heat storage module was built. The module will be tested in It is expected that a 1000 l laboratory seasonal heat storage will be built and tested in Introduction Theoretical investigations have shown that a 36 m² solar heating system can fully cover the yearly heat demand of a low energy house in Denmark if the solar heating system is based on a 6000 l seasonal heat storage with sodium acetatate trihydrate supercooling in a stable way. The heat storage is divided into a number of separate modules. The heat storage concept is based on the advantage of stable supercooling to achieve a partly heat loss free heat storage. If sodium acetate trihydrate, which has a melting point of 58 C, has been fully melted, it can cool down in its liquid phase to the surrounding temperature and still preserve the latent heat related to the heat of fusion. The heat storage can be left in this state with no heat loss until a heat demand occurs, in which case solidification is activated, the heat of fusion is released, and the heat storage temperature increases almost immediately to the melting point. During participation in the IEA Task 32 project Advanced storage concepts for solar and low energy buildings in the period , a good basis for development of such a seasonal heat storage was established, [1-9]. The investigations described in this paper are carried out within the IEA Task 42 project Compact Thermal Energy Storage: Material Development and System Integration. 2. Small scale laboratory experiments Before designing a seasonal heat storage based on sodium acetate trihydrate, the following questions have to be answered:
16 Which heat storage temperature level is needed during charge periods in order to achieve a stable supercooling of the heat storage material? Can the heat storage material supercool in tanks with large volumes? What is the optimum size of each module consisting of one separate container of the heat storage? How is the supercooled salt solution activated in the most reliable way? How are large quantities of the salt water mixture best filled into the modules of a heat storage? The questions were answered by a number of small scale laboratory experiments. The heat storage material in all the experiments is a mixture of 58% (weight %) NaCH 3 COO and 42% (weight %) water. Experience has shown that this mixture, which has a melting point of 58 C, supercools in a stable way. A large number of experiments with small amounts of the heat storage material placed in small glass containers were carried out. The glass containers were first heated from the ambient temperature to different constant high temperatures in a heating chamber. The glass containers were kept at the constant high temperature for 2 days. After that, the glass containers were left alone at an ambient air temperature of 20 C for a long period. The experiments showed that the mixture supercools in a stable way, as long as the mixture is heated to a temperature not lower than 64 C. If the mixture was heated to a temperature in the interval from 58 C to 64 the mixture did not supercool. 279 kg of the salt water mixture placed in a plastic tank was heated from 20 C to 80 C in a heating closet. By the end of the heating period the temperature of the whole volume of the tank was 80 C. After that, the tank was left alone at an ambient air temperature of 20 C for a long cool down period. The test was repeated many times, and for all tests the salt water mixture supercooled to 20 C without one single failure. The mass of the salt water mixture corresponds, at a salt water mixture temperature of 80 C, to a volume of about 215 l. Obviously, it is not a problem to achieve stable supercooling for a heat storage volume of 215 l. Further, theoretical investigations have shown that an optimum size of each module of a seasonal heat storage for a solar heating system is placed in the interval from 250 l to 500 l, [8]. Based on this, on the experiments with the plastic tank and on practical considerations, it was decided to build and test a laboratory module of a seasonal heat storage with a volume of about 230 l. Small scale laboratory cooling tests were carried out with about 100 g supercooled salt water mixture placed in two small glass containers in order to elucidate the temperature, where supercoling is not longer possible. The glass containers were placed in a freezer and the temperatures of the salt water mixtures were measured. It appear, that the minimum temperature, where the salt water mixture is still supercooled, is placed between -15 C and -16 C. This is in good agreement with earlier investigations [10], [11]. That is, solidification can be started by cooling down a part of the supercooled salt water mixture to a temperature below -16 C. Small scale experiments were carried out using CO 2 in the liquid phase from a pressure container to cool down a part of a supercooled salt water mixture with the temperature 20 C. A schematic sketch of the setup is shown in figure 1. A small cylindrical copper tank with an inner volume of about 1.2 cm 3 is placed in a small glass container with a supercooled salt water mixture. The length of the copper tank is 1.5 cm, and the inner and outer diameters are 1.0 cm and 1.2 cm respectively. From the pressure container the liquid CO 2 can flow through a pipe with a pressure reducing valve into a small pipe which is connected to the cylindrical tank. The cylindrical copper tank is equipped with another small pipe connected to the top of the tank. At the top of this pipe, a back pressure valve and a pipe for gas escape are placed.

17 The pressure reducing valve and the back pressure valve secure that the pressure in the pipe system and the tank is constant at about 5 bar. Liquid CO 2 from the pressure container flows into the cylindrical copper tank, where it boils at about -78 C. Fig. 1. Schematic sketch of the setup used to cool down a part of a supercooled salt water mixture. The liquid CO 2 in the cylindrical copper tank boils at about -78 C due to the heat transfer from the surrounding supercooled salt water mixture. The evaporated CO 2 will escape from the pipe system as gas through the pipe for gas escape. The high latent heat of the phase change from liquid to gas of CO 2 will secure a high heat transfer from the salt water mixture resulting in a strong decrease of the temperature of the salt water mixture in direct contact to the copper tank. Figure 2 shows photos of the setup. The results of the tests with the setup are very promising. A small part of the salt water mixture cools down so quickly that the solidification started 1-2 seconds after starting the CO 2 flow from the pressure container to the piping system. The above described method to start solidification is further investigated: Maybe solidification can be started by cooling a small part of the salt water mixture in a container through the container wall? If that is possible, the inner part of the container can be fully reserved for the salt water mixture making the heat storage design relatively simple and cheap. Instead of a cylindrical copper tank placed in the salt water mixture, a small brass tank is in good thermal contact attached to the outer side of a 2 mm steel plate representing a container wall, see figures 3 and 4. Supercooled salt water mixture with a temperature of 20 C is placed in a glass container separated from the brass tank by the steel plate. The solidification start method described above is investigated by means of tests with this setup. Also for this setup, the method is successful. The solidification started less than 30 seconds after starting the CO 2 flow from the pressure container to the piping system. It is concluded that the solidification start method is promising, and it will be tested in full scale tests.


18 Large quantities of the salt water mixture can be heated in plastic tanks in a heating closet to a temperature of about 80 C. The salt water mixture can then by means of a normal circulation pump and plastic hoses be pumped from the plastic tank into the modules of a heat storage, see figure 5. Further, the plastic tank can be equipped with a pipe connection at the bottom. Such a pipe connection can be used to empty the tank and fill a heat storage module by means of a connecting hose and the gravitational effect. Fig. 2. Photos of the pressure container, the pressure reducing valve, the pipe system and the glass container. Fig. 3. Principle sketch of the setup with cooling through a steel plate.


19 Fig. 4. Photos of the setup with cooling through a steel plate. Fig. 5. Salt water mixture from a plastic tank pumped into a heat storage module. 3. Laboratory heat storage module A laboratory heat storage module with a salt water mixture volume of about 230 l was built. Figure 6 shows a schematic sketch of the heat storage module with approximated dimensions in mm. The module material is steel and the wall thickness is 2 mm. Both the upper and lower surfaces of the flat module are used as heat transfer areas for heat transfer to and from the module. Water, which is used as the heat transfer fluid, is pumped through two copper absorbers placed below and above the module as shown in figure 7. Wooden slats are placed above and below the absorber strips in such a way that there will be a good thermal contact between the fins and the module surfaces. The construction is insulated with 100 mm mineral wool.
20 Fig. 6. Principle sketch of heat storage module with two holes used to fill in the salt water mixture. 1: Wooden slats. 2: Salt water mixture in steel module. 3 & 9: Copper pipes. 4 & 8: Absorber fin. 5: Mineral wool. 6: Bottom of module. 7: Paste with good thermal conductivity. Fig. 7. Principle sketch of heat storage module with heat transfer system and insulation. The module is filled with 305 kg salt water mixture corresponding to a module volume of about 230 l. Figure 8 shows photos of the module inclusive thermocouples for measurements of the module surface temperatures. The flat module is placed with a small tilt from horizontal. A small brass tank is in good
21 thermal contact attached to the outer side of the module wall at the lowest part of the module. In this way the solidification start method described in section 2 can be tested. 4. Planned activities Fig. 8. Photos of the heat storage module. The laboratory heat storage module described in section 3 will be tested in a heat storage test facility. It will be elucidated if the salt water mixture will supercool. The CO 2 solidification start method will be tested in full scale and the heat storage capacity and heat loss of the module will be determined. Further, the heat exchange capacity rate during charge and discharge for the heat storage module will be determined, both with heat transfer through one and two module surface(s). Based on the tests and on the experience from operation of the module, recommendations for the design of a seasonal heat storage will be given. Among other things, suitable module and heat exchanger designs and materials will be determined. It will also be elucidated which control system is most suitable for the heat storage. A 1000 l laboratory heat storage will be built based on these recommendations. The heat storage will be tested in a laboratory test facility. The operation of the heat storage will be simulated as if the heat storage is a part of a solar heating system.
22 5. Conclusions Small scale laboratory experiments have elucidated that a salt water mixture of 58% NaCH 3 COO and 42% water with a melting point of 58 C supercools in a stable way as long as it is heated to 64 C during charge periods. The salt water mixture supercool in a stable way in tanks with a volume of 215 l. A solidification start method based on a cooling of a small part of the salt water mixture to a temperature level below -16 C was developed. This cooling is based on boiling CO 2 in a tank attached in a good thermal contact to the outer surface of the heat storage module in which the salt water mixture is placed. Based on the experiments a laboratory heat storage module with a salt water mixture volume of 230 l was built. The module will be tested in It is expected that a 1000 l laboratory seasonal heat storage will be built and tested in References [1]J.M. Schultz, S.Furbo, Heat of fusion storage systems for combined solar systems in low energy buildings. EuroSun 2004 Congress proceedings, Freiburg, Germany (2004). [2]J.M. Schultz, S.Furbo, Investigation of heat of fusion storage for solar low energy buildings. ISES Solar World 2005 Congress proceedings, Orlando, USA (2005). [3]S.Furbo, E.Andersen, J.M. Schultz, Advanced storage concepts for solar thermal systems in low energy buildings. Slutrapport. Department of Civil Engineering, Technical University of Denmark, report no. SR (2006). Can be downloaded from: [4]J.M. Schultz, S.Furbo, Heat of fusion storage with high solar fraction for solar low energy buildings. EuroSun 2006 Congress proceedings, Glasgow, Scotland (2006). [5]J.M. Schultz, S.Furbo, Solar heating systems with heat of fusion storage with 100% solar fraction for low energy buildings. ISES Solar World 2007 Congress proceedings. Beijing, China (2007). [6]J.M. Schultz, Type 185. Phase change material storage with supercooling. Department of Civil Engineering, Technical University of Denmark (2008). [7]W.Streicher (editor), Final report of Subtask C Phase Change Materials. The overview. A report from IEA Solar Heating and Cooling Programme Task 32. Advanced Storage Concepts for solar and low energy buildings. Report C7 of Subtask C (2008). Can be downloaded from: [8]J.M.Schultz, E.Andersen, S.Furbo, Advanced storage concepts for solar and low energy buildings, IEA-SHC Task 32. Slutrapport. Department of Civil Engineering, Technical University of Denmark, report no. SR (2008). Can be downloaded from: [9]W.Streicher, A.Heinz, J.Bony, S.Citherlet, L.Cabeza, J.M.Schultz, S.Furbo, Resuts of IEA SHC Task 32: Subtask C: Phase Change Materials. EuroSun 2008 Congress proceedings, Lisbon, Portugal (2008). [10]T.Freitag, A latent heat storage procedure based on supercooled salt solutions. Technische Thermodynamik, Technische Universität Chemnitz, Germany. IEA-Workshop Advanced Solar Thermal Storage Systems, Helsinki (1998). [11]M.A. Rogerson, S.S.S. Cardoso, Solidification in Heat Packs: 1. Nucleation Rate. AIChE journal, volume 49, Issue 2, p (2004).
23 Appendix 2 ISES Solar World Congress 2011
24 Department of Civil Engineering, Technical University of Denmark, Kgs. Lyngby, Denmark Theoretical studies have shown that a 36 m² solar heating system can fully cover the yearly heat demand of a low energy house in Denmark if the solar heating system is based on a 6000 l seasonal heat storage with a sodium acetate water mixture supercooling in a stable way. The heat storage is divided into a number of separate modules. The heat storage concept is based on the advantage of stable supercooling to achieve a partly heat loss free heat storage. If a sodium acetate water mixture, which has a melting point of 58 C, has been fully melted, it can cool down in its liquid phase to the surrounding temperature and still preserve the latent heat related to the heat of fusion. The heat storage can be left in this state with no heat loss until a heat demand occurs, in which case solidification is activated, the heat of fusion is released, and the heat storage temperature increases almost immediately to the melting point. The investigations of a seasonal heat storage module described in this paper are carried out within the IEA Task 42 project Compact Thermal Energy Storage: Material Development and System Integration. A flat laboratory heat storage module described by Furbo et al. (2010) is investigated experimentally. Figure 1 shows a schematic sketch of the heat storage module with approximated dimensions in mm. The module is filled with 305 kg salt water mixture consisting of 58% (weight%) sodium acetate and 42% (weight%) water. The volume of the salt water mixture is about 234 l. The salt water mixture is used, since it supercools in a stable way. Investigations by Furbo (1978) have shown that a salt water mixture of 58% NaCH 3 COO and 42% water can be used in tanks made from steel without a risk of corrosion. The module material is therefore steel and the wall thickness is 2 mm. Both the lower and upper surfaces of the flat module can be used as heat transfer areas for heat transfer to and from the module. Two different heat transfer methods for the heat storage module are investigated. Water is for both methods used as heat transfer fluid. For the first heat transfer method, water can be pumped through two copper absorbers placed below and above the module as shown in figure 2. Heat is transferred from/to the salt water mixture, to/from the upper or lower module surface, the copper absorber and the water flowing through the absorber. Wooden slats are placed above and below the absorber strips in such a way that there will be thermal contact between the absorber fins and the module surfaces. A paste with a good thermal conductivity is placed between the copper absorbers and the upper and lower surfaces of the heat storage module. The construction is insulated with 100 mm mineral wool. Fig. 1: Principle sketch of heat storage module with two holes used to fill in the salt water mixture.
25 1: Wooden slats. 2: Salt water mixture in steel module. 3 & 9: Copper pipes. 4 & 8: Absorber fin. 5: Mineral wool. 6: Bottom of module. 7: Paste with good thermal conductivity. Fig. 2: Principle sketch of heat storage module with absorber heat transfer system and insulation. Figure 3 shows photos of the heat storage module investigated by means of the first heat transfer method. Thermocouples for measurements of the module surface temperatures are placed both on the upper and lower surfaces of the heat storage module. Figure 4 shows photos of the heat storage module using the second heat transfer method. The heat storage module is placed in a stainless steel container with small separate rooms for water below and above the module. Silicone pipes are attached to the upper and lower surfaces of the module in such a way, that water pumped through the separate rooms will flow through the rooms in a serpentine way, guided by the silicon pipes. The water will therefore flow through the lower room in direct contact with all parts of the lower module surface, and water will flow through the upper room in direct contact with all parts of the upper module surface. Heat is transferred from/to the salt water mixture, to/from the upper or lower module surface and the water flowing through the upper or lower room. The flat module is placed with a small tilt from horizontal. A small brass tank shown in figure 5 is in good thermal contact attached to the outer surface of the side of the module. This brass tank, which has a pressure of 5 bar, can be filled with liquid CO 2 from a pressure container. The boiling point of the CO 2 in the brass tank is thus -78 C. As described by Furbo et al. (2010), the solidification of the salt water mixture can be started by cooling down a small part of the supercooled salt water mixture to -16 C by boiling a small amount of CO 2 in the small brass tank.

26 Fig. 3: Photos of the heat storage module with a copper absorber used for the heat transfer. Fig. 4: Photos of the heat storage module with silicone pipes attached to the upper surface.

27 Fig. 5: Brass tank with CO 2 used for starting the solidification. The heat storage module has been tested in a laboratory heat storage test facility for the two heat transfer methods described in section 2. The module has been charged through the bottom surface of the module and discharged through the top surface. The module has also been tested in periods without charge and discharge. The activation of solidification of the supercooled salt water mixture by boiling CO 2 at the outer surface of the module has been tested. Finally, charge and discharge tests through both the bottom and top surfaces of the module have been carried out for the module for the heat transfer method using the copper absorbers by the heat transfer. The module was investigated through a period of about 1 year. The results and experience of the investigations are summarized in sections 3.1, 3.2 and Supercooling and solidification start method for supercooled salt water mixture The investigations showed that the salt water mixture supercools if all the salt hydrate crystals of the heat storage module are melted during the charge period. If the whole volume of the salt water mixture is not heated to a minimum temperature of 64 C for a period of at least one day, the supercooling will not be stable. The solidification start method using boiling CO 2 in good thermal contact with the outer surface of the heat storage module is reliable. The solidification started in all cases about 1 minute after the liquid CO 2 entered into the brass tank. However, it must be mentioned that the placement of the brass tank with the liquid CO 2 is of vital importance for the suitability of the method. The solidification start method does not work if the brass tank is placed at the very bottom of the tilted module. The reason is most likely that phase separation takes place in the heat storage module in such a way that anhydrous salt is placed at the very bottom of the tilted module and a non saturated salt water solution is placed in the upper part of the tilted module. A strong cooling of the anhydrous salt at the bottom of the module caused by the boiling CO 2 will not start the solidification, because the anhydrous salt at the bottom of the module is not in contact with the water, which should be used to form the salt hydrate crystals. 3.2 Heat content of heat storage module and reliability The tests showed that the measured heat content of the heat storage module is as high as the theoretically calculated heat content of the heat storage module. For instance, for the heat transfer method using the absorbers, the measured heat content for the module is about 38 kwh in the temperature interval from 25 C to 82 C. This corresponds reasonably well to the theoretically calculated heat content of the 305 kg salt water mixture, the 90 kg steel of the heat storage module, the 26 kg copper of the absorbers and of the 4.6 kg water in the absorbers: = 36 kwh.
28 Based on the good agreement between the measured and the calculated heat content of the heat storage module, it is concluded that only a small part of the salt water mixture does not take part in the phase change due to the phase separation problem mentioned in section 3.1. It should also be mentioned that during the whole measuring period there are no signs of problems with reliability or durability. 3.3 Heat exchange capacity rate Theoretical calculations by Schultz and Furbo (2007) have shown that the heat exchange capacity rates both for charge and discharge of a seasonal heat storage module for solar heating systems fully covering the yearly heat demand of low energy buildings must be around 500 W/K. The tested heat storage module has an approximate volume of 234 l, corresponding to about half the volume of a suitable heat storage module for a real seasonal heat storage. It is therefore estimated that the heat exchange capacity rate for the investigated heat storage module must be around 250 W/K. Figures 6, 8 and 10 show measured temperatures and figures 7, 9 and 11 shows measured heat exchange capacity rates for charge and discharge periods for the heat storage module using the heat transfer method with the absorbers. Figure 6 shows inlet and outlet temperatures for the water flowing through the lower absorber as well as temperatures for the upper surface of the heat storage module during a charge period where heat is only transferred from the lower absorber to the heat storage module. The volume flow rate of the water flowing through the absorber is 6.2 l/min. Figure 7 shows the heat exchange capacity rate during the same charge period. The heat exchange capacity rate is determined with the assumption that the measured mean temperature of the upper surface of the heat storage module is equal to the temperature of the salt water mixture. Temperature [ C] Charge through bottom surface l/min Time [h] Tin Tout T-surface, top 1 T-surface, top 2 T-surface, top 3 T-surface, top 4 T-surface, top 5 T-surface, top 6 T-surface, top 7 T-surface, top 8 T-surface, top 9 Fig. 6: Measured inlet and outlet temperatures for water flowing through the lower absorber with a volume flow rate of 6.2 l/min and 9 temperatures at the upper surface of the module during a charge period through the bottom surface.
29 140 Charge through bottom surface l/min Heat exchange capacity rate [W/K] Heat exchange capacity Time [h] Fig. 7: Measured heat exchange capacity rate for a charge period with water flowing through the lower absorber with a volume flow rate of 6.2 l/min. The heat exchange capacity rate during the charge period is about W/K, which is about a factor of 5 too low. Figure 8 shows inlet and outlet temperatures for the water flowing through the upper absorber as well as temperatures for the lower surface of the heat storage module during a discharge period where heat is only transferred from the heat storage module to the upper absorber. The volume flow rate of the water flowing through the absorber is 4.2 l/min and the salt water mixture is in liquid phase, that is: The salt water mixture is supercooled for the last part of the discharge. Figure 9 shows the heat exchange capacity rate during the same discharge period. The heat exchange capacity rate is determined with the assumption that the measured mean temperature of the lower surface of the heat storage module is equal to the temperature of the salt water mixture. Temperature [ C] Discharge through top surface 4.2 l/min Time [h] Tin Tout T-surface, bottom 1 T-surface, bottom 2 T-surface, bottom 3 T-surface, bottom 4 T-surface, bottom 5 T-surface, bottom 6 T-surface, bottom 7 T-surface, bottom 8 T-surface, bottom 9 Fig. 8: Measured inlet and outlet temperatures for water flowing through the upper absorber with a volume flow rate of 4.2 l/min and 9 temperatures at the lower surface of the module during a discharge period through the upper surface. The salt water mixture is in the liquid phase.
30 100 Discharge through top surface 4.2 l/min Heat exchange capacity rate [W/K] Heat exchange capacity Time [h] Fig. 9: Measured heat exchange capacity rate for a discharge period with water flowing through the upper absorber with a volume flow rate of 4.2 l/min and with the salt water mixture in the liquid phase. The heat exchange capacity rate during the discharge period is about W/K, which is about a factor of 8 too low. Figure 10 shows inlet and outlet temperatures for the water flowing through the upper absorber as well as temperatures for the lower surface of the heat storage module during a discharge period, where heat is only transferred from the heat storage module to the upper absorber. The volume flow rate of the water flowing through the absorber is 7.4 l/min, and the solidification of the salt water mixture is started in the beginning of the discharge. Figure 11 shows the heat exchange capacity rate during the same discharge period. The heat exchange capacity rate is determined with the assumption that the measured mean temperature of the lower surface of the heat storage module is equal to the temperature of the salt water mixture. Temperature [ C] Discharge through top surface l/min Tin Tout T-surface, bottom 1 T-surface, bottom 2 T-surface, bottom 3 T-surface, bottom 4 T-surface, bottom 5 T-surface, bottom 6 T-surface, bottom 7 T-surface, bottom T-surface,bottom 9 Time [h] Fig. 10: Measured inlet and outlet temperatures for water flowing through the upper absorber with a volume flow rate of 7.4 l/min and 9 temperatures at the lower surface of the module during a discharge period through the upper surface. The solidification of the salt water mixture is activated in the start of the discharge.
31 100 Discharge through top surface l/min Heat exchange capacity rate [W/K] Heat exchange capacity Time [h] Fig. 11: Measured heat exchange capacity rate for a discharge period with water flowing through the upper absorber with a volume flow rate of 7.4 l/min and with solidification of the salt water mixture. The heat exchange capacity rate during the discharge period is about W/K, which is about a factor of 12 too low. It is concluded that the heat exchange capacity rates are too low, as long as only one absorber is used during charge and discharge. Measurements showed that the heat exchange capacity rates both for charge and for discharge are increased by using both the lower and the upper absorber during charge and discharge. However, the heat exchange capacity rates are still far too low. For instance, for the discharge with the solidifying salt water mixture, the heat exchange capacity rate is a factor of 6 too low, even if both absorbers are used. Most likely, the main reason for the poor heat exchange capacity rate is a poor thermal contact between the flat absorbers below and above the heat storage module and the surfaces of the module. The poor thermal contact is caused by the balloon effect of the heat storage module illustrated in figure 12. The density of the salt water mixture is a strong function of the temperature and whether the mixture is in the liquid or solid phase. The higher the temperature, the lower the density is. The module is schematically shown at a low (left) and a high (right) temperature in figure 12. The expansion of the salt water mixture at high temperatures will result in a balloon shape of the steel module. It is obvious that flat absorbers placed below and above the module will have a decreased thermal contact with the module surfaces at high temperatures, resulting in decreased heat exchange capacity rates. Fig. 12: Schematic sketch of heat storage module at a low temperature (left) and a high temperature (right). The heat exchange capacity rates for the heat storage module using the heat transfer method with water in direct contact with the module surfaces are investigated by Fan et al. (2011). The heat exchange capacity rates are determined for charge periods with heat transfer from water flowing through the room below the heat storage module to the heat storage module and for discharge periods with heat transfer from the heat storage module to water flowing through the room above the heat storage module. The investigations show that the heat exchange capacity rates for the heat transfer method with water in direct contact with the module surfaces are higher than the heat exchange capacity rates for the heat transfer method using the absorbers. However, the heat exchange capacity rates are about a factor of 3 too low, both

32 for charge and discharge periods. Further, it is estimated, that if the heat is transferred both by means of water flowing through the upper and the lower room, the heat exchange capacity rates will still be a factor of 1.5 too low for charge periods and for discharge periods. Based on the investigations, it is therefore concluded, that the heat transfer areas for the heat storage module are too small. Small scale experiments with a salt water mixture consisting of 58% NaCH 3 COO and 42% water are carried out with the aim to elucidate if the height of the salt water mixture in a heat storage module will result in phase separation problems during a long heat storage period. The salt water mixture is placed in small glass containers with heights of the salt water mixture of 3 cm, 5 cm and 8 cm. The glasses are heated to 80 C. After this heating period the glasses are placed in a room with an air temperature of about 20 C for 1 month. Figure 13 shows photos of the supercooled salt water mixture in the three glasses. The solidification of the supercooled salt water mixture was initiated after 1 month by cooling the glasses in a freezer to a temperature below -16 C. After that the glasses are placed in a room at an ambient temperature of about 20 C. The glass with the salt water mixture height of 8 cm contain a small liquid volume, while none of the other two glasses contain any visible liquid volume after the solidification. This experiment indicates that phase separation problems will appear if the salt water mixture height is 8 cm, and that phase separation problems will not appear as long as the height is not higher than 5 cm, at least for a heat storage period of 1 month. A similar experiment with a 6 months heat storage period is ongoing. Fig. 13: Photos of glasses with 3 different heights of supercooled salt water mixture. The investigations showed that the heat storage module works satisfactorily with regard to heat storage capacity, stable supercooling, activation of solidification and reliability. The investigations also showed that the heat exchange capacity rate to and from the heat storage module is too low, and that the heat transfer areas of the heat storage module are too small. Further, preliminary small scale investigations indicate that phase separation problems will not decrease the durability of the heat storage module as long as the height of the module is not larger than 5 cm. Based on the investigations, a new 300 l flat heat storage module with increased heat transfer areas will be constructed. The heat storage module material will be steel, and the thickness of all steel walls will be 2 mm. The height of the salt water mixture in the heat storage module will be 5 cm, and there will be rooms with vertical heights of 2 mm above and below the salt water tank. Water can be pumped through the rooms in a serpentine way, and heat can be transferred to and from the salt water mixture from and to the water flowing through both rooms.
33 The heat storage module will be tested in the laboratory during the winter It is hoped that the heat storage module will have good thermal characteristics inclusive sufficiently high heat exchange capacity rates. Experimental investigations of a 234 l seasonal heat storage module based on a salt water mixture consisting of 58% NaCH 3 COO and 42% water as heat storage material have been carried out. The salt water mixture has a melting point of 58 C. The investigations showed that the salt water mixture will supercool in a stable way if all salt hydrate crystals in the heat storage module are melted during the charge period, that a method to activate solidification of the supercooled salt water mixture using boiling CO 2 in a small tank attached to the outer surface of the heat storage module is reliable, that the heat content of the heat storage module is as high as theoretically calculated, and that the durability of the heat storage module is good. The investigations also showed that the heat exchange capacity rate to and from the heat storage module is too low, and that heat transfer areas of the heat storage module are too small. Based on the investigations, a new 300 l flat heat storage module with increased heat transfer areas will be constructed. It is hoped that the new heat storage module will have good thermal characteristics inclusive sufficiently high heat exchange capacity rates. Furbo, S., Dragsted, J., Chen, Z., Fan, J., Andersen, E., Perers, B., Towards seasonal heat storage based on stable supercooling of sodium acetate trihydrate. EuroSun 2010 Congress Proceedings, Graz, Austria. Furbo, S., Investigations of heat storages with salt hydrate as storage medium based on the extra water principle. Thermal Insulation Laboratory, Technical University of Denmark, report no. 80. Schultz, J.M., Furbo, S., Solar heating systems with heat of fusion storage with 100% solar fraction for low energy buildings. ISES Solar World 2007 Congress proceedings. Beijing, China. Fan, J., Furbo, S., Chen, Z., Andersen, E., Perers, B., Heat transfer capacity of a heat exchanger module for seasonal heat storage. ISES Solar World Congress 2011 Proceedings, Kassel, Germany.
34 Appendix 3 ISES Solar World Congress 2011 Proceedings.
35 Theoretical investigations have shown that a solar heating system with a collector area of 36 m² can fully cover the yearly heat demand of a low energy house in Denmark if the solar heating system is based on a 6000 l seasonal heat storage with sodium acetate trihydrate (SAT) supercooling in a stable way. The heat storage is divided into a number of separate modules. As shown in Fig. 1, a sandwich heat storage test module has been built with the phase change material (PCM) storage box in between two plate heat exchangers. The plate heat exchanger at the top of the PCM storage box is used for discharge of the module while the plate heat exchanger at the bottom is used for charge of the module. The test module has a length of approx mm and a width of approx mm. The height of the plate heat exchangers is 13 mm. Fluid flow in the plate heat exchangers are regulated by a number of parallel baffles. Thermal experiments have been carried out to investigate the heat exchange capacity rates from and to the PCM module. Charge of the PCM module is investigated with solid phase SAT and with supercooled liquid phase SAT as initial condition. Discharge of the PCM module with and without the presence of crystallization is studied. Fluid flow and heat transfer in the test module are theoretically investigated by Computational Fluid Dynamics (CFD) calculations. The heat transfer rates between the PCM box and the heating fluid/cooling fluid in the plate heat exchangers are determined. The CFD calculated temperatures are compared to measured temperatures. Based on the studies, recommendations on how best to transfer heat to and from the seasonal heat storage module will be given. Theoretical calculations by Schultz and Furbo (2007) have shown that the heat exchange capacity rates both for charge and discharge of a seasonal heat storage module for solar heating systems fully covering the yearly heat demand of low energy buildings must be around 500 W/K. The tested heat storage module based on stable supercooling of sodium acetate trihydrate (SAT) has an approximate volume of 234 l, corresponding to about half the volume of a suitable heat storage module for a real seasonal heat storage. It is therefore estimated that the heat exchange capacity rate for the investigated heat storage module must be around 250 W/K. A flat laboratory heat storage module described by Furbo et al. (2010) is investigated experimentally. Figure 1 shows a photo of the heat storage module. The module is filled with 305 kg salt water mixture consisting of 58% (weight%) sodium acetate and 42% (weight%) water. The volume of the salt water mixture is about 234 l. The salt water mixture is used, since it supercools in a stable way. Investigations by Furbo (1978) have shown that a salt water mixture of 58% NaCH 3 COO and 42% water can be used in tanks made from steel without a risk of corrosion. The module material is therefore steel and the wall thickness is 2 mm. The test module has a length of approx mm and a width of approx mm. The height of the plate heat exchangers is 13 mm. The aim of the investigations is to determine the heat exchange capacity rate of the PCM module during charge and discharge. A plate heat exchanger is mounted at the top of the PCM storage module for discharge of the module while a plate heat exchanger is mounted at the bottom for charge of the module. In order to avoid dead zones and uneven flow distribution, a number of parallel silicon pipe baffles are installed in the flat plate heat exchangers to regulate the fluid flow. During charge of the module, hot water flows into the bottom plate heat exchanger and transfers heat to the PCM module through the bottom surface of the module, whereas during discharge of the module cold water flows into the upper plate heat exchanger and absorbs
36 heat through the upper surface of the PCM module. The sandwich like heat storage module is insulated with mineral wool or insulation foam on all external surfaces of the module. The water volume flow rate during charge and discharge of the module is regulated by a circulation pump and a valve. The circulating flow rate, in the range of l/min, is measured using a Brunata type HGQ1- R0 flow meter. The inlet and outlet water temperatures of the heat exchangers are measured by copperconstantan thermo couples (type TT). The temperature of the PCM store can not be measured directly since insertion of temperature sensors into the store prevents stable supercooling of SAT and must therefore be avoided. The temperature of the PCM store can be estimated by measurement of temperatures on the surfaces of the store. The surface temperatures of the PCM store are measured by 12 equally spaced thermocouples (type TT) with 6 sensors attached to the upper surface and 6 sensors attached to the bottom surface of the store. The data collection and control program IMPVIEW is used to log the fluid flow rate, the inlet and outlet temperatures of the heat exchanger, the surface temperatures of the PCM store and the ambient temperature during the test period. The accuracy of the flow rate measurement is ± 1 % while the accuracy of the type TT thermocouples is ± 0.5 K. Fig. 1: Photo of the PCM heat storage test module with plate heat exchangers at the top and the bottom. Computation fluid dynamics calculations are carried out to theoretically investigate the fluid flow and heat transfer in the heat storage module during charge and discharge. Simplified heat storage models (charge model and discharge model) are built using the commercial CFD code Ansys (Fluent) 13 (2010). The charge model includes the PCM box and the flat plate heat exchanger mounted at the bottom surface of the PCM box while the heat exchanger at the top of the PCM box is an inactive component and thus not considered, see Fig. 2. During charging, the hot water enters into the plate heat exchanger through an inlet opening located in one corner of the exchanger and leaves the heat exchanger through an outlet opening in the opposite corner. Water flow in the heat exchanger is regulated by 18 equally spaced guiding baffles, resulting in a serpentine flow pattern. The height of the water passage is 13 mm. The heat loss coefficient of the PCM storage module is determined by measurements and used as an input to the CFD models. The measured mean ambient air temperature during the experiment is used as free stream temperature of the module surfaces in the CFD models. In this way, the CFD model takes into account the heat loss from the storage module. The discharge model includes the PCM box and the flat plate heat exchanger mounted at the upper surface of the PCM box while the heat exchanger at the bottom of the PCM box is excluded. Mesh of the PCM module during charge is shown as an example in Fig. 3. Fig. 3(A) shows mesh at the horizontal plan of the module. The serpentine flow passage created by the guiding baffles is meshed with high quality hexahedral elements with an interval size of 0.01 mm. Mesh at a vertical cut plane in one corner of the module is shown as View A in Fig. 3(B). The model includes the PCM box at the top and the heat

 Mesh at the horizontal plan of the module (B) Mesh of the module View A Fig.")
37 exchanger at the bottom. A denser mesh is applied to the heat exchanger where a larger temperature/velocity gradient is expected. The mesh close to the walls is refined in order to capture the large temperature/velocity gradients in the near wall regions. In between the PCM box and the heat exchanger, there is a steel wall meshed with one node. Both vertical and horizontal conductive heat transfer in the solid steel wall are considered. The model has a mesh with approx cells in total. Fig. 2: CFD model of the PCM module during charge. (A) Mesh at the horizontal plan of the module (B) Mesh of the module View A Fig. 3: Mesh of the PCM module during charging. During charge and discharge of the module, phase transitions of SAT between solid and liquid phase will have a significant influence on the heat transfer in the PCM module. Due to the complexity of a multi-phase CFD model, it is however desirable to start the investigation with simplified single liquid phase and single solid phase models. A CFD model of single phase liquid PCM and a model of single phase solid PCM are built. Properties of liquid mixture of 42% (weight) water and 58% (weight) NaCH3COO and their dependences on temperature are shown as follows [Yoon etc. 2000, Araki etc. 1995]: Density, [kg/m 3 ] = * T (1)
38 Specific heat, [J/(Kg.K)] C p * T (2) Thermal conductivity, [W/(mK)] 2 (3) Dynamic viscosity, [kg/(ms)] * T (4) where T is fluid temperature, [K]. Properties of solid PCM and their dependences on temperature are shown as follows [Araki etc. 1995]: where T is fluid temperature, [K]. Water is used to charge and discharge the PCM module. Properties of water and their dependences on temperature are shown as follows: where T is fluid temperature, [K] * T * T The steel wall has a thermal conductivity of 60 W/K/m and a density of 7850 kg/m 3. Investigation is carried out to determine the influence of time step size on predicted heat exchange capacity rate between the PCM store and water. Fig. 4 show CFD predicted heat exchange capacity rates of a discharge test with a volume flow rate of 5.4 l/min and a constant inlet temperature of 13.9ºC. The test starts with an initially uniform temperature of 75ºC. It is shown that the increase of the time step size from 3 s to 30 s does not influence the predicated heat exchange capacity rate. Further increase of the time step size to 60 s shows a slight variation of predicted heat exchange capacity rate in the first half hour of the test. Increase of the time step size to 120 s shows a remarkable change of predicted heat exchange capacity rate in the first hour of the test. It can be concluded that the best time step size is 30 s. Density, [kg/m 3 ] Constant = 1530 Specific heat, [J/(Kg.K)] C p * T (5) Thermal conductivity, [W/(mK)] Constant = 0.6 Density, [kg/m 3 ] 2 = *T *T (6) Dynamic viscosity, [kg/(ms)] *( ) (7) Thermal conductivity, [W/(mK)] T * T (8) Fig. 4: The influence of time step size on heat exchange capacity rate during a discharge. Since water flow in the plate heat exchanger mostly falls in the transitional or turbulent region, RNG modified k- turbulent model is used in the CFD calculations. Fluid flow in the PCM box is calculated with a laminar model. Transient CFD calculations are performed with an initially standstill module (all fluid velocities are zero) and a uniform temperature. The PRESTO and second order upwind method are used for the discretization of the pressure and the momentum equations respectively. The SIMPLE algorithm is used to treat the pressure-velocity coupling. The calculation is considered convergent if the scaled residual for the continuity equation, the momentum equations and the energy equation are less than , and respectively. One calculation takes approximately hours for a computer with 2 3 GHz CPU
39 frequency and 4G memory. In order to determine the heat exchange capacity rate from and to the PCM module, charge and discharge test of the PCM module have been carried out with different volume flow rates. Power of heat exchange and heat exchange capacity rate between water and the PCM store are determined. The power of heat exchange between the charging/discharging flow and the PCM store, P, is determined by equation (9). = (9) Heat exchange capacity rate, H, is determined by equation (10). = 1 (10) H is heat exchange capacity rate in W/K. V is the volume flow rate of the charging/discharging flow in m 3 /s. C p 3. T f, T r and T s is respectively the inlet temperature, outlet temperature of the charging/discharging flow and temperature of the PCM store. Temperature of the PCM store, T s, cannot be measured directly in the experiment due to the fact that insertion of temperature sensors in the PCM store prevents stable supercooling of the PCM and therefore must be avoided. Temperature of the PCM store is measured indirectly by temperature sensors attached to the upper and the bottom surface of the module. During charging of the PCM store, temperature of the PCM store can be estimated by an average of all surface temperatures or by an average of upper surface temperatures. Due to the relatively low thermal conductivity of the solid phase and liquid phase sodium acetate tri-hydrate, it is expected that heat transfer within the PCM material contributes to most of the thermal resistance of the module while the heat transfer between the steel wall and the circulating water has a much smaller thermal resistance. Therefore the bottom surface temperature of the steel wall is almost the same as the mean water temperature during the test. Before the PCM material is fully melted, the heat will be used to melt the PCM material, resulting in a stepwise temperature change in the store. Average of all surfaces temperatures of the module, T mean, therefore overestimates temperature of the module, whereas average of the upper surface temperatures, T upper, underestimates temperature of the PCM module. 4.1 Charge of solid phase PCM Charge of the PCM module has been investigated at a volume flow rate of 3.4 l/min, 4.9 l /min and 6.3 l/min respectively. The charge test starts with a uniform module temperature of 17-21ºC and with a constant water inlet temperature of 77-80ºC. Fig. 5-6 show the charging power versus temperature of the PCM store at charging volume flow rates of 3.4 l/min and 6.3 l/min respectively. At the start of the charging process the power reaches up to W followed by a rapid decrease to approx W. The extremely large charging power can be explained by the replacement of cold water by hot water in the heat exchanger in the start of the test. It can be seen from Fig. 5-6 that for the same charging power the PCM store temperature T mean is higher than the temperature T upper. In the start of the charging process, the difference between T mean and T upper reaches up to 30K. The difference decreases gradually with melting of the PCM material. When the store temperature is in the range of 50-60ºC, the difference between T mean and T upper becomes insignificant. The charging power decreases gradually with increase of the PCM store temperature. With an increase of the charging volume flow rate, the charging power at the later stage of the charging process increases. The CFD predicted power versus temperature of the PCM store is shown as circles in Fig. 5 and 6. For the same temperature of the store, the CFD predicted power of a solid phase PCM module is higher than the power determined based on T upper while it is lower than the power determined based on T mean. The CFD predicted power of liquid phase PCM is higher than the measured power. The viscosity of the liquid phase PCM could be underestimated by equation 4 in the CFD calculations, resulting in an overestimated convective heat transfer and a higher charging power. The disagreement could be caused by errors in the experiments. However these theories need to be confirmed in future investigations.
. Fig. 7 and 8 show heat exchange capacity rate versus temperature of the PCM store for volume flow rates of 3.")
40 Fig. 5: Charging power vs. temperature of the PCM store for a volume flow rate of 3.4 l/min. Fig. 6: Charging power vs. temperature of the PCM store for a volume flow rate of 6.3 l/min. Heat exchange capacity rate of the PCM module is determined using equation (10). Fig. 7 and 8 show heat exchange capacity rate versus temperature of the PCM store for volume flow rates of 3.4 l/min and 6.3 l/min respectively. The heat exchange capacity rate of solid phase PCM lies in the range of W/K. In the very start of the test, the heat exchange capacity rate is within W/K due to large thermal capacity of the PCM module and replacement of the cold water in the heat exchange by inlet hot water. The heat exchange capacity rate determined based on T mean decreases from 150 W/K to 75 W/K with increase of the PCM store temperature from 40ºC to 58ºC while the heat exchange capacity rate determined based on T upper firstly decreases to 40 W/K and keeps almost constant until the temperature of the PCM store reaches 45-48ºC. The heat exchange capacity rates determined based on the two PCM store temperatures tend to be the same for a store temperature close to 58ºC. The CFD predicted heat exchange capacity rate of solid PCM is higher than the heat exchange capacity rate determined by T upper and lower than that determined by T mean. The difference between the CFD calculated and the measured capacity rate can be explained by the incorrect representation of store temperature of either T upper or T mean. Fig. 7: Heat exchange capacity rate vs. temperature of the PCM store for a volume flow rate of 3.4 l/min. The heat exchange capacity rate of a liquid phase PCM store determined based on T mean is in the range of 75 W/K-150 W/K while it is in the range of W/K if T upper is used to plot heat exchange capacity rate. When the store temperature is higher than 58ºC, the PCM in the store should be in a liquid phase which

41 should give a higher convective heat transfer rate, however the measurements show that the heat exchange capacity rate of a liquid phase PCM determined based on T mean is only slightly higher than the capacity rate of a solid phase PCM. The heat exchange capacity rate determined based on T upper decreases slightly. There is a need for further investigations to detect the reasons. The CFD predicted heat exchange capacity rate of liquid PCM is higher than the measured capacity rates. Fig. 8: Heat exchange capacity rate vs. temperature of the PCM store for a volume flow rate of 6.3 l/min. The measured heat exchange capacity rates of a solid PCM for different charging volume flow rates are summarized in Fig. 9. It is shown that the charging volume flow rate has an insignificant influence on the heat exchange capacity rate of a solid phase PCM store. This implies that the heat transfer in the heat exchanger is not critical and thus have a minor influence on the heat exchange capacity rate between water and the PCM store. Fig. 9: Measured heat exchange capacity rate vs. temperature of the PCM store for different volume flow rates. The CFD predicted heat exchange capacity rates for different charging volume flow rates are shown in Fig. 10. It is shown that the heat exchange capacity rate of a liquid PCM is around W/K which is more than 3 times higher than the heat exchange capacity rate of a solid PCM if the store temperature is higher than 40ºC. As shown in Fig. 7 and 8, the measured heat exchange capacity rate of liquid phase PCM is within W/K. The disagreement between the CFD calculation and the experiments could be explained by the viscosity of the liquid phase PCM which is much higher than anticipated in the CFD calculations. 4.2 Charge of a supercooled liquid PCM The charge behaviour of a supercooled liquid PCM is investigated. The charge test starts with a uniform temperature of 16-18ºC and with a constant inlet temperature of 77-80ºC. Fig. 11 and 12 show the charging power of a supercooled liquid PCM heated with volume flow rates of 3.1 l/min and 7.1 l/min respectively. The charging power is higher than 4000 W when the store temperature T upper is lower than 45ºC or the store temperature T mean is lower than 58 ºC. Compared with charge of a solid phase PCM, the charging power of a

42 supercooled liquid is higher than the charging power of a solid PCM at the same store temperature. The CFD predicted charging power shows similar trend. Fig. 10: CFD predicted heat exchange capacity rate vs. temperature of the PCM store for different volume flow rates. Fig. 11: Charging power vs. temperature of the PCM store for a supercooled PCM with a charging flow rate of 3.3 l/min. Fig. 12: Charging power vs. temperature of the PCM store for a supercooled PCM with a charging flow rate of 7.1 l/min. The heat exchange capacity rate of a supercooled liquid PCM is show in Fig. 13 and 14. Fig. 13 show the heat exchange capacity rate versus temperature of the PCM store heated with a volume flow rate of 3.3 l/min. The heat exchange capacity rate determined based on T upper reaches up to 200 W/K when the store temperature T upper is within 30-40ºC. The capacity rate drops to approx. 50 W/K if the temperature of the store T upper is higher than 50ºC. The heat exchange capacity rate determined based on T mean is higher than the heat exchange capacity rate determined based on T upper. The CFD predicted heat exchange capacity rate is in the range of W/K. Possible explanation of the disagreement could be the molecular structure change of SAT when supercooled. Even though there is no apparent crystallization, the molecular structure of SAT has been changed, which results in a PCM in between liquid phase and gel. Observation shows that fibre like
43 structures grow in the bottom part of the liquid when supercooled, forming a gel like liquid with a dramatically increased viscosity. When charged, the fibre structure will absorb heat and undergo molecular structural changes. The influence of the fibre structures on fluid flow and heat transfer in the PCM store can not be considered in the CFD models. Fig. 13: Heat exchange capacity rate for a supercooled PCM with a charging flow rate of 3.3 l/min. Fig. 14: Heat exchange capacity rate for a supercooled PCM with a charging flow rate of 7.1 l/min. 4.2 Discharging of the PCM module Discharging of the liquid PCM is investigated with volume flow rates of 3.3 l/min, 4.2 l/min and 7.1 l/min. The discharge test starts with a uniform temperature of about 77-80ºC and with a constant inlet temperature of about 14-16ºC. Fig. 15 shows discharging power versus temperature of the PCM store where liquid PCM is crystallized during the discharge, while Fig. 16 shows discharging power of a liquid PCM where crystallization does not happen. With decrease of the store temperature, there is decrease of discharging power. The difference between the store temperature T bottom and T mean is larger with a crystallization of PCM than the temperature difference without crystallization. It is shown in Fig. 16 that even though crystallization does not occur, the inclination of the curve of the discharge power drops when the bottom surface temperature is lower than 58ºC. Such a change of inclination of the discharging power of a liquid PCM is not shown in Fig. 15, indicating changing of the PCM properties when PCM is supercooled. Fig. 17 and 18 show the heat exchange capacity rate during discharging of the PCM module. Fig. 17 shows the heat exchange capacity rate of liquid phase PCM and crystallized PCM while Fig. 18 shows the heat exchange capacity rate of a liquid phase PCM without crystallization. The heat exchange capacity rate of a liquid phase PCM is around 250 W/K at the start of the discharging. As the temperature of the store decreases, the heat exchange capacity rate decreases to around 50 W/K as temperature of the store drops to 20-30ºC. The CFD model predicts satisfactorily the heat exchange capacity rate of a solid phase PCM but there is a significant disagreement in prediction of a liquid phase PCM.
44 Fig. 15: Discharging power of a liquid PCM with a discharging flow rate of 5.4 l/min. Fig. 16: Discharging power of a liquid PCM with a discharging flow rate of 3.0 l/min. Fig. 17: Heat exchange capacity rate of a liquid PCM with a discharging flow rate of 5.4 l/min. Thermal experiments and CFD simulations have been carried out to investigate the heat exchange capacity from and to the PCM module. The heat transfer rate between the PCM box and the heating fluid/cooling fluid in the plate heat exchangers is determined. Table 1, 2 and 3 list respectively the power weighted average of heat exchange capacity rate during charge of the PCM module, during charge of supercooled PCM and during discharge of the PCM module. The measured heat exchange capacity rate during charge of a solid phase PCM is within W/K. For charge of liquid PCM, the measured heat exchange capacity rate is W/K while it is W/K for charge of supercooled liquid PCM. The CFD predicted capacity rate for charge of solid PCM and liquid PCM is W/K and W/K respectively.
45 For discharge of the PCM module, the measured heat exchange capacity rate of liquid PCM is W/K while it is W/K for solid PCM. The CFD predicted heat exchange capacity rate during discharge of liquid PCM and during discharge of solid PCM is W/K and W/K respectively. Fig. 18: Heat exchange capacity rate of a liquid PCM with a discharging flow rate of 5.4 l/min. It can be concluded that the CFD model of solid phase PCM predicts satisfactorily the heat exchange capacity rate between the PCM module and water while there is a significant disagreement between the CFD predicted and the measured capacity rate of liquid PCM module. Possible explanation could be the change of molecular structure of liquid SAT resulting in huge variations in the viscosity during charge and discharge which can not be considered in the CFD model. A multi-phase CFD model would be recommended in the future to determine the cause of the disagreement. The measured heat exchange capacity rates are about a factor of of the desired value 250 W/K, both for charge and discharge periods. It is expected that if the heat is transferred both by means of water flowing through the upper and the lower room, the heat exchange capacity rates will still be a factor of too low for charge periods and for discharge periods. Based on the investigations, a new 300 l flat heat storage module with increased heat transfer areas was constructed (Furbo etc., 2011). Further thermal measurement on the new storage module will be used to validate the CFD models. It is expected that the new heat storage module will have good thermal characteristics inclusive sufficiently high heat exchange capacity rates. Table 1. Power weighted average of heat exchange capacity rate during charge of the PCM module. Volume flow rate Measured heat exchange capacity rate CFD predicted heat exchange capacity rate Solid phase Liquid phase Solid phase Liquid phase W/K W/K W/K W/K T store =17-58ºC T store =58-80ºC T store =17-58ºC T store =58-80ºC 3.4 l/min Tstore=Tupper Tstore=Tmean l/min Tstore=Tupper Tstore=Tmean l/min Tstore=Tupper Tstore=Tmean Table 2. Power weighted average of heat exchange capacity rate during charge of supercooled PCM module. Volume flow rate Measured heat exchange capacity rate CFD predicted heat exchange capacity rate Solid phase Liquid phase Solid phase Liquid phase W/K W/K W/K W/K - T store =16-80ºC - T store =16-80ºC 3.1 l/min Tstore=Tupper Tstore=Tmean l/min Tstore=Tupper Tstore=Tmean l/min Tstore=Tupper Tstore=Tmean - 265
46 Table 3. Power weighted average of heat exchange capacity rate during discharge of the PCM module. Volume flow rate Measured heat exchange capacity rate CFD predicted heat exchange capacity rate Solid phase Liquid phase Solid phase Liquid phase W/K W/K W/K W/K T store =14-58ºC T store =58-80ºC T store =14-58ºC T store =58-80ºC 5.4 l/min Tstore=Tupper Tstore=Tmean l/min - T store =14-80ºC T store =14-80ºC No cyrstallization Tstore=Tupper Tstore=Tmean C p Specific heat, [J/(Kg.K)] H Heat exchange capacity rate, [W/K] P Charging/discharging power, [W] T Temperature, [K]. V Volume flow rate of the charging/discharging flow, [m 3 /s] Thermal conductivity, [W/(mK)] Density, [kg/m 3 ] Dynamic viscosity, [kg/(ms)] Subscript f, r, s inlet (forward), outlet (return) and store respectively. Furbo, S., Dragsted, J., Chen, Z., Fan, J., Andersen, E., Perers, B., Towards seasonal heat storage based on stable supercooling of sodium acetate trihydrate. EuroSun 2010 Congress Proceedings, Graz, Austria. Furbo, S., Investigations of heat storages with salt hydrate as storage medium based on the extra water principle. Thermal Insulation Laboratory, Technical University of Denmark, report no. 80. Schultz, J.M., Furbo, S., Solar heating systems with heat of fusion storage with 100% solar fraction for low energy buildings. ISES Solar World 2007 Congress proceedings. Beijing, China. Ansys Inc., Ansys Fluent release 13.0, Southpointe, 275 Technology Drive, Canonsburg, PA 15317, U.S.A. Ariki N., Futamura M., Makino A., Shibata H., Measurement of thermophysical properties of sodium acetate hydrate. International Journal of Thermophysics, 16(6) pp Yoon W., Shul Y., Kim J., etc Encapsulation of sodium acetate trihydrate and stearic acid for thermal energy storage. Journal of the Korean Institute of Chemical Engineering, 38(5) pp Furbo, S., Dragsted, J., Fan, J., Chen, Z., Andersen, E., Perers, B., Experimental studies on seasonal heat storage based on stable supercooling of a sodium acetate water mixture. ISES Solar World Congress 2011 Proceedings, Kassel, Germany.
47 Appendix 4 SHC 2012 Conference Proceedings
48 SHC 2012 Thermal behavior of a heat exchanger module for seasonal heat storage Jianhua Fan*,aSimon Furbo, Elsa Andersen, Ziqian Chen, Bengt Perers, Mark Dannemand Department of Civil Engineering, Technical University of Denmark, Brovej 118, Kgs. Lyngby, DK 2800, Denmark Abstract Experimental and theoretic investigations are carried out to study the heat transfer capacity rate of a heat exchanger module for seasonal heat storage with sodium acetate trihydrate (SAT) supercooling in a stable way. A sandwich heat storage test module has been built with the phase change material (PCM) storage box in between two plate heat exchangers. Charge of the PCM storage is investigated experimentally with solid phase SAT as initial condition. Discharge of the PCM storage with the presence of crystallization is studied experimentally. Fluid flow and heat transfer in the PCM module are theoretically investigated by Computational Fluid Dynamics (CFD) calculations. The heat transfer rates between the PCM storage and the heating fluid/cooling fluid in the plate heat exchangers are determined. The CFD calculated temperatures are compared to measured temperatures. Based on the studies, recommendations on how best to transfer heat to and from the seasonal heat storage module are given Published by Elsevier Ltd. Selection and/or peer-review under responsibility of PSE AG Keywords: Seasonal heat storage; Phase change materials; Stable supercooling; Thermal behavior; Computational Fluid Dynamics 1. Introduction Theoretical investigations have shown that a solar heating system with a collector area of 36 m² can fully cover the yearly heat demand of a low energy house in Denmark if the solar heating system is based on a 6000 l seasonal heat storage with sodium acetate trihydrate (SAT) supercooling in a stable way [1, 2]. The heat storage is divided into a number of separate heat storage modules. The heat exchange capacity rates both for charge and discharge of a 500 l seasonal heat storage module must be around 500 W/K in order for the solar heating system to fully cover the yearly heat demand of low energy buildings * Corresponding author. Tel.: ; fax: address: jif@byg.dtu.dk.
49 [1]. Experimental investigations of a sandwich heat storage test module built with the phase change material (PCM) storage box in between two plate heat exchangers have earlier been carried out [3]. The measured heat exchange capacity rates are about a factor of of the desired value, both for charge and discharge periods. Fluid flow and heat transfer in the PCM storage model were investigated using either liquid or solid phase CFD models. However the heat transfer in the module during melting and crystallization is much more complex than single phase problems [4-7]. It is pointed out in [8, 9] that there are considerable discrepancies between experimental and theoretical results due to thermal inertia, instability in the systems, lack of reliable information about the physical properties of the materials, etc. The aim of this paper is to investigate experimentally and theoretically the thermal behavior of a heat exchanger module for seasonal heat storage in the presence of melting/crystallization of SAT. Charge of the PCM storage is investigated with solid phase SAT as initial condition. Discharge of the PCM storage with the presence of crystallization is studied. The heat exchange capacity rate of the PCM heat storage module during charge and discharge is determined. Nomenclature C p specific heat, J/kg/K h sensible enthalpy, J H enthalpy, J Hex heat exchange capacity rate, W/K k thermal conductivity, W/(mK) L latent heat of SAT, kj/kg S source term t time, s T temperature, K V volume flow rate during charge/discharge, m 3 /s liquid fraction, - thermal conductivity of SAT, W/(mK) density, kg/m 3 dynamic viscosity, kg/(ms) v fluid velocity vectors, m/s H latent heat, J Subscript f inlet r outlet s PCM store 2. The experimental investigations Theoretical calculations by Schultz and Furbo [1] have shown that the heat exchange capacity rates both for charge and discharge of a seasonal heat storage module for solar heating systems fully covering the yearly heat demand of low energy buildings must be around 500 W/K. The heat exchange capacity rate of a sandwich heat storage module is investigated experimentally. Figure 1 shows a photo of the heat storage module. The test module has a length of approx mm and a width of approx mm. The height of the PCM storage box is 5 mm. The module is filled with 210 kg salt water mixture consisting of 58% (weight%) sodium acetate and 42% (weight%) water. The volume of the salt water mixture is about 156 l, corresponding to about 1/3 of the size of a real seasonal heat storage. It is therefore estimated that the heat exchange capacity rate for the investigated heat storage module must be around 167 W/K.
50 The salt water mixture is used, since it supercools in a stable way. Investigations by Furbo [10] have shown that a salt water mixture of 58% NaCH 3 COO and 42% water can be used in tanks made from steel without a risk of corrosion. The module material is therefore steel and the wall thickness is 2 mm. The aim of the investigations is to determine the heat exchange capacity rate of the PCM module during charge and discharge. Two plate heat exchangers are mounted: one on the top and the other one on the bottom surface of the PCM module. The height of the plate heat exchanger is approx. 2 mm. In order to avoid dead zones and uneven flow distribution of the charge/discharge flow, the flat plate heat exchangers are divided into 16 equally spaced parallel channels. The width of the channel is approx. 150 mm. The module can be charged either from the bottom heat exchanger or from both the bottom and the upper heat exchangers, whereas during discharge of the module either the upper heat exchanger or both heat exchangers can be used. The sandwich like heat storage module is insulated with mineral wool or insulation foam on all external surfaces. Water is used as the heat transfer fluid in the heat exchangers. The water volume flow rate during charge and discharge of the module is regulated by a circulation pump and two valves. The circulating flow rate, in the range of 2-7 l/min, is measured using a Brunata type HGQ1-R0 flow meter. The inlet and outlet water temperatures of the heat exchangers are measured by copper-constantan thermo couples (type TT). The temperature of the PCM store can not be measured directly since insertion of temperature sensors into the store prevents stable supercooling of SAT and is therefore avoided. The temperature of the PCM store can be estimated by measurement of temperatures on the surfaces of the store. The surface temperatures of the PCM module are measured by 12 equally spaced thermocouples (type TT) with 6 sensors attached to the upper surface and 6 sensors attached to the bottom surface of the store, shown as circles in Fig. 1. The temperatures of the sides of the PCM module are measured by 4 thermocouples (type TT), shown as squares in Fig. 1. The data collection and control program IMPVIEW is used to log the fluid flow rate, the inlet and outlet temperatures of the heat exchanger, the surface temperatures of the PCM store and the ambient temperature during the test period. The accuracy of the flow rate measurement is ± 1 % while the accuracy of the type TT thermocouples is ± 0.5 K. 3. The numerical method 3.1. The computational fluid dynamics model Computational fluid dynamics calculations are carried out to theoretically investigate the fluid flow and heat transfer in the heat storage module during charge and discharge. As the heat storage module has 16 equally spaced parallel channels, it is expected that heat transfer and fluid flow in the storage module can be represented by one channel with appropriate symmetry conditions. The approximation can be considered reasonable as calculations with a preliminary CFD model of the whole storage module show an even flow distribution among the 16 channels. A simplified model of one channel is built using the commercial CFD code Ansys (Fluent) 13 [11], see Fig. 2. The model includes the PCM box, the flat plate heat exchanger mounted at the bottom surface of the PCM box and the heat exchanger mounted at the upper surface of the PCM box. During charge/discharge, the hot/cold water enters into the plate heat exchanger through an inlet opening located in one corner of the exchanger and leaves the heat exchanger through an outlet opening in the opposite corner. The module can be charged by either the bottom heat exchanger or both the bottom and the upper heat exchangers while during discharge either the upper heat exchanger or both the upper and the bottom heat exchangers are used. The height of the water passage is 2 mm. The heat loss coefficient of the PCM storage module is determined by measurements and used as an input to the CFD models. The measured mean ambient air temperature during the experiment is used
 shows mesh at the horizontal plan of the module.")


51 as free stream temperature of the module surfaces in the CFD models. In this way, the CFD model takes into account the heat loss from the storage module. Mesh of the channel of the PCM module is shown as an example in Fig. 3. Fig. 3 (A) shows mesh at the horizontal plan of the module. The flow passage created by the channel is meshed with high quality hexahedral elements with an interval size of 8 mm. Mesh at a vertical cut plane across the channel is shown as View A in Fig. 3 (B). The model includes the PCM box in the middle and two heat exchangers at the upper and at the bottom of the PCM box respectively. A denser mesh is applied to the heat exchanger where a larger temperature/velocity gradient is expected. The mesh close to the walls is refined in order to capture the large temperature/velocity gradients in the near wall regions. In between the PCM box and the heat exchanger, there is a steel wall meshed with one node vertically. Both vertical and horizontal conductive heat transfer in the solid steel wall are considered. The model has a mesh with approx. 100,000 cells in total. Fig. 1: Photo of the PCM heat storage test module with plate heat exchangers at the top and the bottom. Fig. 2: CFD model of one channel of the PCM module. (A) Mesh at the horizontal plan of the module (B) Mesh of the module View A Fig. 3: Mesh of the PCM module with a PCM box in between two heat exchangers. Since water flow in the plate heat exchanger mostly falls in laminar region, the laminar model is used in the CFD calculations. Fluid flow in the PCM box is calculated with a laminar model. Transient CFD calculations are performed with an initially standstill module (all fluid velocities are zero) and a uniform temperature. The PRESTO and second order upwind method are used for the discretization of the pressure and the momentum equations respectively. The SIMPLE algorithm is used to treat the pressurevelocity coupling. The calculation is considered convergent if the scaled residual for the continuity equation, the momentum equations and the energy equation are less than , and respectively. One calculation takes approximately hours for a computer with 2 3 GHz CPU frequency and 4G memory The melting/crystallization model During charge and discharge of the module, phase transitions of SAT between solid and liquid phase
52 will have a significant influence on the heat transfer in the PCM module. The enthalpy-porosity method is used to calculate melting and crystallization of SAT. In the enthalpy-porosity method, the melt interface is not tracked explicitly. Instead, a quantity called the liquid fraction, which indicates the fraction of the cell volume that is in liquid form, is associated with each cell in the domain. The liquid fraction is computed at each iteration, based on an enthalpy balance. The energy equation is written as H vh kt S (1) t Where density, kg/m 3 ; v is fluid velocity vectors, m/s. S is Source term. The enthalpy of SAT, H, consists of sensible enthalpy, h and latent heat, H. H h H (2) T h href C pdt (3) T ref where H is the enthalpy; C p is the specific heat of SAT; T is the temperature in K. The latent heat is calculated by a product of the liquid fraction and the latent heat of the material. H L where L is the latent heat of SAT, 265 kj/kg; liquid fraction, -. The liquid fraction is 1 when the PCM temperature is higher than the melting temperature, while it is 0 if the PCM temperature is lower than the melting temperature. In this way, melting and crystallization of SAT during charge/discharge of the module are considered. Properties of liquid mixture of 42% (weight) water and 58% (weight) NaCH3COO and their dependences on temperature are shown as follows [12, 13]: Density, [kg/m 3 ] = * T (4) Specific heat, [J/(Kg.K)] C p * T (5) * T * T 2 Thermal conductivity, [W/(mK)] (6) Dynamic viscosity, [kg/(ms)] * T (7) where T is fluid temperature, [K]. Properties of solid PCM and their dependences on temperature are shown as follows [12]: Density, [kg/m 3 ] Constant = 1530 Specific heat, [J/(Kg.K)] C p * T (8) Thermal conductivity, [W/(mK)] Constant = 0.6 where T is fluid temperature, [K]. Water is used to charge and discharge the PCM module. Properties of water and their dependences on temperature are shown as follows: Density, [kg/m 3 ] 2 = *T *T (9) Dynamic viscosity, [kg/(ms)] T *( ) 315 (10) Thermal conductivity, [W/(mK)] * T (11) where T is fluid temperature, [K]. The steel wall has a thermal conductivity of 60 W/K/m and a density of 7850 kg/m 3.
53 4. Results and discussion In order to determine the heat exchange capacity rate from and to the PCM module, charge and discharge test of the PCM module have been carried out with different volume flow rates. Power of heat exchange and heat exchange capacity rate between water and the PCM store are determined. The power during charge and discharge is determined by equation (12). P VC pabs( Tf Tr ) (12) Heat exchange capacity rate, Hex, is determined by equation (13). Tf Tr Hex VC p ln(1 ) (13) Tf Ts V is the charge/discharge volume flow rate in m 3 /s. C p is specific heat of the fluid in J/(kgK) of the fluid in kg/m 3. T f, T r and T s is respectively the inlet temperature, outlet temperature of the charging/discharging flow and temperature of the PCM store. Temperature of the PCM store is measured indirectly by temperature sensors attached to the upper, the bottom and the side surfaces of the module Charge of the module Charge of the PCM module has been investigated at a volume flow rate of 2 l/min and 7 l/min respectively. The charge test starts with a uniform module temperature of 17-21ºC and with a constant water inlet temperature of 75-77ºC. Either the bottom heat exchanger or both the bottom and the upper heat exchangers are used during charge. Fig. 4 shows the charging power versus temperature of the PCM store at charging volume flow rates of 2 l/min and 7 l/min respectively. The PCM store temperature is obtained by an average of all measured surface temperatures of the PCM module. At the start of the charging process the power reaches up to approx W. The extremely high charging power can be explained by the replacement of cold water by hot water in the heat exchanger in the start of the test. As the PCM store temperature increases, the charging power decreases. For the charge only by the bottom heat exchanger with a volume flow rate of 2 l/min, the charging power decreases from 4000 W to 480 W as the temperature of the PCM store increases from 30ºC to 66ºC. With an increase of the volume flow rate to 7 l/min, the charging power increases by %. If the PCM store is charged by both the bottom and the upper heat exchangers with the same total volume flow rate of 7 l/min, the charging power further increases by %, corresponding to about W, which can be explained by the increase of heat transfer surface area if both heat exchangers are used for charging. Fig. 5 shows heat exchange capacity rate versus temperature of the PCM store for a volume flow rate of 2 l/min and 7 l/min respectively. For the charge only by the bottom heat exchanger, the heat exchange capacity rate lies in the range of W/K, except the very start of the test where higher heat exchange capacity rates are observed due to the inertial effect of the module and the replacement of the cold water by hot water in the heat exchanger. The increase of the volume flow rate from 2 l/min to 7 l/min approx. doubles the heat exchange capacity rate at a PCM store temperature between 33-66ºC. When the PCM store is charged by both the bottom and the upper heat exchanger, the heat exchange capacity rate is increased by a factor 2-3, corresponding to about W/K. It can be concluded that the charge volume flow rate has a significant influence on the charging power and the heat exchange capacity rate. The average heat exchange capacity rate determined by (Hex*P)/ (P) is shown in Table 1. The column Tall indicates that the heat exchange capacity rate is calculated based on a PCM store temperature determined by an average of all measured surface temperatures. The column Tside indicates that the heat exchange capacity rate is determined based on a PCM store temperature obtained
54 by an average of the measured temperatures of the side surfaces of the PCM box. A large difference can be seen between the heat exchange capacity rates determined by the two methods. It can be concluded that the determination of the PCM store temperature has a big influence on the heat exchange capacity rate. Measurement of the PCM store temperature could be improved, for example, by insertion of temperature probes in the PCM box. Power, W bottom, 7 l/min in total bottom, 2 l/min in total upper & bottom, 7 l/min in total upper & bottom, 2 l/min in total Heat exchange capacity rate W/K bottom, 7 l/min in total bottom, 2 l/min in total upper & bottom, 7 l/min in total upper & bottom, 2 l/min in total PCM store temperature, ºC Fig. 4: Power versus temperature of the PCM store during charge PCM store temperature, ºC Fig. 5: Heat exchange capacity rate versus temperature of the PCM store during charge Discharge of the module Discharging of the PCM store is investigated with volume flow rates of 2 l/min and 7 l/min. The discharge test starts with a uniform module temperature of about 75-77ºC and with a constant inlet temperature of about 15-18ºC. Fig. 6 shows discharging power versus temperature of the PCM store where liquid PCM is crystallized during the discharge. The discharge power decreases with the decrease of PCM store temperature, especially for a discharge with both the upper and the bottom heat exchangers at a volume flow rate of 7 l/min. Fig. 7 shows the heat exchange capacity rate during discharge. The heat exchange capacity rate of the upper heat exchanger decreases from 200 W/K to 53 W/K with a decrease of the PCM store temperature from 68ºC to 20ºC. The volume flow rate has an insignificant influence on the heat exchange capacity rate while the heat exchange capacity rate is significantly increased if both the upper and the bottom heat exchanger are used for discharge. The average heat exchange capacity rate during discharge is shown in Table 1. It can be concluded that the heat exchange capacity rate during charge/discharge increases by a factor of 2-3 if both the upper and the bottom heat exchangers are used instead of the use of either the upper or the bottom heat exchanger. Scaled to the size of a real module, the heat exchange capacity rate of the module during charge/discharge is close to the required value, 500 W/K if both the upper and the bottom heat exchanger are used The CFD predicted charge behavior Thermal behavior of the PCM module during charge by the bottom heat exchanger is investigated using the CFD model implementing the enthalpy-porosity method. The CFD predicted and the measured charging power are shown in Fig. 8. The curve Measurement, Ttop shows the charging power versus the PCM store temperature determined by the measured upper surface temperatures while the curve Measurement, Tside shows the charging power versus the PCM store temperature determined by the measured side surface temperatures. During charge of the PCM store, temperature of the PCM store can be estimated by an average of the side or the upper surface temperatures or by an average of all surface temperatures. Due to the relatively low thermal conductivity of the solid phase and liquid phase sodium
55 acetate tri-hydrate, it is expected that heat transfer within the PCM material contributes to most of the thermal resistance of the module while the heat transfer between the steel wall and the circulating water has a much smaller thermal resistance. Therefore the temperature of the side steel wall is almost the same as the mean water temperature during the test. Before the PCM material is fully melted, the heat will be used to melt the PCM material, resulting in a stepwise temperature change in the store. Average of the side surface temperatures of the module, Tside, therefore overestimates temperature of the module, whereas average of the upper surface temperatures, Ttop, underestimates temperature of the PCM module. Power, W upper, 7 l/min in total upper, 2 l/min in total upper & bottom, 7 l/min in total upper & bottom, 2 l/min in total PCM store temperature, ºC Fig. 6: Power versus temperature of the PCM store during discharge. Heat exchange capacity rate W/K upper, 7 l/min in total upper, 2 l/min in total upper & bottom, 7 l/min in total upper & bottom, 2 l/min in total PCM store temperature, ºC Fig. 7: Heat exchange capacity rate versus temperature of the PCM store during discharge. Table 1. The power weight average heat exchange capacity rate (in W/K) during charge and discharge. Volume flow rate Charge Discharge Tside Tall Difference Tside Tall Difference 2 l/min one side % % both sides % l/min one side % % both sides % It can be seen from Fig. 8 that for the same charging power the PCM store temperature Tside is higher than the temperature Ttop. In the start of the charging process, the difference between Tside and Ttop reaches up to 17K. The difference decreases gradually with melting of the PCM material. When the store temperature is higher than 68ºC, the difference between Tside and Ttop becomes insignificant. The charging power decreases gradually with increase of the PCM store temperature. The CFD predicted power versus temperature of the PCM store is shown as black solid curve in Fig. 8. For the same temperature of the store, the CFD predicted power follows the measured power. The CFD predicted heat exchange capacity rate versus the PCM store temperature is shown in Fig. 9. The CFD predicted heat exchange capacity rate lies in between the heat exchange capacity rate determined by the upper surface temperatures and by the side surface temperatures when the PCM store temperature is in the range of 20-55ºC while at a PCM store temperature >55ºC, the CFD model tends to overestimate the heat exchange capacity rate. The disagreement could be caused by an underestimation of the viscosity of the liquid phase SAT by equation 7 in the CFD calculations, resulting in an overestimated convective heat transfer and a higher charging power. The disagreement could also be caused by errors in the experiments. However these theories need to be confirmed in future investigations.


56 Power, W PCM store temperature, ºC CFD Measurement, Ttop Measurement, Tsides Fig. 8: Measured and CFD predicted power versus temperature of the PCM store during charge by the bottom heat exchanger with a volume flow rate of 7 l/min. Heat exchange capacity rate, W/K CFD Measurement, Ttop Measurement, Tsides PCM store temperature, ºC Fig. 9: Measured and CFD predicted heat exchange capacity rate during charge by the bottom heat exchanger with a volume flow rate of 7 l/min. The CFD predicted liquid fraction of the PCM store at a vertical cut plane parallel to the channel is shown in Fig. 10. Temperature distribution of the PCM store is shown in Fig. 11. The hot water flows from right to left, therefore the end to the right has a higher temperature than the end to the left. It can be seen that the melting of SAT starts at the bottom of the store as the store is charged only by the bottom heat exchanger. As the module is gradually heated up, the solid SAT at both ends close to the manifold starts to melt. The solid SAT at the end to the right melts faster than the solid at the end to the left which can be explained by the relatively higher fluid temperature in the manifold at the inlet side. After 2.5 h of charge, approx. half of the solid SAT is melted, while the PCM store is completely melted after 5.8 h after the start. Water flow Water flow Fig. 10: Liquid fraction of the PCM store during charge by the bottom heat exchanger with a volume flow rate of 7 l/min. Fig. 11: The PCM store temperature during charge by the bottom heat exchanger with a volume flow rate of 7 l/min. 5. Conclusions Thermal experiments and CFD simulations have been carried out to investigate the heat exchange capacity rate from and to the PCM module. For the module charged by the bottom heat exchanger or the module discharged by the upper heat exchanger, the measured heat exchange capacity rate is in the range of W/K. The heat exchange capacity rate increases by a factor of 2-3 if both the upper and the bottom heat exchangers are used during charge/discharge. The volume flow rate has a significant influence on the charging power and the heat exchange capacity rate. Scaled to the size of a real heat storage module, the heat exchange capacity rate of the module is close to the required value, 500 W/K if the module is charged or discharged by both the upper and the bottom heat exchanger. The determination of the PCM store temperature has a big influence on the heat exchange capacity rate. Measurement of the PCM store temperature should be improved in further investigations. Preliminary CFD investigations of thermal behavior of the module during charge/discharge using the enthalpy-porosity method show that the CFD model can predict satisfactorily the power and heat exchange capacity rate of the module during charge at a PCM store temperature between 20-55ºC, while
57 the CFD model overestimates the heat exchange capacity rate at a PCM store temperature > 55ºC. Possible explanation could be the change of molecular structure of liquid SAT resulting in huge variations in the viscosity during charge and discharge which can not be considered in the CFD model. Further investigations of the CFD model would be recommended in the future to determine the cause of the disagreement. Acknowledgements The work is carried out within the IEA task 42 project Compact Thermal Energy Storage: Material Development and System Integration and the FP7 COMTES collaborative project Combined development of compact thermal storage technologies. References [1] Schultz JM, Furbo S, Solar heating systems with heat of fusion storage with 100% solar fraction for low energy buildings. Proceedings of the Solar World Congress Beijing, China. [2] Furbo S, Dragsted J, Fan J, Chen Z, Andersen E, Perers B. Experimental studies on seasonal heat storage based on stable supercooling of a sodium acetate water mixture. Proceedings of the Solar World Congress Kassel, Germany. [3] Fan J, Furbo S, Chen Z, Andersen E, Perers B. Heat transfer capacity rate of a heat exchanger module for seasonal heat storage. Proceedings of the Solar World Congress Kassel, Germany. [4] Regin FA, Solanki SC, Saini JS. Heat transfer characteristics of thermal energy storage system using PCM capsules: A review. Renewable and Sustainable Energy Reviews. 2008; 12: [5] Zalba B, Marin JM, Cabeza LF, Mehling H. Review on thermal energy storage with phase change: materials, heat transfer analysis and applications. Applied Thermal Engineering. 2003; 23: [6] Verma P, Varun, Singal SK. Review of mathematical modeling on latent heat thermal energy storage systems using phase change material. Renewable and Sustainable Energy Reviews. 2008; 12: [7] Sharma A, Tyagi VV, Chen CR, Buddhi D. Review on thermal energy storage with phase change materials and applications. Renewable and Sustainable Energy Reviews. 2009; 13: [8] Costa M, Oliva A, Perez Segarra CD, Alba R. Numerical simulation of solid liquid phase change phenomena. Computer Methods in Applied Mechanics and Engineering. 1991; 91: [9] Costa M, Oliva A, Perez Segarra CD. Three-dimensional numerical study of melting inside an isothermal horizontal cylinder. Numerical Heat Transfer, Part A. 1997; 32: [10] Furbo S., Investigations of heat storages with salt hydrate as storage medium based on the extra water principle. Thermal Insulation Laboratory, Technical University of Denmark, report no. 80, [11] Ansys Inc. Ansys Fluent release 13.0, Southpointe, 275 Technology Drive, Canonsburg, PA 15317, U.S.A [12] Ariki N, Futamura M, Makino A, Shibata H, Measurement of thermophysical properties of sodium acetate hydrate. International Journal of Thermophysics, 1995;16(6): [13] Yoon W, Shul Y, Kim J, etc. Encapsulation of sodium acetate trihydrate and stearic acid for thermal energy storage. Journal of the Korean Institute of Chemical Engineering, 2000; 38(5):
58 Appendix 5 SHC 2012 Conference Proceedings
59 SHC 2012 Development of seasonal heat storage based on stable supercooling of a sodium acetate water mixture Simon Furbo a, Jianhua Fan a, Elsa Andersen a, Ziqian Chen a, Bengt Perers a a Department of Civil Engineering, Technical University of Denmark, Brovej, DK-2800 Kgs. Lyngby, Denmark Abstract A number of heat storage modules for seasonal heat storages based on stable supercooling of a sodium acetate water mixture have been tested by means of experiments in a heat storage test facility. The modules had different volumes and designs. Further, different methods were used to transfer heat to and from the sodium acetate water mixture in the modules. By means of the experiments: The heat exchange capacity rates to and from the sodium acetate water mixture in the heat storage modules were determined for different volume flow rates. The heat content of the heat storage modules were determined. The reliability of the supercooling was elucidated for the heat storage modules for different operation conditions. The reliability of a cooling method used to start solidification of the supercooled sodium acetate water mixture was elucidated. The method is making use of boiling CO 2 in a small tank in good thermal contact with the outer surface of the heat storage module. Experience on operation of the heat storage modules was gained. Based on the investigations recommendations for future development of a seasonal heat storage based on stable supercooling of a sodium acetate water mixture are given Published by Elsevier Ltd. Selection and/or peer-review under responsibility of PSE AG Keywords: PCM; sodium acetate; supercooling; seasonal heat storage; heat storage modules; laboratory tests 1.Background Calculations have shown that a 36 m² solar heating system can fully cover the yearly heat demand of a low energy house in Denmark if the solar heating system is equipped with a 6 m 3 seasonal heat storage
60 with a sodium acetate water mixture supercooling in a stable way. The heat storage is divided into a number of separate heat storage modules. The heat storage module concept is based on the advantage of stable supercooling. By using this concept the heat storage module will have no heat loss for a long period making seasonal heat storage possible. If a sodium acetate water mixture, which has a melting point of 58 C, has been fully melted during the sunny summer, it can cool down in its liquid phase to the surrounding temperature and still preserve the latent heat related to the heat of fusion. The heat storage module can be left in this state with no heat loss until a heat demand occurs in the house in the winter, in which case solidification is activated, the heat of fusion is released, and the heat storage temperature increases almost immediately to the melting point. Investigations carried out during participation in the IEA Task 32 project Advanced storage concepts for solar and low energy buildings and in the IEA task 42 project Compact Thermal Energy Storage: Material Development and System Integration form a good basis for development of a seasonal heat storage, [1]-[12]. 2.Tested heat storage modules Three differently designed heat storage modules with a sodium acetate mixture consisting of 58% (weight%) sodium acetate and 42% (weight%) water have been tested in a laboratory heat storage test facility. The salt water mixture volumes of the heat storage modules are 234 l, 208 l and 160 l. Fig 1 shows a schematic sketch of the first heat storage module with approximated dimensions in mm. The module material is steel and the wall thickness is 2 mm. Both the upper and lower surfaces of the flat module are used as heat transfer areas for heat transfer to and from the module. Water, which is used as the heat transfer fluid, is pumped through two copper absorbers placed below and above the module as shown in Fig 2. Wooden slats are placed above and below the absorber strips in such a way that there will be a good thermal contact between the fins and the module surfaces. The construction is insulated with 100 mm mineral wool. Fig. 1. Principle sketch of the first heat storage module with two holes used to fill in the salt water mixture.

61 1: Wooden slats. 2: Salt water mixture in steel module. 3 & 9: Copper pipes. 4 & 8: Absorber fin. 5: Mineral wool. 6: Bottom of module. 7: Paste with good thermal conductivity. Fig. 2. Principle sketch of the first heat storage module with heat transfer system and insulation. The module is filled with 305 kg salt water mixture corresponding to a module volume of about 234 l. Fig 3 shows photos of the module inclusive thermocouples for measurements of the module surface temperatures. The flat module is placed with a small tilt from horizontal.
62 Fig. 3. Photos of the first heat storage module. The heat storage module has been tested by means of two different heat transfer methods. Fig 4 shows photos of the heat storage module using the second heat transfer method. Fig 5 shows a schematic sketch of the lower part of the heat storage module. The heat storage module is placed in a stainless steel container with small separate rooms for water below and above the module. Silicone pipes are attached to the upper and lower surfaces of the module in such a way, that water pumped through the separate rooms will flow through the rooms in a serpentine way, guided by the silicon pipes. The water will therefore flow through the lower room in direct contact with all parts of the lower module surface, and water will flow through the upper room in direct contact with all parts of the upper module surface. Heat is transferred from/to the salt water mixture, to/from the upper or lower module surface and the water is flowing through the upper or lower room.

63 Fig. 4. Photos of the first heat storage module with silicone pipes attached to the upper surface. Fig. 5. Schematic sketch of the lower part of the first heat storage module.