Wastewater Treatment Facility Facilities Plan
|
|
|
- Ralf Mitchell
- 5 years ago
- Views:
Transcription


1 Wastewater Treatment Facility Facilities Plan Prepared For The CITY OF KIEL CALUMET & MANITOWOC COUNTIES WISCONSIN DECEMBER 2015 McM. No. K MCMAHON DRIVE P.O. BOX 1025 NEENAH, WI TJK: PH FX

2 Wastewater Treatment Facility Facilities Plan Prepared For The CITY OF KIEL CALUMET & MANITOWOC COUNTIES WISCONSIN Prepared By McMAHON NEENAH, WISCONSIN DECEMBER 2015 McM. No. K Table Of Contents Page 1 Chapter I INTRODUCTION A. INTRODUCTION Chapter II WATER QUALITY OBJECTIVES A. FEDERAL BACKGROUND B. SANITARY SEWER SYSTEM OVERFLOW 1. Capacity Assurance, Management, Operation & Maintenance Programs 2. Notifying The Public & Health Authorities 3. Prohibition Of Overflows 4. Expanding Permit Coverage To Satellite Systems C. WISCONSIN ADMINISTRATIVE CODE REVISIONS 1. Wisconsin Department Of Natural Resources (DNR) Ammonia Policy a. NR 104 Uses & Designated Standards b. NR 105 Surface Water Quality Criteria & Secondary Values For Toxic Substances c. NR 106 Procedures For Calculating Water Based Effluent Limitations For Toxic & Organoleptic Substances Discharged For Surface Waters d. NR 210 Sewage Treatment Works 2. NR 217 Phosphorus Regulations a. NR 102 Water Quality Standards For Wisconsin Surface Waters b. NR 217 Effluent Standards & Limitations c. NR 151 Runoff Management 3. Temperature Regulations D. SLUDGE REGULATIONS Regulations a. Metals b. Pathogen Reduction c. Vector Attraction 2. NR 204 Regulations
3 Table Of Contents (continued) Page 2 Chapter II WATER QUALITY OBJECTIVES (continued) E. WISCONSIN WATER QUALITY OBJECTIVES F. EFFLUENT REQUIREMENTS 1. Current Effluent Limitations 2. Effluent Limitations That Are The Same For All Design Flow Alternatives 3. Daily Maximum Ammonia Nitrogen (NH 3 N) Limits Based On Effluent ph 4. Effluent Daily Limits That Vary Based On Design Flow For The Range Of 0.98 & 3.01 mgd 5. Chlorides 6. Temperature 7. BOD, TSS & Ammonia List Of Appendices Appendix II 1 WPDES Permit No. WI Appendix II 2 Wisconsin DNR Memorandum WQBEL / Appendix II 3 Wisconsin DNR Letter Facility Planning Effluent Limits / Chapter III CURRENT SITUATION & NEEDS ASSESSMENT A. PLANNING AREA DESCRIPTION 1. Topography 2. Geology, Soil Conditions & Hydrology 3. Hydrology / Surface Water / Wetlands / Floodplains a. Watersheds b. Surface Water c. Wetlands & Floodplains 4. Endangered Species 5. Archaeological / Historical / Cultural Resources 6. Land Use & Demographics B. INFRASTRUCTURE DESCRIPTION 1. Public Water System 2. Sanitary Sewer Collection System 3. Description Of Wastewater Treatment Facility a. Liquid Train b. Solids Train c. Electrical d. Controls C. WPDES PERMIT D. WASTEWATER TREATMENT FACILITY FLOWS & LOADINGS E. WASTEWATER TREATMENT FACILITY PERFORMANCE F. NEEDS ASSESSMENT 1. General 2. Capacity 3. Wastewater Treatment Facility Condition a. General b. Headworks c. Primary Clarifiers d. Aeration System e. Final Clarifiers
4 Table Of Contents (continued) Page 3 Chapter III CURRENT SITUATION & NEEDS ASSESSMENT (continued) F. NEEDS ASSESSMENT (continued) f. Tertiary Sand Filters g. Disinfection System h. Post Aeration System i. High Strength Waste Tank j. Digesters k. Sludge Dewatering l. Electrical m. Controls Needs 4. Permit Requirements List Of Tables Table III 1 Table III 2 Table III 3 Table III 4 Table III 5 Table III 6 Population Projection Existing WWTF Motor Control Centers (MCC s) WWTF Historical Influent Flows & Loadings Number Of Days Exceeding Design Criteria WWTF Historical Influent & Industrial Loadings WWTF Performance List Of Figures Figure III 1 Wetlands Map Figure III 2 Floodplain Map Figure III 3 Land Use Map Figure III 4 Population Projections Figure III 5 Sanitary Sewer System Figure III 6 Existing One Line Diagram Figure III 7 Monthly Flows (mgd) / Figure III 8 Monthly BOD (lbs./day)/ Figure III 9 Monthly TSS (lbs./day) / Figure III 10 Monthly Total Phosphorus (lbs./day) / Figure III 11 Weekly Average Effluent BOD (mg/l)/ Figure III 12 Weekly Average Effluent BOD (lbs./day)/ Figure III 13 Monthly Average Effluent BOD (mg/l) / Figure III 14 Weekly Average Effluent TSS (mg/l) / Figure III 15 Monthly Average Effluent TSS (mg/l) / Figure III 16 Monthly Average Effluent Total P (mg/l) / Figure III 17 Monthly Average Effluent Ammonia (mg/l) / Figure III 18 Weekly Average Effluent Ammonia (mg/l) / Figure III 19 Maximum Day Effluent Ammonia (mg/l) / Figure III 20 Weekly Average Effluent Copper ( g/l) / List Of Appendices Appendix III 1 Wisconsin DNR Endangered Resources Preliminary Assessment Appendix III 2 Wisconsin DNR Archaeological / Historical Significance Response Appendix III 3 Compliance Maintenance Annual Report (CMAR) / 2014 Appendix III 4 Unit Process Descriptions / December 2014 Master Plan
5 Table Of Contents (continued) Page 4 Chapter IV INFILTRATION / INFLOW ANALYSIS A. BACKGROUND B. INFILTRATION / INFLOW ANALYSIS 1. Infiltration 2. Inflow 3. Peak Flow Analysis 4. Inflow Quantity / Calculation 5. I/I Reduction Efforts 6. Handling I/I Flows List Of Figures Figure IV 1 Figure IV 2 Figure IV WWTF Influent Flow Vs. Precipitation 2013 WWTF Influent Flow Vs. Precipitation 2014 WWTF Influent Flow Vs. Precipitation List Of Appendices Appendix IV 1 Infiltration / Inflow (I/I) Analysis Appendix IV 2 5 Year Infiltration / Inflow (I/I) Reduction Plan Chapter V FUTURE CONDITIONS A. INTRODUCTION B. PLANNING PERIOD C. POPULATION ESTIMATES D. FUTURE FLOWS & LOADINGS E. DESIGN PERIOD F. DESIGN CAPACITY List Of Tables Table V 1 Table V 2 Table V 3 Table V 4 Table V 5 Table V 6 Projected 2035 Flows & Loadings Land O Lakes, Inc. Future Flows & Loadings Sargento Future Flows & Loadings Projections Staging Periods Proposed Wastewater Treatment Facility Design Criteria Capacity Limitations
6 Table Of Contents (continued) Page 5 Chapter VI ALTERNATIVES EVALUATION & PRELIMINARY SCREENING A. INTRODUCTION B. NO ACTION ALTERNATIVE C. LIQUID TRAIN TREATMENT ALTERNATIVES 1. General 2. Pump Station 3. Headworks 4. Primary Clarifiers 5. Activated Sludge 6. Tertiary Filtration 7. Disinfection 8. High Strength Waste D. SOLIDS TRAIN TREATMENT ALTERNATIVES 1. Anaerobic Digesters 2. Thickening 3. Dewatering 4. Class A Process E. SUMMARY OF ALTERNATIVES F. PROPOSED DESIGN CRITERIA List Of Tables Table VI 1 Proposed Wastewater Treatment Facility Design Criteria List Of Appendices Appendix VI 1 Peak Hour Flow Data Chapter VII COST EFFECTIVE ANALYSIS A. INTRODUCTION B. COST ESTIMATING PROCEDURES C. ALTERNATIVES ANALYSIS 1. Activated Sludge Process a. General b. Analysis c. Conclusions 2. Biosolids Dewatering a. General b. Loading Rate & Operation c. Biosolids Dewatering d. Analysis e. Conclusions D. CAKE PROCESS
7 Table Of Contents (continued) Page 6 Chapter VII COST EFFECTIVE ANALYSIS (continued) List Of Tables Table VII 1 Table VII=2 Table VII=3 Table VII 4 Table VII 5 Table VII 6 List Of Figures Figure VII 1 Figure VII 2 Figure VII 3 Option #1 Aeration Basin Expansion Option #2 IFAS Option #3 MBR s Option #4 Centrifuge Option Option #5 Screw Press Option Option #6 Sludge Dryer Expand Existing System IFAS MBR Chapter VIII ENVIRONMENTAL SITE ASSESSMENT A. INTRODUCTION 1. Noise, Odor & Aesthetics 2. Erosion & Sedimentation 3. Surface Water 4. Groundwater 5. Wetlands 6. Fish & Wildlife 7. Agricultural Lands 8. Land Use 9. Transportation 10. Economics 11. Cultural Resources 12. Unavoidable Adverse Impacts 13. Irretrievable & Irreversible Resource Commitments B. MITIGATION OF IMPACTS 1. Mitigation Of Construction Impacts 2. Mitigation Of Operation Impacts 3. Mitigation Of Secondary Impacts C. RESOURCES IMPACT SUMMARY List Of Appendices Appendix VIII Year Floodplain Mapping Appendix VIII 2 Wetlands Map Appendix VIII 3 Wisconsin DNR Endangered Resources Preliminary Assessment Appendix VIII 4 Wisconsin DNR Archaeological / Historical Significance Response Appendix VIII 5 Resources Impact Summary
8 Table Of Contents (continued) Page 7 Chapter IX RECOMMENDED PLAN A. INTRODUCTION B. DESCRIPTION 1. Plant Wide 2. Headworks 3. Primary Clarifiers 4. Activated Sludge System 5. Disinfection System 6. Digesters 7. High Strength Waste Receiving 8. Dewatering 9. Class A Process Day Biosolids Storage C. IMPLEMENTATION 1. Phase I a. Miscellaneous b. Primary Clarifiers c. Digesters d. High Strength Waste Receiving e. Disinfection System 2. Phase II a. Miscellaneous b. Headworks c. Activated Sludge System d. Dewatering 3. Phase III a. Miscellaneous b. Class A Process D. CAPITAL COST 1. Phase I 2. Phase II 3. Phase III E. PARALLEL COST CALCULATIONS 1. Parallel Cost Percentage Definition 2. Calculating The Parallel Cost Percentage F. POTENTIAL COST IMPACT G. SCHEDULE
9 Table Of Contents (continued) Page 8 Chapter IX RECOMMENDED PLAN (continued) List Of Tables Table IX 1 Table IX 2 List Of Figures Figure IX 1 Figure IX 2 Figure IX 3 Wastewater Treatment Facility Design Criteria Recommended Plan Opinion Of Probable Construction Cost Phase I / Phase II / Phase III Liquid Train Solids Train Biogas Schematic List Of Appendices Appendix IX 1 Parallel Cost Calculations Appendix IX 2 Kiel Projected Sewer Rates W:\WP\Facility Plan\K0015\ \ TableOfContents.docx
10 Chapter I INTRODUCTION A. INTRODUCTION The City of Kiel, Wisconsin, operates a Wastewater Treatment Facility under Wisconsin Pollutant Discharge Elimination System (WPDES) Permit No. WI , which is issued by the Wisconsin Department Of Natural Resources (DNR). Although currently expired, it is anticipated that permits will be re issued, watershed wide, in Originally constructed in 1965, modifications and upgrades have been made to the Wastewater Treatment Facility in response to changing flows, loadings, permit requirements, aging of facilities and equipment, and a need to improve efficiencies. As a result, the following projects were undertaken: 1965 Original Wastewater Treatment Facility Construction 1979 Phase 1 Wastewater Treatment Facility 1985 Phase 2, Part 1 & 2 Wastewater Treatment Facility 1996 Pretreatment Facility Modifications 1997 Modifications To Wastewater Treatment Facility 2001 River Road Pump Station Improvements 2008 Wastewater Treatment Facility Aeration System Improvements 2012 Process Modifications For Bio P Removal 2013 River Road Pump Station Improvements A significant number of unit processes and control systems have been in service beyond their design life. Many of the structures and piping systems have been in service for 30 to 50 years. Age, environmental factors and continued use have taken a toll on tankage, equipment, processes and controls throughout the Wastewater Treatment Facility s life time. Additionally, flows and loadings have continued to increase, with many unit processes operating beyond their rated capacity. Growth within the City of Kiel, along with expansion of prominent industrial contributors, is expected to continue. The Facilities Planning process will allow the City of Kiel Wastewater Treatment Facility to comply with DNR Administrative Code NR 110 and 204, and address current and future needs. In addition, the Facilities Planning process will develop the most cost effective, best fit, and environmentally sound solutions for wastewater treatment and biosolids management issues facing the City of Kiel for the 20 year planning period. W:\WP\Facility-Plan\K0015\950262\Chapter I - Introduction.docx CHAPTER I INTRODUCTION Wastewater Treatment System Facilities Plan CITY OF KIEL Calumet & Manitowoc Counties, Wisconsin Chapter I 1
11 A. FEDERAL BACKGROUND Chapter II WATER QUALITY OBJECTIVES During the past five (5) decades, major Federal legislation has been enacted in an effort to alleviate the pollution of the Nation s waters. The basic Federal Water Pollution Control Legislation is Public Law (PL ), approved July 9, 1956, which has been amended by: 1) The Federal Water Pollution Control Act Amendment Of 1961 (PL 87 88); 2) The Water Quality Act Of 1965 (PL ); 3) The Federal Water Pollution Control Act Amendment Of 1972 (PL ); 4) The Clean Water Act Of 1977 (PL ), with amendments in 1981; and 5) The Water Quality Act Of The Water Quality Act of 1965 required each State adopt water quality criteria applicable to interstate waters or portions thereof within the State, and adopt a plan for implementing and enforcing those criteria. It was soon found that the water quality standards were difficult, if not impossible, to enforce from an administrative viewpoint. The 1972 Federal Amendments sought to correct this situation by establishing restrictions for municipalities, based upon the concentration of certain pollutants in their wastewater. If these guidelines were found to be insufficient to ensure water quality criteria adopted under the 1965 Amendments, further treatment of wastes would be required to achieve the applicable standards. The Federal Water Pollution Control Act Amendments of 1972 (PL ) replaced the previous language of Act (PL ) and its amendments entirely. The 1977 Amendments to the Clean Water Act (PL ) includes, in part, as its declared goals: 1. To restore and maintain the chemical, physical and biological integrity of the Nation s waters by: a. Eliminating the discharge of pollutants into navigable waters by b. Attaining, where possible, an interim goal of water quality, which provides for the protection and propagation of fish, shellfish and wildlife, and provides for recreation in and on the water, be achieved by July 1, c. Prohibiting the discharge of toxic pollutants in toxic amounts. 2. To recognize, preserve and protect the primary responsibilities and rights of states to reduce and eliminate pollution, to plan and use (including restoration, preservation and enhancement) land and water resources 1 1 Clean Water Act, as amended. CHAPTER II WATER QUALITY OBJECTIVES Wastewater Treatment System Facilities Plan CITY OF KIEL Calumet & Manitowoc Counties, Wisconsin Chapter II 1
12 Although substantial progress has been made since passage of PL and the 1987 Amendments, nevertheless, many waterways (notably marine estuaries, lakes and rivers in heavily populated areas) still suffer from degradation. In amending the Clean Water Act of 1987, the basic issue lawmakers had to confront was that, after most technology standards called for in the 1970 s had been issued and the final push to get cities to provide a minimum of secondary treatment for sewage was at hand, some stubborn water pollution problems still remained. The most serious of these remaining problems are excessive levels of toxic pollutants in some waters (even where discharges have installed required pollution control technologies) and contained in runoff from non point sources, such as farmland and city streets. The Water Quality Act of 1987 sought to correct these problems. The Amendments direct the Environmental Protection Agency (EPA) and State officials to supplement existing, nationwide technology based standards with a water quality based approach to control persistent pollution problems. Essentially, Congress said regulators should identify waterways that are still polluted and do what is needed to restore them. In other key changes, the Amendments: 1. Require permits for all discharges of storm water from industrial facilities, and set deadlines for cities to obtain permits for storm water discharges. 2. Limit the ability of industrial facilities to get exemptions or variances from Federal pollution control regulations. 3. Prohibit, except in certain, narrowly defined circumstances, backsliding on permits or the weakening of treatment requirements when industrial and municipal discharge permits are renewed or reissued. 4. Extend deadlines for industries to comply with national pollution control standards to account for the fact that the EPA has not finished issuing some of these regulations. 5. Specify deadlines for the EPA to issue remaining, needed industrial effluent limitations. 6. Require the EPA to promulgate regulations to control toxic pollutants in sewage sludge. 7. Limit availability of modifications of Federal treatment standards for non conventional pollutants for five well understood substances. Recent Federal regulations have dealt with sludge management and toxins impacting the Great Lakes. 40 CFR, Part 503, sets standards for the use or disposal of sewage sludge. These regulations set metals limits, establish pathogen reduction standards and establish vector attraction reduction CHAPTER II WATER QUALITY OBJECTIVES Wastewater Treatment System Facilities Plan CITY OF KIEL Calumet & Manitowoc Counties, Wisconsin Chapter II 2
13 standards for sludge being land applied. The Wisconsin Department of Natural Resources (DNR) administers these regulations through the Wisconsin Administrative Code, NR CFR, Part 132, establishes water quality guidance for the Great Lakes system. This regulation sets limits on bio accumulating compounds. The Wisconsin DNR administers these regulations through NR 105 and 106, and via the Commission s Wisconsin Pollutant Discharge Elimination System (WPDES) permit. Pretreatment regulations are also established by the Federal government for specific categories of industrial dischargers. B. SANITARY SEWER SYSTEM OVERFLOWS The EPA proposed revisions to National Pollutant Discharge Elimination System (NPDES) permit regulations to improve the operation of municipal sanitary sewer collection systems, reduce the frequency and occurrence of sewer overflows, and provide more effective public notification when overflows do occur. This proposal will provide communities with a framework for reducing health and environmental risks associated with overflowing sewers. The result will be fewer overflows, better information for local communities, and extended lifetime for the Nation s infrastructure. This rule primarily addresses sanitary sewer overflows, not combined sewer overflows. A draft Notice Of Proposed Rulemaking was signed by EPA Administrator Browner on January 4, In accordance with the January 20, 2001 Memorandum from the Assistant to the President and Chief of Staff, entitled Regulatory Review Plan, published in the Federal Register on January 24, 2001, 66 FR 7701, the EPA withdrew this document from the Office of the Federal Register to give the incoming Administration the opportunity to review it. Key elements of the proposed rule include: 1. Capacity Assurance, Management, Operation & Maintenance Programs. These programs will help communities ensure they have adequate wastewater collection and treatment capacity, and incorporate many standard operation and maintenance activities for good system performance. When implemented, these programs will provide for efficient operation of sanitary sewer collection system. 2. Notifying The Public & Health Authorities. Municipalities and other local interests will establish a locally tailored program that notifies the public of overflows according to the risk associated with specific overflow events. The EPA is proposing that annual summaries of sewer overflows be made available to the public. The proposal also clarifies existing record keeping requirements and requirements to report to the State. 3. Prohibition Of Overflows. The existing Clean Water Act prohibition of sanitary sewer overflows that discharge to surface waters is clarified to provide communities with limited CHAPTER II WATER QUALITY OBJECTIVES Wastewater Treatment System Facilities Plan CITY OF KIEL Calumet & Manitowoc Counties, Wisconsin Chapter II 3
14 protection from enforcement in cases where overflows are caused by factors beyond their reasonable control or severe natural conditions, provided there are no feasible alternatives. 4. Expanding Permit Coverage To Satellite Systems. Satellite municipal collection systems are those collection systems where the owner or operator is different from the owner or operator of the Treatment Facility. Some 4,800 satellite collection systems will be required to obtain NPDES permit coverage to include the requirements under this proposal. C. WISCONSIN ADMINISTRATIVE CODE REVISIONS 1. Wisconsin Department Of Natural Resources (DNR) Ammonia Policy The DNR Natural Resources Board approved the proposed ammonia regulations on October 22, A summary of the rule changes related to ammonia water quality criteria are: a. NR 104 Uses & Designated Standards. The ammonia water quality criteria and effluent limitations of 3 and 6 mg/l that applied in summer and winter, respectively, for discharges to limited forage fish streams were deleted. Criteria for limited forage fish streams are included in NR 105 and effluent limitations are to be calculated similar to other aquatic life waters as described in NR 106. b. NR 105 Surface Water Quality Criteria & Secondary Values For Toxic Substances. Acute and chronic ammonia criteria are included in NR 105. The acute criteria relate to the ph of the effluent; the chronic criteria relate to both the ph and temperature of the receiving water body. These criteria were developed consistent with the EPA 1999 criteria update and reflect the fish species present in Wisconsin. Criteria were developed for cold water fish, warm water sport fish, limited forage fish and limited aquatic life classifications. These criteria are also protective for wildlife and human health uses. This approach establishes criteria that are necessary to assure attainment of the designated use for the water body receiving the discharge. c. NR 106 Procedures For Calculating Water Quality Based Effluent Limitations For Toxic & Organoleptic Substances Discharged for Surface Waters. A new subchapter, entitled Effluent Limitations For Ammonia Discharges, was included. Although conceptually the same, the specific calculation procedures for determining an ammonia effluent limitation differs significantly from those used for other toxicants. Temperature, ph and the percent of stream flow used, and the presence of early life stages of fish are all considered in determining the limits. It was, therefore, appropriate to establish a separate subchapter for ammonia. Additionally, the subchapter contains implementation procedures for lagoon and pond systems treating primarily domestic wastewater that is unique to ammonia. A one time categorical variance procedure with an approximate 5 year term was developed for these systems. CHAPTER II WATER QUALITY OBJECTIVES Wastewater Treatment System Facilities Plan CITY OF KIEL Calumet & Manitowoc Counties, Wisconsin Chapter II 4
15 d. NR 210 Sewage Treatment Works. As in NR 104, the limits of 3 and 6 mg/l in the summer and winter, respectively, for discharges to intermediate (limited forage fish) streams were deleted. This was replaced with criteria in NR 105 and the effluent limitation calculation procedures in NR NR 217 Phosphorus Regulations NR 217 was adopted in 1992, and established a technology based effluent phosphorus limit of 1.0 mg/l for Wastewater Treatment Facilities. A limit of up to 2.0 mg/l was applicable for facilities that employed biological phosphorus removal systems. Municipalities discharging less than 150 lbs./month and industries discharging less than 60 lbs./month were exempt from the 1.0 mg/l limit. Revisions to the NR Codes were adopted on December 1, A summary of the rule changes related to phosphorus water quality criteria are as follows: a. NR 102 Water Quality Standards For Wisconsin Surface Waters. New numeric water quality criteria for phosphorus were established as follows for Wisconsin surface waters: 1) Large Streams 0.1 mg/l 2) Small Streams mg/l 3) Non Stratified Lakes & Impoundments mg/l 4) Stratified Lakes & Impoundments mg/l 5) Great Lakes mg/l The new water quality criteria generally do not apply to the following water classifications: 1) Ephemeral streams. 2) Lakes and reservoirs of less than 5 acres. 3) Wetlands. 4) Waters identified as limited aquatic life water under NR 104. However, discharges to the above water classes could be subject to phosphorus Water Quality Based Effluent Limits (WQBEL) to ensure the applicable water quality criteria for downstream water classes are being achieved. b. NR 217 Effluent Standards & Limitations. New Subchapter III repealed and replaced NR , and includes detailed procedures for establishing WQBEL s for phosphorus discharges. NR 217 also provided provisions for different types of phosphorus limits including: 1) WQBEL s Takes stream flow and background phosphorus concentration into account, where the limit is established at a concentration where resulting phosphorus concentration downstream of the discharge is equal CHAPTER II WATER QUALITY OBJECTIVES Wastewater Treatment System Facilities Plan CITY OF KIEL Calumet & Manitowoc Counties, Wisconsin Chapter II 5
16 to the water quality criterion at the combined base stream and discharge flow. 2) Total Maximum Daily Load (TMDL) Based Limits In Addition To Or In Lieu Of The WQBEL s Considers contributions and potential reductions from non point source discharges in determining discharge limits for point sources. A mass based limit is included, in addition to or in lieu of the WQBEL. Up to two permit terms or specified implementation period are provided for compliance with the TMDL, where the WQBEL may be applied if no progress is observed in the receiving water body. 3) Technology Based Limits if more stringent than the WQBEL. In addition, the regulations are no longer wastewater specific, applying to other point source dischargers of phosphorus including non contact cooling water discharges, Concentrated Animal Feeding Operations (CAFO), and other sites where NR 151 and NR 216 regulations are not sufficient to meet the water quality criteria established in NR 102. The WPDES permit limits will be expressed as a concentration (30 day rolling average) and a mass limit if the discharge is to a lake or reservoir, outstanding or exceptional resource water, impaired water, or surface water with approved TMDL for phosphorus. NR 217 also allows for an allowable load to be divided amongst multiple dischargers, establishes that the effluent limit cannot be more restrictive than NR 102 criteria, and new sources cannot discharge to an impaired water unless a TMDL has established reserve capacity, the discharger improves the water quality or a pollutant trade occurs. NR 217 provides some flexibility for compliance with WPDES permit effluent phosphorus limits including approved TMDL s, extended compliance schedules, and variances for municipal stabilization ponds and storage lagoons, as well as adaptive management plans and pollutant trading options. c. NR 151 Runoff Management. New provisions were established to control runoff from farmland, including new agricultural performance standards, which place a numerical limit on the amount of phosphorus that can be applied to agricultural fields. There are three major changes to the previous NR 151 rules. 1) NR prohibits crop producer from conducting a tillage operation that negatively impacts stream bank integrity or deposits soil directly in surface waters and establishes tillage setbacks of greater than 5 feet but no more than 20 feet. 2) NR establishes an average phosphorus index of 6 or less over the accounting period and no greater than 12 in any individual year during the period for croplands, pastures and winter grazing areas. 3) NR restricts significant discharge of process wastewater to waters of the state. CHAPTER II WATER QUALITY OBJECTIVES Wastewater Treatment System Facilities Plan CITY OF KIEL Calumet & Manitowoc Counties, Wisconsin Chapter II 6
17 Permitted non point sources (CAFO s) are subject to these rules under their WPDES permits; however, unpermitted non point sources are subject to these rules to the extent of cost share or funding dollars offered to the non point source for implementation of Best Management Practices (BMP s). The changes to NR 151 affect Wastewater Treatment Facilities two fold: 1) It may be increasingly difficult to obtain suitable land for application of biosolids generated at Wastewater Treatment Facilities. 2) Providing cost share dollars for implementation of agricultural performance standards may provide a means of meeting NR 217 regulations through available Adaptive Management and Watershed Based Effluent Trading. NR 217 also allows for an Adaptive Management approach, where up to three (3) permit terms would be available for achieving compliance with water quality standards. In order to be eligible for the adaptive management option: 1) The exceedance of phosphorus water quality criterion must be attributed to both point (Wastewater Treatment Facilities) and non point (agricultural) sources. 2) The sum of the non point source plus permitted municipal separate storm sewer systems must be at least 50% or water quality criteria cannot be met without non point source control. 3) The permittee will be required to implement advance filtration or an equivalent technology to achieve compliance. 4) The Adaptive Management Plan identifies specified actions that will achieve compliance with the water quality criterion. Several reduction strategies are available under the Adaptive Management option, including: 1) Providing financial support to non point sources to implement BMP s, such as nutrient management plans. 2) Working with other point sources to reduce phosphorus loading. 3) Using Water Quality Trading to either meet the effluent limit or to meet an Adaptive Management tool. 4) Completing wetlands restoration within the watershed. 5) Creation of a bubble limit or watershed permit that integrates the aggregate phosphorus load on the watershed under a group or under a single permit. 6) Creation of a third party TMDL. CHAPTER II WATER QUALITY OBJECTIVES Wastewater Treatment System Facilities Plan CITY OF KIEL Calumet & Manitowoc Counties, Wisconsin Chapter II 7
18 Watershed Trading is an option that can be used in conjunction with other compliance options, where another source reduces phosphorus to satisfy the difference between the permittee s discharge and the WPDES permit limit. The DNR and EPA impose a number of conditions on acceptable trades, unless the trading is used to meet an Adaptive Management goal; in which case, the conditions are much more flexible because the trades are being used to meet a management goal, and not a specific effluent limit. Generally, trades will only be allowed with sources that contribute to the same stream segment unless the trade is within the context of a TMDL, which would allow for a broader reach. A trade ratio (typically 2:1) would be included to address the uncertainty in non point source reduction practices. Based on the restrictions imposed under the trading protocol, trading applications are only economically viable under certain circumstances including: 1) Permittee discharges at the downstream end of the impaired watershed. 2) Permittee only needs a relatively small reduction in total phosphorus discharge to avoid a large capital expenditure. 3) Long term (10 to 20 year) trading practices, such as manure digesters, riparian corridors, wetland restoration or other practices are available. 4) Multiple point sources can coordinate with counties or other entities for efficient program administration. A fixed interim limit of 0.6 mg/l would apply to the first permit term after the plan approval, and 0.5 mg/l would apply to the second permit term. Each of these limits is achievable with conventional mechanical treatment facilities. 3. Temperature Regulations Water quality standards for temperature have been established in NR 102 to protect fish and other aquatic life from lethal and sub lethal effects. The rules primarily affect power plants and other industrial dischargers that add heat to process wastewater and noncontact cooling water; however, the rules also apply to municipal Wastewater Treatment Facilities. The thermal limits are based on both acute and chronic or sub lethal impacts on aquatic life. a. Acute limits are established is the effluent discharge exceeds default values assigned to a particular classification of water body on a monthly basis or exceeds site specific stream temperatures based on Wastewater Treatment Facility data. For effluent dominated streams, the temperature at the outfall can be used as the ambient temperature. b. Chronic limits are established if the effluent discharge exceeds default values or measured values, and the DNR determines, by examining several site specific CHAPTER II WATER QUALITY OBJECTIVES Wastewater Treatment System Facilities Plan CITY OF KIEL Calumet & Manitowoc Counties, Wisconsin Chapter II 8

19 factors, that the effluent has a reasonable potential to cause or contribute to the inability of the water body to support aquatic life. Specific procedures for calculating WQBEL for temperature are specified in NR 106. These rule changes became effective on October 1, Temperature sampling requirements and a compliance schedule to meet temperature limits would be set in the WPDES permit. The limitations and compliance schedule may be invalidated if testing indicates that the temperature limit is not necessary. D. SLUDGE REGULATIONS Regulations Land application of sewage sludge is regulated under CFR 40, Part 503, Standards For The Use Or Disposal Of Sewage Sludge. This regulation establishes two (2) levels of sewage sludge quality, with respect to heavy metal concentrations [ceiling concentrations and exceptional quality (see below)]; two (2) levels of quality, with respect to pathogen densities (Class A or Class B); and two (2) types of approaches for meeting vector attraction reduction. In order for the sludge to qualify for land application, metals must be below ceiling limits, and the sludge must meet Class B requirements for pathogens and vector attraction reduction requirements. a. Metals: Metals limits for land application of sewage sludge are summarized below: Table In 503 Rule Pollutant Arsenic Cadmium Copper Lead Mercury Molybdenum Nickel Selenium Zinc * Absolute Values ** Monthly Averages LAND APPLICATION POLLUTANT LIMITS (All Weights Are On Dry Weight Basis) Table #1 Table #2 Table #3 Table #4 Ceiling Concentration Limits* (mg/kg) , ,500 Cumulative Pollutant Loading Rates (kg/ha) , N/A ,800 High Quality Pollutant Concentration Limits * (mg/kg) , N/A ,800 Annual Pollutant Loading Rates (lbs./acre/yr.) N/A CHAPTER II WATER QUALITY OBJECTIVES Wastewater Treatment System Facilities Plan CITY OF KIEL Calumet & Manitowoc Counties, Wisconsin Chapter II 9
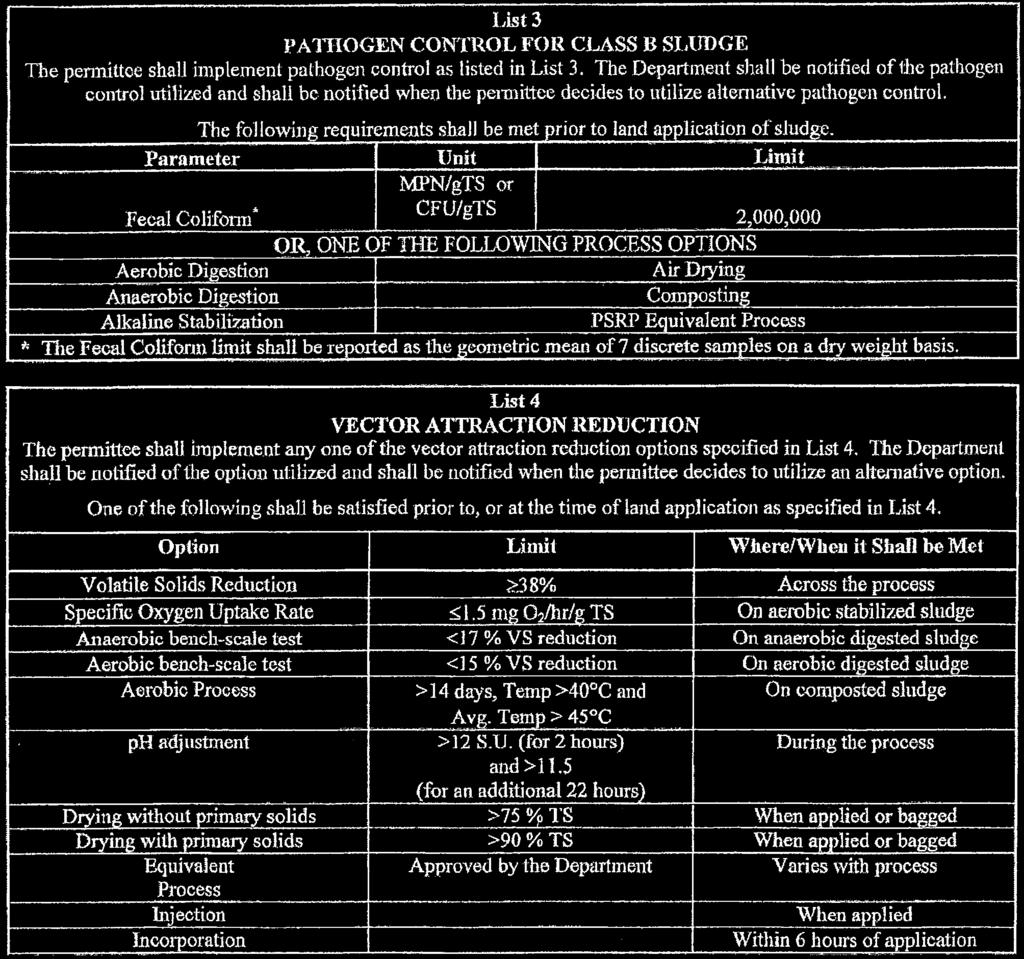
20 To be land applied, bulk sewage sludge must meet the pollutant Ceiling Concentrations and Cumulative Pollutant Loading or Pollutant Concentrations limits. b. Pathogen Reduction: Sewage sludge that is land applied must meet Class A or B pathogen requirements. For Class A, the sludge must meet one of the following criteria: 1) Fecal coliform density less than 1,000 Most Probable Number (MPN) per gram of total dry solids; or 2) Salmonella density less than 3 MPN/4 grams of total dry solids. Class B sewage sludge must meet one of the following pathogen requirements: 1) The sewage sludge must be treated by a process to significantly reduce pathogens (PSRP) process; or 2) At the time of disposal, the geometric mean of sewage sludge samples must be less than 2,000,000 MPN/gram total solids (dry weight). c. Vector Attraction: Vector attraction reduction reduces the potential for spreading of infectious disease agents by vectors (flies, rodents and birds). At a minimum, one (1) of the following must be met prior to land application of the sludge for anaerobic processes: 1) Minimum volatile solids reduction of 38% of raw sludge, compared to stabilized sludge. 2) Injection Liquid sludge should be injected beneath the soil surface, with no significant amount of sewage sludge present after 1 hour of injection (Class B) or 8 hours for Class A. 3) Incorporation Sewage sludge that is land applied on a surface disposal site shall be incorporated into the soil within 6 hours of application (Class B) or 8 hours for Class A. This applies to dewatered sludge. 2. NR 204 Regulations The DNR regulates sludge disposal through Chapter NR 204 of the Wisconsin Administrative Code. The 1996 Revisions to NR 204, for the most part, mirror the 503 Regulations. The NR 204 major revisions are summarized as follows: CHAPTER II WATER QUALITY OBJECTIVES Wastewater Treatment System Facilities Plan CITY OF KIEL Calumet & Manitowoc Counties, Wisconsin Chapter II 10
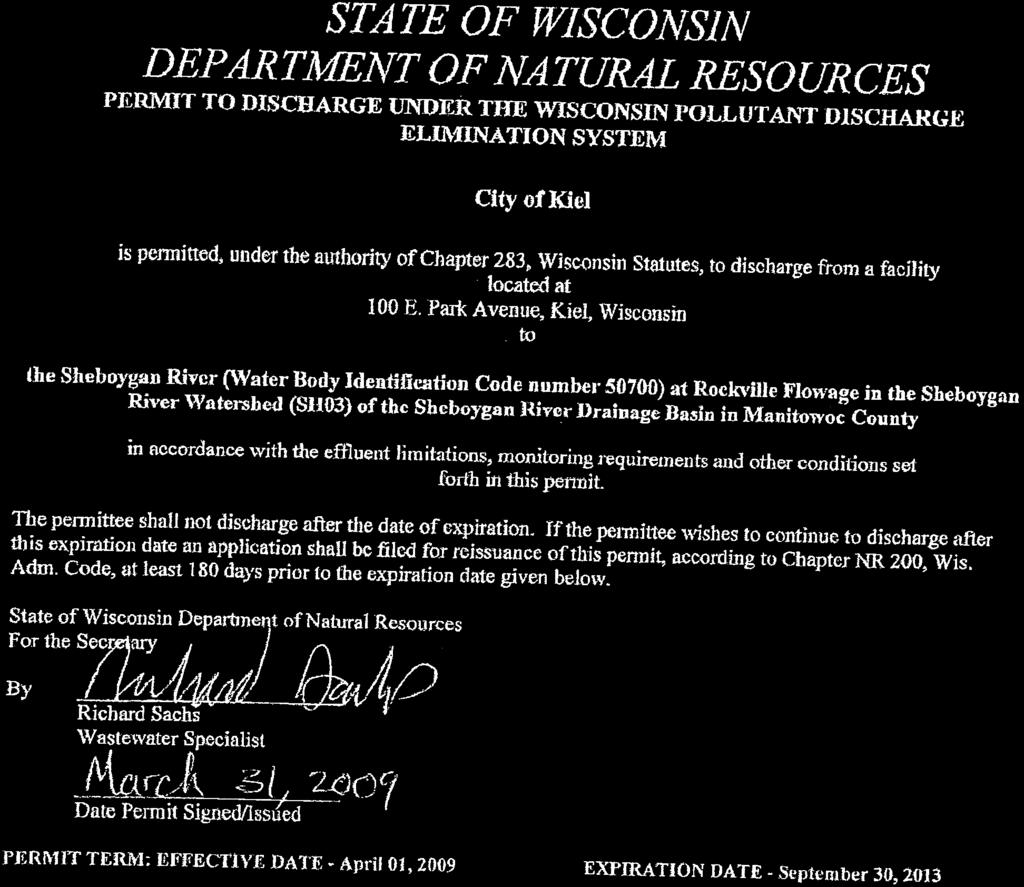
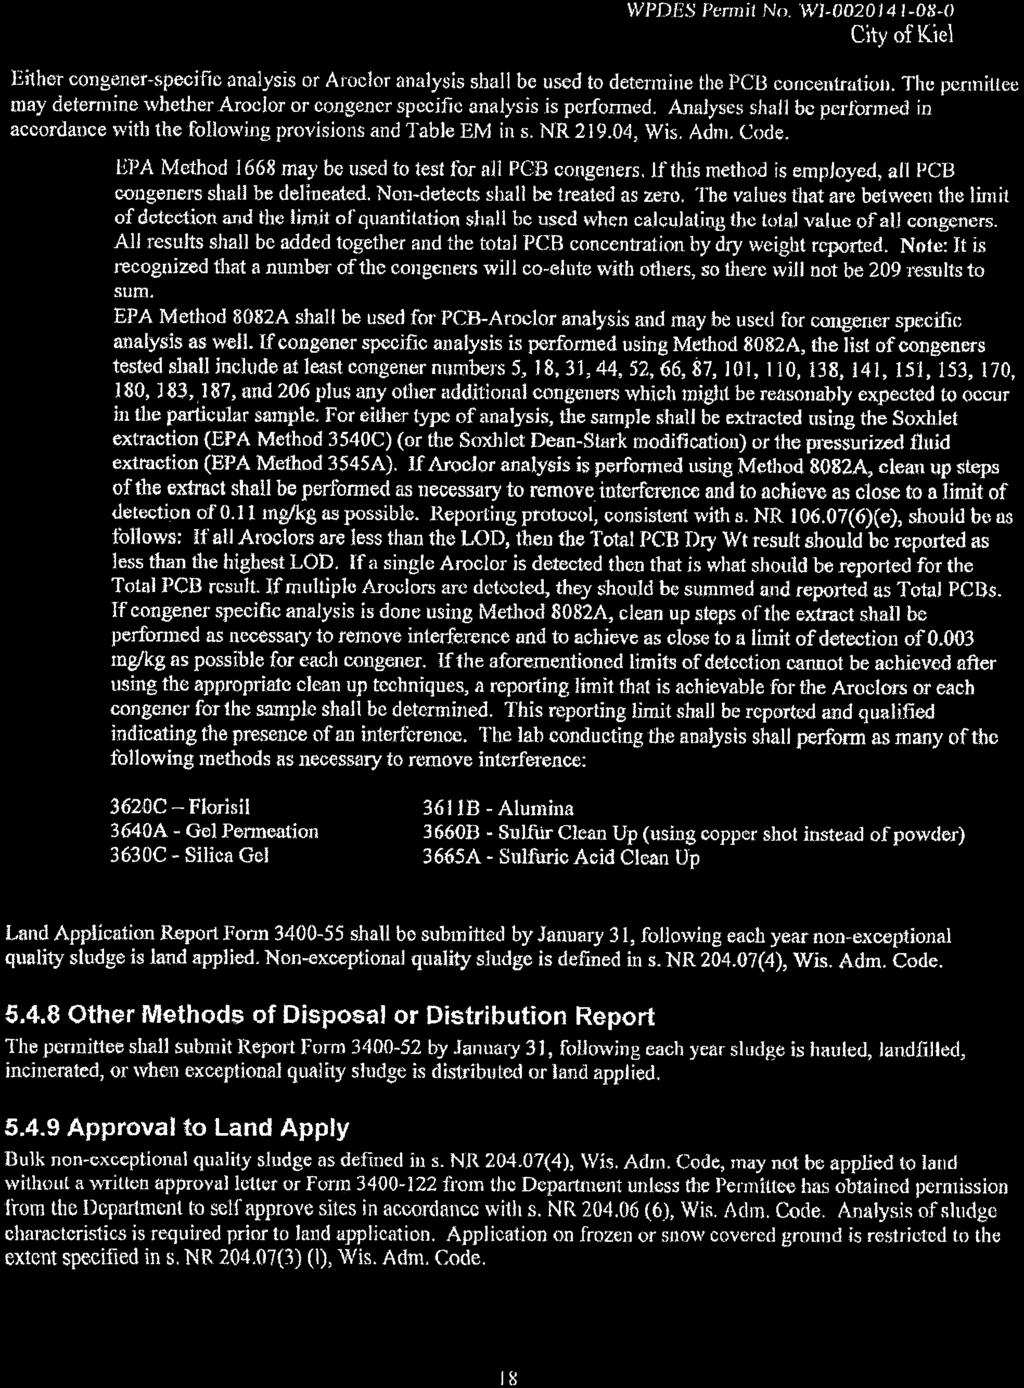
21 a. Additional testing requirements are required of the sludge, depending upon its end use and facility size. These will be specified in the WPDES permit. Additional tests could include SOUR, salmonella, viruses, viable helminth ova and a priority of pollutant scan. b. The DNR defines an Exceptional Quality Sludge as one that meets Class A pathogen requirements, high quality pollutant concentrations and vector reduction requirements of the 503 Regulations. Sludge certified as Exceptional Quality is exempt from the minimum separation distances to residences, businesses, recreational areas or property lines, if land applied. A permit is not required to land apply the sludge and site life is unlimited. Sludge may be commercially distributed in bulk, only if it is certified as exceptional quality. c. Application of sludge on frozen or snow covered ground is prohibited, unless a permittee can demonstrate that there are no other reasonable disposal methods available and there is absolutely no likelihood that the sludge will enter the waters of the State. Application may be approved on a case by case basis until storage is available. d. Sludge quality standards, with respect to vector attraction reduction, pathogen reduction and metals from the 503 Regulations are incorporated into these regulations, including site restrictions. e. All municipal mechanical Wastewater Treatment Facilities shall have the ability to store sludge for 180 days. E. WISCONSIN WATER QUALITY OBJECTIVES The State of Wisconsin enforces the requirements of the Federal Water Pollution Control Act through the WPDES. This system is a permitting process, which permits point discharges of treated effluent to receiving waters. Effluent requirements are established by the DNR, based upon water quality limitations associated with the receiving waters; and are established for the protection of public health and welfare for the propagation of fish and wildlife, and for domestic, recreational, agricultural, commercial, industrial and other legitimate uses. F. EFFLUENT REQUIREMENTS The existing Wastewater Treatment Facility discharges to the Sheboygan River, in compliance with WPDES Permit No. WI , which expired on September 30, Refer to Appendix II 1. CHAPTER II WATER QUALITY OBJECTIVES Wastewater Treatment System Facilities Plan CITY OF KIEL Calumet & Manitowoc Counties, Wisconsin Chapter II 11
22 1. Current Effluent Limitations Parameter Effluent Frequency Limitation BOD 5 May October 10 mg/l Weekly & Monthly Average 72 lbs./day Weekly Average November April 15 mg/l Weekly & Monthly Average 108 lbs./day Weekly Average Total Suspended Solids May October 10 mg/l Weekly and Monthly Average November April 15 mg/l Weekly and Monthly Average Ammonia (in addition to limits shown above) April 5.2 mg/l Weekly Average ph 6.0 to 9.0 s.u. Daily Maximum Dissolved Oxygen 6.0 mg/l Daily Minimum Fecal Coliforms 400 counts /100 ml Monthly Geo. Mean, May September Total Residual Chlorine 38 g/l Daily Maximum 8.4 g/l Weekly Average Total Phosphorus 1.0 mg/l Monthly Average Ammonia Year Round 11 mg/l Daily Maximum April May 5.2 mg/l Weekly Average 2.2 mg/l Monthly Average June September 3.7 mg/l Weekly Average 1.7 mg/l Monthly Average October March 5.3 mg/l Monthly Average Chlorides mg/l Monthly Monitoring Only The City is currently awaiting renewal of the permit. A request for an evaluation of WQBEL s was previously requested. A Memorandum was provided by Jim Schmidt, Wisconsin DNR, on September 30, 2013, which provided recommendations for effluent limitations to be included in the WPDES permit reissuance, with consideration given to new monthly low flow (7Q10 and 7Q2) estimations by the United States Geological Survey (USGS) that were submitted by the City. Anti degradation policy was considered in the evaluation due to increases in some discharge limits above the current effluent limits. A copy of the Memorandum is included in Appendix II 2. The Memorandum recommended revised or new limits for phosphorus, ammonia, chlorides, temperature and Dissolved Oxygen (DO), as well as alternative sets of limits for Biochemical Oxygen Demand (BOD), Total Suspended Solids (TSS) and ammonia limits, based on options available to the City because the anti degradation rule requires evaluations be completed by the permittee before increased effluent limits can be determined. CHAPTER II WATER QUALITY OBJECTIVES Wastewater Treatment System Facilities Plan CITY OF KIEL Calumet & Manitowoc Counties, Wisconsin Chapter II 12
23 Subsequent to the September 2013 Memorandum, effluent limitations were requested during Master Planning in August 2014 based on eight (8) design flow alternatives ranging from 0.98 to 3.01 mgd. A copy of Jim Schmidt s reply letter, dated September 19, 2014, is included in Appendix II 3. The following is a summary of the recommended limits. 2. Effluent Limitations That Are The Same For All Design Flow Alternatives Parameter Effluent Frequency Limitation Dissolved Oxygen July September 8.7 mg/l Daily Minimum October June 6.0 mg/l Daily Minimum ph 6.0 to 9.0 s.u. Daily Maximum Total Phosphorus Water Quality 0.72 lbs./day Annual Average Based 0.1 mg/l 6 Month Average 0.3 mg/l Monthly Average Interim 1.0 mg/l Monthly Average Fecal Coliforms 400 counts / 100 ml Monthly Geo Mean, May September Total Residual Chlorine 38 g/l Daily Maximum 8.4 g/l Weekly Average 3. Daily Maximum Ammonia Nitrogen (NH3 N) Limits Based On Effluent ph Effluent ph (s.u.) NH3 N Limit (mg/l) ph 7.5 No Limit 7.5 < ph * 7.6 < ph * 7.7 < ph * 7.8 < ph * 7.9 < ph < ph < ph < ph < ph < ph < ph < ph < ph < ph < ph CHAPTER II WATER QUALITY OBJECTIVES Wastewater Treatment System Facilities Plan CITY OF KIEL Calumet & Manitowoc Counties, Wisconsin Chapter II 13
24 4. Effluent Limits That Vary Based On Design Flow For The Range 0.98 & 3.01 mgd Parameter Effluent Frequency Limitation Chlorides mg/l Weekly Average Temperature January 50 to 53 F Weekly Average February 51 to 54 F Weekly Average March 55 to 60 F Weekly Average April 59 to 68 F Weekly Average May 66 to 70 F Weekly Average June 77 to 79 F Weekly Average July 82 to 84 F Weekly Average August 82 to 84 F Weekly Average September 74 to 75 F Weekly Average October 62 to 64 F Weekly Average November 50 to 52 F Weekly Average December 50 to 53 F Weekly Average BOD January 9.1 to 17 Weekly/Monthly Average February 8.9 to 17 Weekly/Monthly Average March 12 to 26 Weekly/Monthly Average April 24/24 45/30 Weekly/Monthly Average May 8.8 to 20 Weekly/Monthly Average June 5.4 to 11 Weekly/Monthly Average July 7.1 to 11 Weekly/Monthly Average August 6.9 to 9.6 Weekly/Monthly Average September 7.9 to 11 Weekly/Monthly Average October 6.1 to 11 Weekly/Monthly Average November 9.0 to 18 Weekly/Monthly Average December 9.2 to 18 Weekly/Monthly Average TSS January 10 to 17 Weekly/Monthly Average February 10 to 17 Weekly/Monthly Average March 12 to 26 Weekly/Monthly Average May 10 to 20 Weekly/Monthly Average June 10 to 11 Weekly/Monthly Average July 10 to 11 Weekly/Monthly Average August 10 to 10 Weekly/Monthly Average September 10 to 11 Weekly/Monthly Average October 10 to 11 Weekly/Monthly Average November 10 to 18 Weekly/Monthly Average December 10 to 18 Weekly/Monthly Average Ammonia January 12 to 114 Weekly Monthly 5.5 to 7.4 Monthly Average February 12 to 14 Weekly Average 5.6 to 7.7 Monthly Average March 13 to 18 Weekly Average 7.2 to 13 Monthly Average April 8.5 to 15 Weekly Average 4.3 to 8.8 Monthly Average CHAPTER II WATER QUALITY OBJECTIVES Wastewater Treatment System Facilities Plan CITY OF KIEL Calumet & Manitowoc Counties, Wisconsin Chapter II 14
25 Parameter Effluent Frequency Limitation Ammonia (continued) May 7.5 to 12 Weekly Average 3.9 to 7.7 Monthly Average June 5.8 to 9.4 Weekly Average 3.1 to 6.2 Monthly Average July 4.8 to 7.2 Weekly Average 2.3 to 3.9 Monthly Average August 4.8 to 6.7 Weekly Average 2.3 to 3.9 Monthly Average September 5.6 to 6.8 Weekly Average 2.5 to 3.5 Monthly Average October 8 to 9.1 Weekly Average 3.5 to 4.6 Monthly Average November 8 to 12 Weekly Average 4.6 to 6.7 Monthly Average December 10 to 12 Weekly Average 4.6 to 6.6 Monthly Average 5. Chlorides Chloride limits are based on acute and chronic toxicity criteria (NR 105). The water qualitybased limit based on the current design flow of mgd is 460 mg/l (weekly average), based on dilution in one quarter (¼) of the year round 7Q10 low flow of 0.93 cfs to meet a chronic toxicity criterion of 395 mg/l. The current WPDES permit contains a variance limit of 510 mg/l (weekly average). Effluent data available at that time of permit reissuance will be used to determine the need for a variance. The weekly average limits provided in the Memorandum varied with the design flow, based on the 395 mg/l criterion, an ambient concentration of 22 mg/l, and the relative dilution factors associated with the increased design flow. 6. Temperature Thermal limits were calculated based on the new water quality standards that became effective in late The thermal limits provided in the Memorandum, based on the range design flows, were provided for informational purposes in the dissipative cooling evaluation. Except for April, with its high 7Q10, the remaining months have a 5 o F difference or less between limits at the lowest and highest design flows. 7. BOD, TSS & Ammonia BOD, TSS and ammonia limits for each month of the year at each of the requested design flows were provided in the September 2014 Memorandum from Jim Schmidt. As mentioned in the 2013 memorandum from Jim Schmidt, any calculated limits that are increased above the current permit limits are subject to an anti degradation evaluation (NR 207). However, the circumstances of the more recent request for limits are different than the September 30, 2013 evaluation, because of the requested increased design flows. CHAPTER II WATER QUALITY OBJECTIVES Wastewater Treatment System Facilities Plan CITY OF KIEL Calumet & Manitowoc Counties, Wisconsin Chapter II 15
26 The process for justifying increased limits is still the same in that: 1) there must be a demonstration of the need for increased limits, and 2) a demonstration of the ability of the increased discharge to accommodate important social or economic development. The limits provided in the September 2014 Memorandum were calculated under the assumption that increased limits are needed. It was also assumed that the increased discharge would be allowed based on demonstration of social and economic importance through anticipated industrial, commercial or residential growth in the community. Therefore, two (2) sets of limits may be calculated; one (1) representing the limits based on the full assimilative capacity available in the Sheboygan River, and two (2) representing prevention of Significant Lowering Of Water Quality (SLOWQ). Both the SLOWQ based limits and the full assimilative capacity based limits are provided in the tables included in the September 2014 Memorandum. The September 2014 Memorandum from Jim Schmidt also noted that it is likely the City of Kiel discharge would be considered a major municipal discharge in the future when actual flows exceed 1 mgd annual average. Major municipal discharge designation would require that Kiel test for all of the substances on the EPA priority pollutant list, including mercury. Since many large Wastewater Treatment Facilities are unable to comply with mercury limits, a variance may be needed in the future depending on effluent mercury results. W:\WP\Facility-Plan\K0015\950262\Chapter II - Water Quality Objectives.docx CHAPTER II WATER QUALITY OBJECTIVES Wastewater Treatment System Facilities Plan CITY OF KIEL Calumet & Manitowoc Counties, Wisconsin Chapter II 16
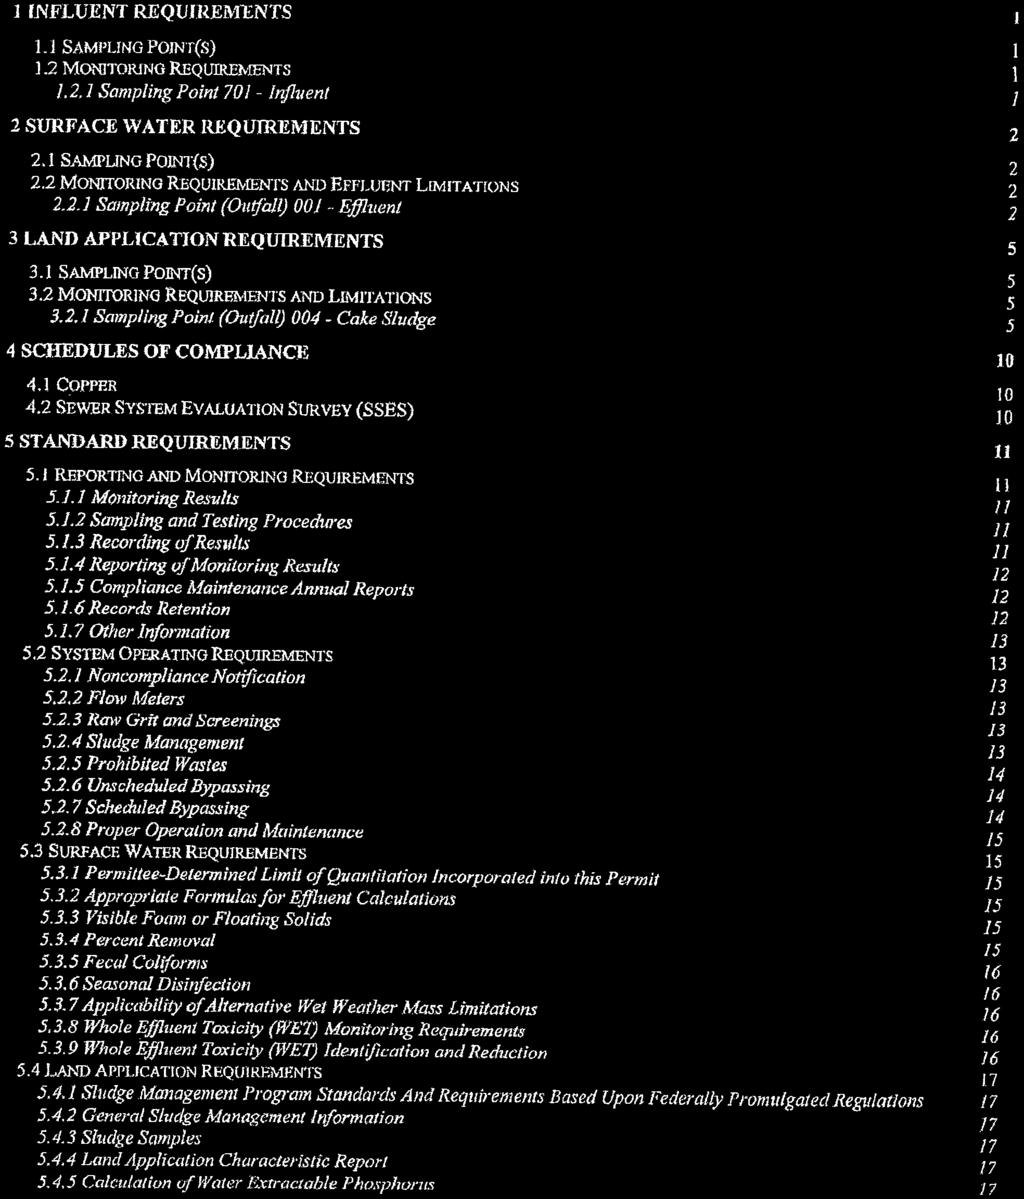
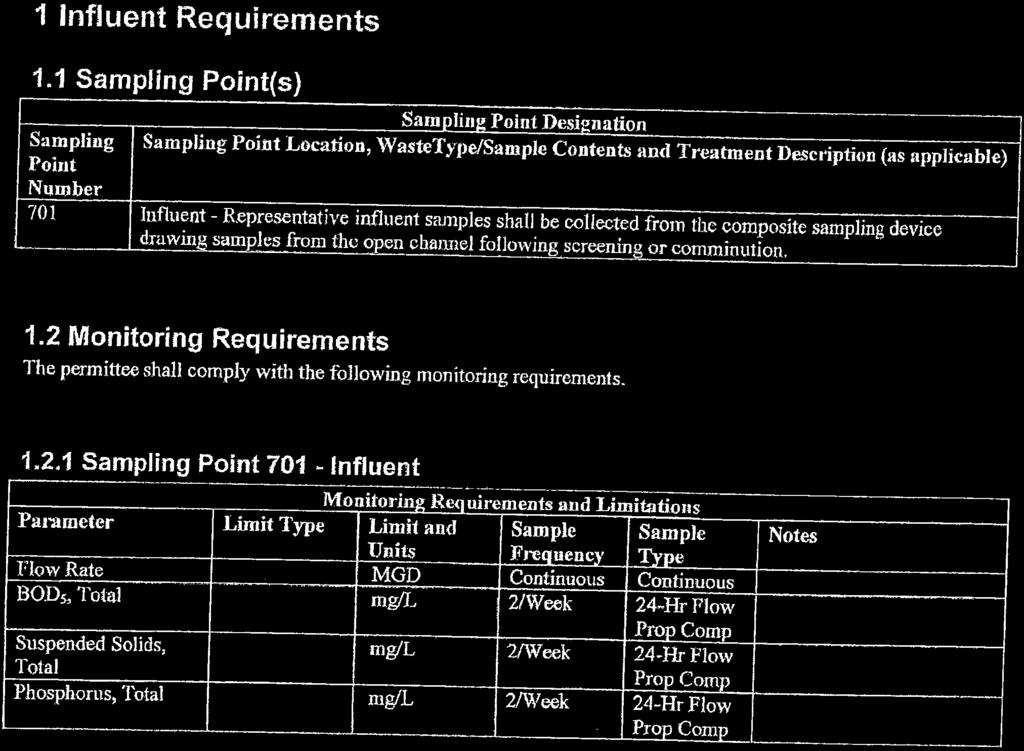
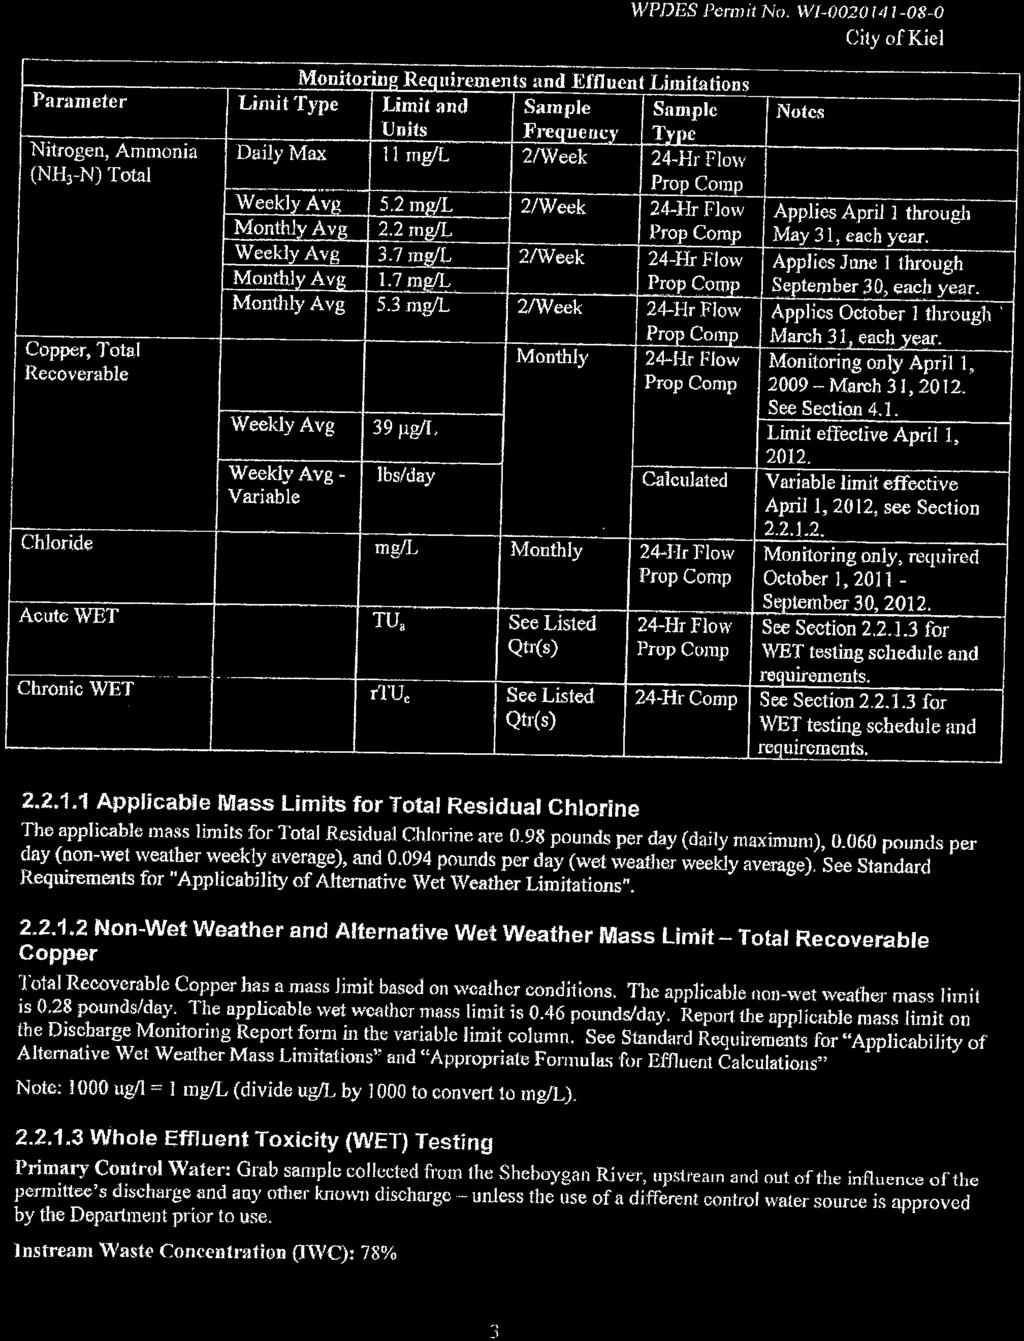
27 APPENDIX II 1 WISCONSIN POLLUTANT DISCHARGE ELIMINATION SYSTEM (WPDES) PERMIT No. WI

28
29

30

31

32

33
34
35
36

37
38

39


40
41

42

43


44
45
46
47
48
49

50

51
52 APPENDIX II 2 WISCONSIN DEPARTMENT OF NATURAL RESOURCES (DNR) MEMORANDUM Quality Based Effluent Limitations (WQBEL) / September 30, 2013
53 CORRESPONDENCE / MEMORANDUM State of Wisconsin DATE: September 30, 2013 FILE REF: 3200 TO: FROM: SUBJECT: Dick Sachs East District / Green Bay Jim Schmidt WQ/3 Water Quality-Based Effluent Limitations for the Kiel Wastewater Treatment Facility (WPDES Permit # WI ) This is in response to your request for an evaluation of water quality-based effluent limitations using chs. NR 102, 105, 106, 207, and 217 of the Wisconsin Administrative Code (where applicable), for Kiel's discharge to the Sheboygan River in Manitowoc County. This facility is located in the Sheboygan River Watershed (SH03) of the Sheboygan River basin. The evaluation of the permit recommendations is discussed in more detail in the attached report. The attached evaluation was developed in consideration of new monthly low flows (7Q10 and 7Q2) which were estimated by USGS. Since those flows would allow increased discharges for some parameters above the limits included in Kiel s current WPDES permit, antidegradation must be considered. The following recommendations are made for parameters that do not need an antidegradation evaluation because either the limits are equal to or more stringent than limits in the current permit, do not involve lowering of water quality, or are the initial imposition of limits which are exempt from antidegradation review: Substance Effluent Limitations ph s.u. daily range (1) Dissolved Oxygen: July September 7.0 mg/l daily minimum October March 6.0 mg/l daily minimum May June 6.0 mg/l daily minimum Fecal Coliforms 400 counts / 100 ml monthly geometric mean, May September (1) Total Residual Chlorine 38 ug/l daily maximum, 8.4 ug/l weekly average (1) Total Phosphorus: Water Quality-based 0.72 lbs/day annual average, 0.1 mg/l six-month average (May October, November April), 0.3 mg/l monthly average (3) Interim 1.0 mg/l monthly average (2) Chlorides 460 mg/l and 3,300 lbs/day weekly average (1)(5) Temperature (3): September 75 o F weekly average October 64 o F weekly average November 52 o F weekly average December 53 o F weekly average January 53 o F weekly average February 55 o F weekly average March 57 o F weekly average April 60 o F weekly average (continued on next page)
54 Ammonia: Year-round 6.7 mg/l daily maximum (6) April 2.2 mg/l monthly average (4) May 5.2 mg/l weekly average, 2.2 mg/l monthly average (4) June September 3.7 mg/l weekly average, 1.7 mg/l monthly average (4) October 9.4 mg/l weekly average (3), 5.3 mg/l monthly average (4) November 13 mg/l weekly average (3), 5.3 mg/l monthly average (4) December 12 mg/l weekly average (3), 5.3 mg/l monthly average (4) January - February 15 mg/l weekly average (3), 5.3 mg/l monthly average (4) March 19 mg/l weekly average (3), 5.3 mg/l monthly average (4) Footnotes: (1) No change to existing permit limits because the applicable water quality standards do not change. (2) Recommended limits are equal to or more stringent than those in the current permit. (3) Initial imposition of limits, exempt from antidegradation under s. NR (6)(b). (4) No change from existing permit limits because the need for increased limits cannot be shown under ss. NR (1)(a) and (2)(a). (5) If Kiel wishes to pursue a chloride variance, the recommended interim limit would be 630 mg/l weekly average, which is 105% of the highest reported weekly concentration. (6) - A variable daily maximum ammonia limit table based on effluent ph is available to Kiel if desired, to replace the new year-round limit of 6.7 mg/l. These alternative daily maximum limits are not subject to antidegradation because weekly and monthly average limits are not changing (also see (4)). Daily Maximum Ammonia Nitrogen (NH 3 -N) Limits Effluent ph - s.u. NH 3 -N Limit mg/l Effluent ph - s.u. NH 3 -N Limit mg/l ph 7.5 No Limit 8.2 < ph < ph * 8.3 < ph < ph * 8.4 < ph < ph * 8.5 < ph < ph * 8.6 < ph < ph < ph < ph < ph < ph < ph * During the months of May through October if the ph is less than or equal to 7.9 there is no daily maximum limit for NH 3 -N for municipal WWTF s treating primarily domestic wastewater. Limits shown in the table above with an asterisk* apply from November through April only. As noted earlier, some parameters have increased effluent limits available compared to those in the existing WPDES permit. Increased limits are available for the following parameters and averaging periods based on a showing of need under s. NR (1)(a) using data reported during the current permit term: BOD5 = Weekly average limits for every month of the year Total Suspended Solids = Weekly average limits for every month of the year Ammonia = Weekly average limit in April As such, several alternative sets of limits are available in terms of recommended limits based on options available to the permittee. These alternatives are available because the antidegradation rule (ch. NR 207) requires certain steps or evaluations to be done by the permittee before increased effluent limitations can be determined by the Department. When the need for increased limitations has been demonstrated, the
55 permittee is required to perform an evaluation of whether or not the increased discharge will accommodate important social or economic development, pursuant to s. NR (1)(c)1. If the demonstration is not made, or if it is made and there is a showing that the increased discharge would not accommodate important social or economic development, no change from the current permit limits would be allowed under s. NR (2): Limits based on inability to show accommodation of important social or economic development: Substance Effluent Limitations BOD5: May - October 10 mg/l and 72 lbs/day weekly average, 10 mg/l monthly average November - April 15 mg/l and 108 lbs/day weekly average, 15 mg/l monthly average Total Suspended Solids: May - October 10 mg/l weekly average, 10 mg/l monthly average November - April 15 mg/l weekly average, 15 mg/l monthly average Ammonia (in addition to limits shown earlier in this cover document): April 5.2 mg/l weekly average If Kiel as able to show that the increased discharge would accommodate important social or economic development, effluent limits would be recommended based on the prevention of significant lowering of water quality, as defined in s. NR If the increased discharge exceeds the levels which represent significant lowering of water quality, Kiel has the opportunity to demonstrate whether there are costeffective alternatives available under s. NR (1)(d) which prevent the significant lowering of water quality. Based on this evaluation, two additional alternative sets of effluent limits are available. Limits based on prevention of significant lowering of water quality, applicable if either the discharge is below these levels or if the significant lowering of water quality can be prevented in a cost-effective manner: Substance Effluent Limitations Ammonia (in addition to limits shown earlier in this cover document): April 9.0 mg/l weekly average BOD5 & Total Suspended Solids (TSS): Month: BOD5 TSS Month: BOD5 TSS January 16 mg/l and 117 lbs/day weekly average 19 mg/l weekly average July 10 mg/l, and 75 lbs/day weekly average February 16 mg/l and 116 lbs/day weekly average March 20 mg/l and 142 lbs/day weekly average April 30 mg/l monthly ave., 36 mg/l and 117 lbs/day weekly average May 14 mg/l and 102 lbs/day weekly average 18 mg/l weekly average 29 mg/l weekly average 30 mg/l monthly average, 45 mg/l weekly average 23 mg/l weekly average August 10 mg/l and 72 lbs/day weekly average September 11 mg/l and 76 lbs/day weekly average October 11 mg/l, and 76 lbs/day weekly average November 17 mg/l and 120 lbs/day weekly average 11 mg/l weekly average 10 mg/l weekly average 12 mg/l weekly average 12 mg/l weekly average 20 mg/l weekly average June 11 mg/l and mg/l weekly December 17 mg/l and mg/l weekly
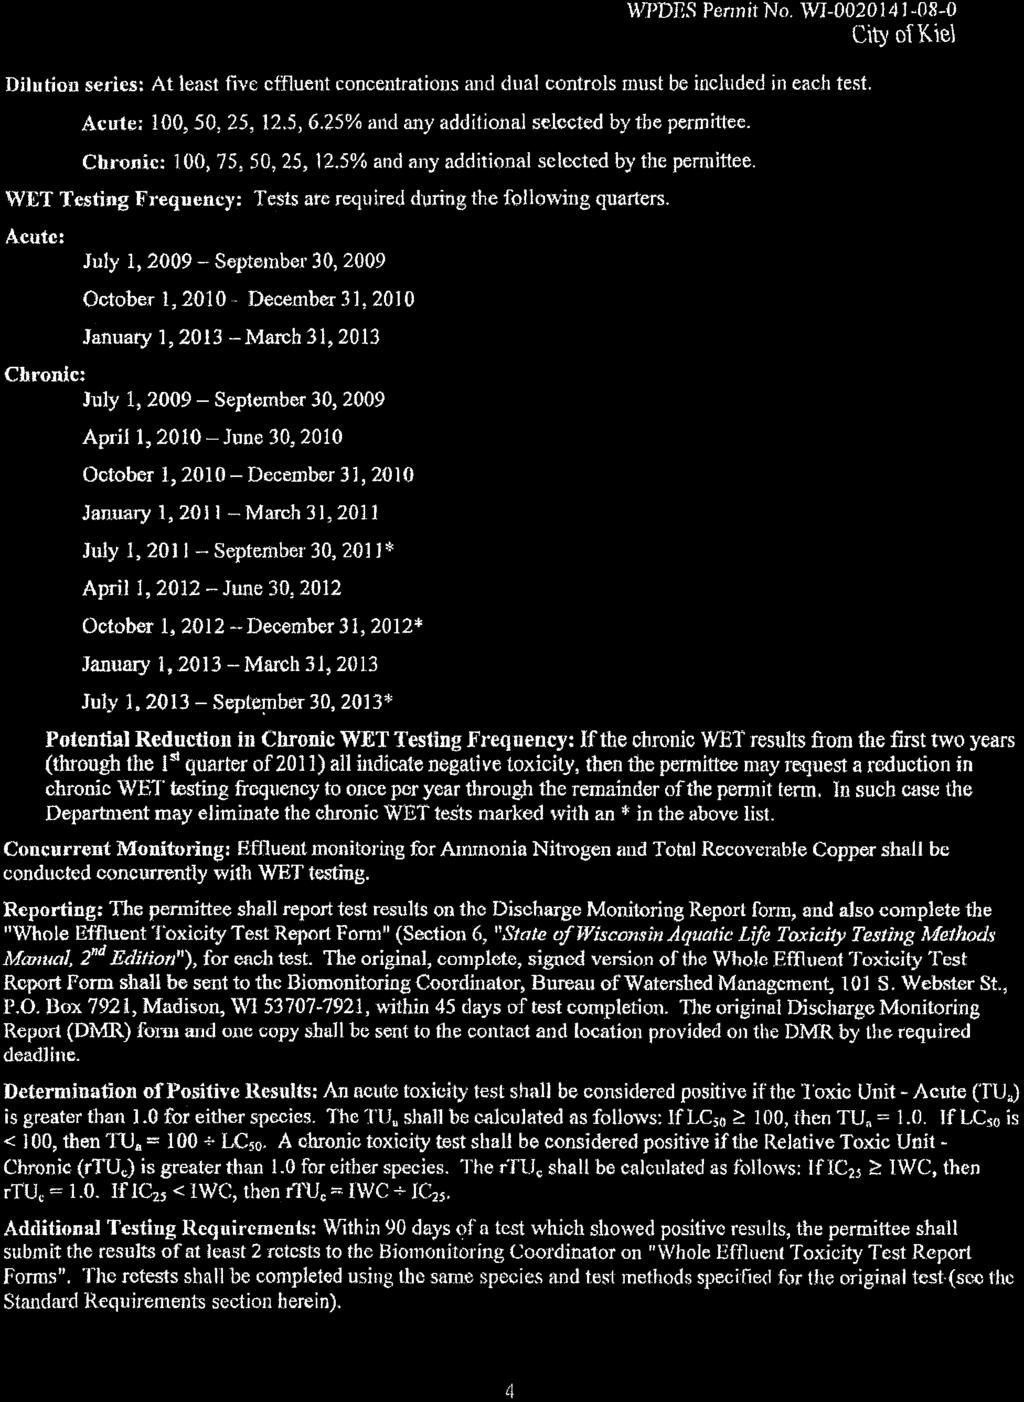
56 lbs/day weekly ave. average lbs/day weekly ave. average Limits based on full assimilative capacity of receiving water, applicable if the discharge exceeds levels which represent significant lowering of water quality and the significant lowering of water quality cannot be prevented in a cost-effective manner under s. NR (1)(d): Substance Effluent Limitations Ammonia (in addition to limits shown earlier in this cover document): April 17 mg/l weekly average BOD5 & Total Suspended Solids (TSS): Month: BOD5 TSS Month: BOD5 TSS January 19 mg/l and 134 lbs/day weekly average 19 mg/l weekly average July 11 mg/l and 82 lbs/day weekly average February 18 mg/l, and132 lbs/day weekly average March 29 mg/l and 210 lbs/day weekly average April 30 mg/l monthly average, 45 mg/l weekly average May 23 mg/l, and 163 lbs/day weekly average June 12 mg/l and 85 lbs/day weekly average 18 mg/l weekly average 29 mg/l weekly average 30 mg/l monthly average, 45 mg/l weekly average 23 mg/l weekly average 12 mg/l weekly average August 10 mg/l, and73 lbs/day weekly average September 12 mg/l and 84 lbs/day weekly average October 12 mg/l and 85 lbs/day weekly average November 20 mg/l and 143 lbs/day weekly average December 20 mg/l and 140 lbs/day weekly average 11 mg/l weekly average 10 mg/l weekly average 12 mg/l weekly average 12 mg/l weekly average 20 mg/l weekly average 20 mg/l weekly average NOTE: Since there are no water quality standards available for total suspended solids, there is no level at which significant lowering of water quality can be defined under NR 207. As a result, the total suspended solids limits in the previous two tables are the same, since the need for increased limits was able to be demonstrated. Along with the chemical-specific recommendations mentioned above, acute and chronic whole effluent toxicity testing is recommended for this permittee. Accordingly, following the guidance provided in the most recent version of the Department's Whole Effluent Toxicity Program Guidance Document, three acute whole effluent toxicity test batteries are recommended during the permit term, and twice per year chronic whole effluent toxicity test batteries are also recommended. Please consult the attached report regarding relevant monitoring conditions that relate to this discharge. If there are any questions or comments, please contact Jim Schmidt at (608) or via at jamesw.schmidt@wisconsin.gov. Attachment cc: David Gerdman Water District East / Green Bay
57 Water Quality-Based Effluent Limitations for Kiel WWTF WPDES Permit # WI Prepared by: Jim Schmidt - WQ/3 Existing Permit Limitations (WPDES Permit # WI , effective April 1, 2009 and expiring September 30, 2013): Outfall Activated sludge system (extended aeration) followed by clarification, phosphorus removal by chemical precipitation, tertiary filtration and disinfection with chlorine gas followed by dechlorination with sulfur dioxide gas. Substance Effluent Limitations BOD5: May - October 10 mg/l and 72 lbs/day weekly average, 10 mg/l monthly average November - April 15 mg/l and 108 lbs/day weekly average, 15 mg/l monthly average Total Suspended Solids: May - October 10 mg/l weekly average, 10 mg/l monthly average November - April 15 mg/l weekly average, 15 mg/l monthly average ph s.u. daily range Dissolved Oxygen 6.0 mg/l daily minimum Fecal Coliforms 400 counts / 100 ml monthly geometric mean, May September Total Residual Chlorine 38 ug/l daily maximum, 8.4 ug/l weekly average Total Phosphorus Total Recoverable Copper Ammonia: Year-round April May June September October March 1.0 mg/l monthly average 39 ug/l and 0.28 lbs/day weekly average, 0.46 lbs/day wet weather weekly average 11 mg/l daily maximum 5.2 mg/l weekly average, 2.2 mg/l monthly average 3.7 mg/l weekly average, 1.7 mg/l monthly average 5.3 mg/l monthly average Since monthly low flows are now available for the receiving water, all of the above limits are being reevaluated in this report along with anything else tested and detected in Kiel s effluent. Information for Permit Reissuance Evaluation: Receiving Water Information Name: Sheboygan River (WBIC = 50700) Classification: Warmwater sport fish community, not used as a public water supply NOTES: (1) For bioaccumulative chemicals of concern (BCCs), criteria are based on a classification as a coldwater community and public water supply since this permittee is located in the Great Lakes basin. However, no BCCs were detected in the discharge. (2) Sheboygan River is listed as an Impaired Water for PCBs over the first 33.9 miles upstream of its mouth. At this time, this designation does not affect Kiel since Kiel is not required to test PCBs in its effluent. Year-round flows (updated by USGS in August of 2008): 7Q10 = 0.93 cfs 7Q2 = 2.1 cfs 30Q5 or 90Q10 = 1.6 cfs Estimated Harmonic Mean Flow = 11.4 cfs % of Flow used to calculate limits = 25 (default)
58 Monthly low flows: Month 30Q5 (cfs) 7Q2 (cfs) 7Q10 (cfs) Month 30Q5 (cfs) 7Q2 (cfs) 7Q10 (cfs) January July February August March September April October May November June December Monthly 4Q3 flows are also available, but are not listed here because those flows are not used for limit calculations due to the fact they do not represent biologically-based design low flows. Source of background concentration data = Sheboygan River near Sheboygan for everything except chlorides and hardness. Chloride data came from the Mullet River above Plymouth and hardness data came from ambient water samples in Kiel s whole effluent tests. Although the Sheboygan River site is downstream of Kiel, dilution and results (compared to other locations) suggest Kiel has little impact on downstream metals levels. Background results used in limit calculations: Substance Result Substance Result Chloride 22.0 mg/l Hardness 288 PPM Cadmium ug/l Chromium ug/l Copper 2.46 ug/l Lead ug/l Nickel 2.94 ug/l Zinc 3 ug/l Effluent Information Actual Flow (4/1/2009 9/30/2013): Peak daily = MGD (4/10/2013) Peak 7-day average = MGD (4/8 4/14/2013) Peak 30-day average = MGD (3/31 4/29/2013) Peak 365-day average = MGD (latest = 6/12/2010 6/11/2011) Design Flow: Annual average = MGD (from permit reissuance application) For the peak daily, weekly, and monthly flows, the peak actual flows are used because the peak actual 365-day flow exceeded the annual average design flow. Only the peak annual average is used to calculate water quality-based concentration limits, while the other peak flows are used to calculate mass limits. NOTE: The high flows, in particular the reported flows, may warrant Kiel being treated as a major municipality for the next permit reissuance and warranting testing of the entire EPA priority pollutant list. Acute dilution factor used = Not applicable Effluent concentration data) Substances tested: During permit term = Ammonia, chloride, copper, phosphorus, residual chlorine, hardness (during WET tests) As part of permit reissuance application = Arsenic, cadmium, chromium, lead, nickel, zinc, hardness Results: Single test results are available for arsenic, cadmium, lead, chromium, nickel and zinc. Of those, only the last three were detected, so those results are summarized below alongside the calculated limits. For the remaining substances, multiple test results are available and summarized here.
59 Hardness) Daily average results from effluent WET tests in current permit term: 9/15/ PPM 5/18/ PPM 3/15/ PPM 4/10/ PPM 3/19/ PPM From permit application: 1/13/ PPM 1/16/ PPM 1/20/ PPM 1/28/ PPM Mean of all results 365 PPM Chloride) Date Chloride (mg/l) Date Chloride (mg/l) Date Chloride (mg/l) 10/19/ /1/ /5/ /17/ /13/ /17/ /1/ /25/ /1/ /4/ /8/ /4/ Statistics} Mean = 415 mg/l 1-day P99 = mg/l 4-day P99 = mg/l 30-day P99 = mg/l Because of the large number of results available for ammonia, phosphorus, copper and chlorine, only the statistics are presented here. Phosphorus Ammonia Copper Chlorine # of Results # of Detects Mean mg/l mg/l ug/l 0 Maximum mg/l (4/20/2011) mg/l (12/28/2010) 27 ug/l (4/13/2011) 1-day P mg/l 2.65 mg/l ug/l 4-day P mg/l 1.73 mg/l ug/l 30-day P mg/l 0.72 mg/l ug/l 0 (all results were less than 100 ug/l) P99 values are the 99 th upper percentile values calculated using the procedure in s. NR (5) when 11 or more detected results are available. Mean results are calculated using zeroes in place of non-detected results, the reason why the mean chlorine concentration is zero. NOTE: Because some of the copper values were excluded due to high levels of detection, the copper data are summarized in this report. That information is on the following page.
60 Effluent Copper Data reported since 3/10/2011, results in ug/l Date Cu result Date Cu result 03/10/ /05/ /13/ /17/ /02/ /01/ /02/ /04/ /07/ /09/ /04/ /15/ /12/ /03/ /10/ /02/ /01/ /03/ /01/ /06/ /04/ /06/ /01/ # 05/21/ /01/ /12/ /17/ /01/ NOTES: < - Copper was not detected at the indicated level of detection. * - Data were actually available throughout the entire permit term back to April of However, as requested by the permittee, only the copper data reported on or after March 10, 2011 were considered here due to a change in laboratories which was in part due to issues with high levels of detection. # - Result was corrected from the submitted discharge monitoring reports, as documented within Kiel s April 1, 2013 Dissipative Cooling request submittal. Out of the 72 total results submitted between the effective date of the current permit and the end of June, 2013, 16 results were excluded. That left 56 accepted results, 45 of which were detected. Effluent Limit Summary Limits are calculated only for the substances detected in Kiel s effluent that have water quality criteria, as well as the chlorine limit since chlorine was limited in the current WPDES permit. Results are in units of ug/l unless noted otherwise. DAILY MAXIMUM LIMITS based on ACUTE TOXICITY CRITERIA Crit- Effl. 1/5 of Effluent Concentrations Substance erion Limit Limit Mean P99 Max. Chlorine Limited in current permit Chromium (total or +3) * Copper * Nickel * Zinc * Chlorides (mg/l) * - Criteria are calculated using an effluent hardness of 365 PPM except for nickel (268 PPM) and zinc (333 PPM) where the values represent the maximum endpoint of the range over which criteria are applied in Table 2A of ch. NR 105. NOTE: The NR 105 criteria are not considered to be seasonal in that they don t vary by ph or temperature, meaning parameters that vary by season. As a result, the chronic toxicity criteria-based limits are calculated using 25% of the year-round 7Q10 low flow of 0.93 cfs, rather than limits that vary from month to month based on monthly 7Q10 values. This won t be the case for the evaluation of other parameters such as BOD5, ammonia, and temperature.
61 WEEKLY AVERAGE LIMITS based on CHRONIC TOXICITY CRITERIA Crit- Effl. 1/5 of Effluent Concentrations Substance erion Limit Limit Mean P99 Chlorine Limited in current permit Chromium (total or +3) * Copper * Nickel * Zinc * Chlorides (mg/l) * - Criteria are calculated using a receiving water hardness of 288 PPM except for nickel (268 PPM) where the value represents the maximum endpoint of the range over which criteria are applied in Table 2A of ch. NR 105. MONTHLY AVERAGE LIMITS based on HUMAN THRESHOLD CRITERIA Crit- Effl. 1/5 of Effluent Concentrations Substance erion Limit Limit Mean P99 Chromium (total or +3) 3.82E E E Nickel 4.30E E E Limits were not calculated based on wildlife or human cancer criteria since none of the substances with those criteria were required to be tested in Kiel s effluent. Permit Recommendations: Chlorine) Since chlorine was limited in the current WPDES permit and Kiel adds sulfur dioxide for dechlorination purposes, chlorine limits must be included in the reissued permit. The daily maximum limit of 38 ug/l stays the same, but the weekly average limit increases slightly due to the new low flows estimated by USGS. The limit would increase from 8.4 ug/l to 8.6 ug/l (rounded from 8.55). However, since the previous limit was not exceeded during the permit term, Kiel is therefore unable to demonstrate the need for increased limits, no matter how slight the increase is. Pursuant to antidegradation rule language in s. NR (2), since the permittee has shown its ability to meet the 8.4 ug/l limit, that limit shall remain in the permit. Mass limits are no longer necessary for residual chlorine pursuant to s. NR (2). Chlorides) A weekly average limit is recommended because the 4-day P99 value of mg/l exceeds the effluent limit of mg/l. The calculated and recommended water quality-based limit is 460 mg/l (rounded) and 3,300 lbs/day (0.862 MGD at mg/l, rounded). Since Kiel does not have chloride limits in its current WPDES permit, Kiel may wish to pursue a variance to water quality standards under Subchapter VII of ch. NR 106. Under current guidance from 2010, the suggested variance (or interim) limit is equal to the greater of the 4-day P99 or 105% of the highest weekly average effluent concentration. At Kiel, the highest concentration was 600 mg/l in October of Since that exceeds the P99 of mg/l, the proposed variance limit would be 630 mg/l weekly average (600 mg/l X 1.05). It is noted that a fairly large chloride database is available from the previous permit term, covering 2003 through The overall chloride results from 2003 through 2012 are presented in a separate attachment to this report. Although more than 11 detected results are already available during the current permit term, it is possible to use this older information to either support or revise the permit recommendations. In fact, another 67 results are available over this period, so the following table summarizes the statistics from those 67 results when combined with the 12 results from 2011 to 2012, alongside the statistics for only the 12 results from which were presented earlier in this report:
62 Chloride all data Chloride ( ) # of Results # of Detects Mean mg/l 415 mg/l Maximum 600 mg/l (10/19/2011) 600 mg/l (10/19/2011) 1-day P mg/l mg/l 4-day P mg/l mg/l 30-day P mg/l mg/l It is noted that none of the results in the previous database exceeded the maximum value of 600 mg/l from From this table, it appears that the overall P99 values are much lower than that calculated from the data, and the 4-day P99 of mg/l from the overall database is now less than the calculated weekly average limit of mg/l. This suggests the chloride limits could be removed from the permit recommendations. However, the fact that the recent data has higher P99 values suggests a potential upward trend in Kiel s chloride results. The following graph was developed from the overall database. Although many of the results are below the 460 mg/l limit, there appears to be a trend towards higher values near the end of this period, covering the data although, as summarized earlier, theonly result that exceeds 460 mg/l was the peak result of 600 mg/l from October 19, Results since then have been below the limit, but several results are closer to the limit compared to the results from 2009 and earlier. With a fairly long break containing no results between March of 2009 and October of 2011 (as noted by the break in the graph, also see data in the attachment), it isn t clear whether these recent high values were part of a trend that extended over this 2-1/2 year break. Because there was only a single day exceedance of the weekly average limit in 2011 along with another single day exceedance back in 2003 (the first result of the database), these exceedances do not constitute the trigger of a weekly average permit limit under s. NR (3)(b). There aren t exceedances of a weekly average limits based on 4 consecutive days of data because chloride wasn t sampled on 4 consecutive days at any time during the database.
63 Because the 4-day P99 of the exceeds the 460 mg/l limit and because there s a long break within the database, the permit recommendation shall be based only on the most recent information under the asusmption that the pre-2009 data are not representative of current discharge conditions. Therefore, no change is made to the permit limits recommended above. As data are collected during the upcoming permit term, it may be appropriate to revise these recommendations again in the future especially if the upward trend is no longer apparent. EVALUATIONS OF OTHER PARAMETERS: Not only has the year-round 7Q10 and 7Q2 changed, but we now have monthly 7Q10 and 7Q2 estimates. Because of this, effluent limits for BOD5, TSS, and ammonia shall be re-evaluated in this report to determine if there are any significant changes from the current and previous permit terms. BOD5 and TSS: BOD5 limits have been in-place for several terms of Kiel s WPDES permit, calculated based on the annual average design flow of MGD and a 7Q10 of 0.80 cfs. TSS limits are typically set equal to the BOD5 limits based on the expected achievability of municipal sewage treatment plants. Although the effluent design flow has not changed, limits are re-calculated due to the availability of monthly 7Q10 flow estimates on the Sheboygan River as provided by USGS. Several exceedances of the current permit limits for both parameters during the current permit term warrants re-examining the limits at this time. The weekly average limit exceedances are summarized below (monthly average limit exceedances aren t summarized here because they would essentially be double-counting many of the weekly exceedances given that the concentration limits are the same): BOD5 Weekly average limit of 10 mg/l, May October = Three exceedances during May of 2010, maximum calculated weekly average was 93.0 mg/l over May 2 4. BOD5 Weekly average limit of 72 lbs/day, May October = Three exceedances during May of 2010, maximum calculated weekly average was 828 lbs/day over May 2 4. BOD5 Weekly average limit of 15 mg/l, November April = Six exceedances during March and April of 2010, two more during December of 2010, and two more during April of 2011, maximum calculated average was mg/l over March 28 30, BOD5 Weekly average limit of 108 lbs/day, November April = Six exceedances during March and April of 2010, two more during December of 2010, three more during April of 2011 and three more during April of 2013, maximum calculated average was 2,537 lbs/day over March 28 30, TSS Weekly average limit of 10 mg/l, May October = One exceedance during June of 2009, one during October of 2009, and two during May of 2010, maximum calculated weekly average was 136 mg/l over May 2 4, TSS Weekly average limit of 15 mg/l, November April = Five exceedances during March and April of 2010, three more over December 2010 and January 2011, and two more in April of 2011, highest calculated average = 470 mg/l over April 20 25, Although some of these exceedances are extreme, the results will be used as part of the antidegradation process if increased limits are calculated based on the new monthly stream low flows. As before, BOD5 limits are calculated based on a factor of 26 pounds per day of BOD5 discharged per cfs of total (effluent plus stream) flow in order to reduce instream DO levels by 2 mg/l and meet a DO criterion of 5 mg/l. This factor is adjustable based on the temperature of the receiving water as well as
64 the instream DO concentrations after mixing. Background temperatures for the Sheboygan River are taken from Table 2 of ch. NR 102, which provides new ambient levels for small warmwater streams as part of the new thermal standards that became effective in late Using the monthly ambient temperatures and the new 7Q10 flows, the following table summarizes the updated weekly average BOD5 limits for Kiel s discharge at an annual average design flow of MGD and the 6 mg/l daily minimum DO limit from the current WPDES permit. Jan. Feb. March April May June 7Q10 (cfs) BOD5 Limit: mg/l > lbs/day No limit July Aug. Sept. Oct. Nov. Dec. 7Q10 (cfs) BOD5 Limit: mg/l 11 * 10 * 12 * lbs/day * - Daily minimum DO limit would be raised from 6 mg/l to 7 mg/l because mix DO conditions based on 6 mg/l effluent would result in a BOD5 limit below 10 mg/l that would be representative of an effluent-dominated situation that normally warrants a 7 mg/l DO limit. The current permit limits are 10 mg/l and 72 lbs/day in May October, with 15 mg/l and 108 lbs/day in November April. Basically, this means the limits increase in every month of the year for both concentration and mass except for August, where the 1 lb/day mass difference is basically no change after rounding. Because of the high BOD5 concentration and mass values reported during the current permit term and the fact those high values have occurred during all seasons, the need for increased discharge limits would be justified under s. NR (1)(a). However, the difficult part comes in the next demonstration, which is the social/economic justification for an increased discharge under s. NR (1)(c)1. In that part of the code, if the increased discharge limits result in any lowering of water quality, the permittee would be required to demonstrate that the proposed increased discharge that is allowed with the new flows would accommodate important social or economic development in any of seven available factors (subd. 1.a. through g.) Several of those factors are industry-related and would not apply to a municipal discharge such as Kiel (increased employment, increased production, avoiding a reduction in employment, or increased efficiency). The other three would relate to municipal as well as industrial discharges, namely s. NR (1)(c)1.e. through g, these are the demonstrations which a municipal discharge would be expected to make, any of which would satisfy the social/economic requirement of the code: e. There will be industrial, commercial, or residential growth in the community. f. The discharger will be providing economic or social benefit to the community, or g. The discharger will be correcting an environmental or public health problem. Although BOD5 levels have exceeded current permit limits on several occasions during the term of the permit, there is no proposed change to the design discharge rate. Kiel would need to satisfy any of the conditions in subds. 1.e. through g. in order to qualify for the increased limits. The information is not currently available to satisfy any of those three situations since the proposed increase in limits is due to stream conditions rather than anything originating from the discharger. Under ss. NR (2)(b)2 or 3, discharges that are unable to demonstrate the social/economic need for an increased discharges would have limits set equal to the existing levels of the affected substances adjacent to the discharge site, meaning no change in the limits.
65 In a situation like this, the typical Department response is to note the issue regarding the social/economic demonstration in the formal limit recommendations, but also to indicate what the limits would be if a social/economic demonstration could be made. If Kiel was able to show that an increased discharge of BOD5 would satisfy any of the three issues listed above, the Department response would be to provide limits to cover either of two situations under ch. NR 207. That response involves the determination of the levels associated with the significant lowering of water quality (or SLOWQ) as defined in s. NR SLOWQ represents the level (concentration or mass) that would essentially use up one-third of the available assimilative capacity associated with the increased streamflows. In other words, SLOWQ represents one-third of the difference between the current permit limits and the limits based on the new monthly low flows. If a permittee s increased discharge exceeds the level associated with SLOWQ, under s. NR (1)(d) the permittee would have to demonstrate whether or not SLOWQ could be prevented in a cost-effective manner by the use of pollution control alternatives such as conservation measures, recycling measures, other applicable process or operational changes, source reduction, or other pollution minimization alternatives. With these available options, an increased limit scenario such as that which is available for BOD5 would be addressed by the Department providing the limits based on SLOWQ as well as those based on full assimilative capacity. If the proposed increase in discharge does not exceed SLOWQ, or if SLOWQ could be prevented in a cost-effective manner under s. NR (1)(d), then the SLOWQ limits would apply. If the proposed discharge exceeded SLOWQ and the exceedance could not be prevented in a cost-effective manner under s. NR (1)(d), then the full assimilative capacity-based limits would apply. The full assimilative capacity-based limits are those listed in the previous table (19 mg/l and 134 lbs/day for January, etc.). NOTE: For August, there is essentially no increase in limits so August is exempt from these demonstrations; the SLOWQ limit rounds off to be equal to the current permit limit. For April, the new BOD5 limit is not water quality-based because the 45 mg/l weekly average is based on ch. NR 210, so SLOWQ for April is based on the difference between the existing limit of 10 mg/l and the actual calculated water quality-based limit, with that result also being compared to the NR 210 limit. Based on the above discussions, the recommended limits for BOD5 (after rounding) are as follows, only if the social/economic justification in s. NR (1)(b) can be made by Kiel: Weekly average BOD5 limits based on prevention of SLOWQ pursuant to s. NR ) Jan. Feb. March April May June mg/l # lbs/day July Aug. Sept. Oct. Nov. Dec. mg/l lbs/day
66 Weekly average BOD5 limits based on full assimilative capacity) Jan. Feb. March April May June mg/l # lbs/day No limit July Aug. Sept. Oct. Nov. Dec. mg/l lbs/day # - Since the weekly average limit exceeds 30 mg/l, a monthly average limit of 30 mg/l would also apply during the indicated month pursuant to s. NR (1)(b). No mass limit is associated with the monthly average limit, and the monthly average limit is not subject to NR 207 since the initial imposition of a monthly average BOD5 limit is exempt from antidegradation under s. NR (6)(b). Dissolved oxygen limits would be 7.0 mg/l daily minimum in July September when the receiving water is effluent-dominated, 6.0 mg/l in October March and May - June, and no limit would apply during April. It is noted that the only months in which there appears to be a significant difference between SLOWQ and full assimilative capacity limits are March through May. During the other months, the mass and concentration limits are fairly close to each other, so March through May would be the suggested months of focus in a cost-effective SLOWQ prevention evaluation. For TSS, the process is noticeably simpler. Although as noted earlier, TSS limits are normally set equal to BOD5, the SLOWQ determination doesn t really apply because there are no water quality criteria for TSS. As a result, Kiel would still have to make the determination of need for increased limits, and that has been satisfied with the finding of multiple exceedances of the current permit limits. The social/economic demonstration and therefore the SLOWQ determination would not apply because with no criteria, there cannot be a showing or even an assumption that increased TSS levels represent a lowering of water quality. It may be true that increased TSS lowers water quality, but without a benchmark representing a standard or criterion, the degree of lowering cannot be assessed under the existing rules. Therefore, Kiel would get TSS limits equal to the full assimilative capacity-based BOD5 limits. Because there are no water quality standards for TSS, TSS limits are expressed only as concentrations. Weekly average TSS limits) Jan. Feb. March April May June mg/l # July Aug. Sept. Oct. Nov. Dec. mg/l # - Since the weekly average limit exceeds 30 mg/l in April, a monthly average limit of 30 mg/l would also apply during April pursuant to s. NR (1)(b). Phosphorus Technology Based: Wisconsin Administrative Code, ch. NR 217, requires municipal wastewater dischargers that discharge greater than 150 pounds of Total Phosphorus per month to comply with a Monthly Average limit of 1.0 mg/l or an approved Alternative Concentration limit unless a more restrictive WQBEL is applicable. The current permit for Kiel contains a technology-based phosphorus limit of 1.0 mg/l monthly average. The effluent flow and concentration data reported during the previous permit term are summarized in the table on the following page.
67 Calendar Year Mean Annual Effluent Flow (MGD) Annual Average P Concentration (mg/l) Estimated Annual Total P Loading (lbs/year) Since the previous permit contained the 1.0 mg/l technology-based limit, it is recommended that this limit be retained in the reissued permit pending the evaluation of water quality-based limits. It is also noted that Kiel s discharge exceeded 150 pounds per month or 1,800 pounds per year twice in the last four years anyway, another reason the 1.0 mg/l limit is still applicable. Phosphorus Water Quality Based: Revisions to the administrative rules for phosphorus discharges took effect on December 1, These revisions require an evaluation of the need for water quality based effluent limits. For the Sheboygan River, the new rules specify a water quality criterion (WQC) for phosphorus of 100 ug/l pursuant to s. NR (3)(a)38, Wis. Adm. Code, since the Kiel outfall is downstream of the Sheboygan Marsh outlet. Ambient stream data are available from the Sheboygan River in Fond du Lac County, upstream of Kiel. Ten results were available over the period of May 20, 2002 through July 11, 2012 with all ten values being collected during the months of May through October. This potentially qualifies all ten results for calculation of background concentrations under s. NR (2)(d) since only three of the results were collected during the last four years. Of the ten results, seven of them exceed 0.1 mg/l with an eight result exactly equal to mg/l, meaning the median calculated under NR (2)(d) will also exceed 0.1 mg/l. In fact, the criterion in Fond du Lac County is only mg/l since the data collection sites are above Sheboygan Marsh, so the median will exceed that criterion as well. Based on the high ambient concentrations, the recommended phosphorus limits for Kiel are 0.1 mg/l as a six-month average (May October and November April) and three times that, or 0.3 mg/l, as a monthly average limit. A mass limit of 0.72 lbs/day annual average is also recommended based on the 0.1 mg/l concentration limit and the MGD annual average design flow. However, it is noted that the ambient concentrations could be affected one way or the other by the presence of Sheboygan Marsh, so it may be prudent (but not required) for Kiel to collect ambient phosphorus data during May October as part of its future compliance schedule activities. This could also be added to future Department ambient monitoring plans. Compliance with an effluent phosphorus concentration limit as stringent as 100 ug/l may not be technically or economically feasible; but the new rules allow alternatives for achieving comparable reductions in phosphorus loading. Options for the company to consider may include requesting an alternate phosphorus limitation (APL) with compliance schedule, pollutant trading with other phosphorus discharges (point and/or nonpoint sources) that may be controlled more effectively, stream monitoring above and below the outfall to document actual instream changes related to the effluent discharge, and development of an adaptive management strategy that combine a broader range of efforts to reduce phosphorus loading. According to the PRESTO Estimation Tool, Kiel is likely to be eligible for the Adaptive Management option presented in s. NR , Wis. Adm. Code, since the point source loading from the permittee is far less than 50% of the estimated phosphorus load contribution in the watershed due to its location far from the headwaters of the Sheboygan River. During the phosphorus compliance schedule period, the current 1.0 mg/l monthly average limit shall serve as an Interim Limit.
68 Ammonia: The State of Wisconsin promulgated revised water quality standards for this substance during the term of the current permit. Those revisions became effective March 1, 2004, and include criteria based on both acute and chronic toxicity to aquatic life. The current WPDES permit for Kiel contains a daily maximum limit of 11 mg/l based on effluent ph data evaluated in 2008, so the typical approach taken would be to evaluate current effluent ph data to determine if the limit changes. The current permit also contains seasonal weekly average and monthly average limits calculated based on default background conditions (ph, temperature, ammonia) as well as the old year-round 7Q10 estimate of 0.80 cfs. At this time, the background values have changed based on new default data, but the more important change relates to the fact that not only has the year-round 7Q10 increased from 0.80 to 0.93 cfs, but monthly 7Q10 (and 7Q2) estimates have now been generated by USGS which may provide additional relief from the existing permit limits. Therefore, all of the current permit limits for ammonia shall be reevaluated. Where increased limits are available, antidegradation provisions of ch. NR 207 shall be incorporated as well. Daily Maximum Limits based on Acute Toxicity Criteria (ATC): Daily maximum limitations are based on acute toxicity criteria, which are a function of the effluent ph and the receiving water classification. A 99 th upper percentile ph value of 8.2 s.u. was used to establish the current daily maximum permit limit of 11 mg/l. During the current permit term, a total of 1,552 sample results were reported from April 1, 2009 through June 30, Generally the department has only grab sampling data and the ATC is based upon a maximum reasonably expected ph. However, the Kiel WWTF is equipped with continuous ph monitoring, and the daily maximum and daily minimum are reported on the monthly Discharge Monitoring Reports. The highest reported daily maximum ph value was 9.29 s.u. on January 31, More importantly, the new 99 th upper percentile value, as represented by the 16 th highest result out of a database of 1,552 values, was estimated at 8.48 s.u., which is significantly above the 8.2 s.u. value used in This results in a lower daily maximum ph limit. At ph 8.48, the acute toxicity criterion for ammonia in warmwater sportfish streams is 3.33 mg/l, resulting in a daily maximum limit of 6.7 mg/l after rounding. However, it is also noted that over this period, the daily maximum ph has ranged from the abovementioned high of 9.29 down to a reported value of 7.1 s.u. on March 25, For that reason, an alternative is available which would provide a table of daily maximum ph limits based on a range of daily maximum ph values. This alternative may be included in the permit in place of the 6.7 mg/l daily maximum limit. Daily Maximum Ammonia Nitrogen (NH 3 -N) Limits Effluent ph - s.u. NH 3 -N Limit mg/l Effluent ph - s.u. NH 3 -N Limit mg/l ph 7.5 No Limit 8.2 < ph < ph * 8.3 < ph < ph * 8.4 < ph < ph * 8.5 < ph < ph * 8.6 < ph < ph < ph < ph < ph < ph < ph * During the months of May through October if the ph is less than or equal to 7.9 there is no daily maximum limit for NH 3 -N for municipal WWTF s treating primarily domestic wastewater. Limits shown in the table above with an asterisk* apply from November through April only. Weekly Average & Monthly Average Limits based on Chronic Toxicity Criteria (CTC): Weekly
69 average and monthly average limits for Ammonia Nitrogen are based on chronic toxicity criteria, both of which are a function of background ph and temperature. Criteria updates are available based on updated ambient information. Ambient ph data have been updated for hardwater streams such as the Sheboygan River, while ambient temperature have been updated as part of the Department s development of thermal water quality standards (updated ambient values for small warmwater streams are now listed in Table 2 of ch. NR 102). The 4-Day criterion is simply equal to the 30-Day criterion multiplied by 2.5. The 4-day criteria are used in a mass-balance equation with the 7Q10 low flow to derive weekly average limitations. The 30-day criteria are used with the 30Q5 low flow to derive monthly average limitations. The stream flow value is further adjusted to temperature, with variable percentages of streamflow available for dilution based on seasonal temperature. The rules provide a mechanism for less stringent weekly average and monthly average effluent limitations when early life stages (ELS) of critical organisms are absent from the receiving water. This applies only when the water temperature is less than 14.5 ºC, during the winter and spring months. Burbot, an early spawning species, are not believed to be present in the Sheboygan River system. So ELS Absent criteria apply from October through March, and ELS Present criteria will apply from April through September. The following table summarizes the ambient values and criteria for each month of the year. Month: Jan. * Feb. * March * April May June Ambient Values: ph (s.u.) Ammonia (mg/l) Temp. ( o F) Temp. ( o C) < 7 < 7 < Updated Chronic Criteria: 4-d (mg/l) d (mg/l) Criteria Used to Calculate Current Permit Limits: 4-d (mg/l) d (mg/l) Month: July Aug. Sept. Oct. * Nov. * Dec.* Ambient Values: ph (s.u.) Ammonia (mg/l) Temp. ( o F) Temp. ( o C) < 7 < 7 Updated Chronic Criteria: 4-d (mg/l) d (mg/l) Criteria Used to Calculate Current Permit Limits: 4-d (mg/l) d (mg/l) * - ELS absent criteria applied
70 < 7 is listed for temperature because chronic ammonia criteria are constant below 7 o C. Ambient ammonia values are used to calculate limits, not criteria. Those values do not change from the previous effluent limit calculation in Source of information used to calculate current permit limits = May 5, 2008 effluent limits memo from Susan Sylvester (prepared by Jeff Haack) to Dick Sachs. It is noted that there are some limited ambient ph data available, but it s from late summer and from 1994 and earlier. The ambient ph data aren t used here because it s not certain whether this is representative of current conditions, so default data were used. Although there is an impoundment downstream of Kiel, the default data represent statewide information on ph values in non-impounded conditions. Default ambient ph results for impounded waters are a little bit higher than those for non-impounded waters, which in turn would result in slightly higher criteria and lower effluent limits because ammonia is more toxic in higher ph waters. However, in the Kiel situation it is felt that the lower ph values based on non-impounded waters is more representative of the situation in the river because the residence time in the impoundment below Kiel is less than the 14-day threshold used to define reservoirs for phosphorus criteria implementation purposes in s. NR (2)(f). For that reason, the lower default ambient ph values are used. The net effects of the updated default ph and temperature data are: 1. Increased or relaxed 4-day and 30-day chronic criteria in the months of January March and June September. 2. No change in criteria in the months of April May. 3. Decreased or tightened 4-day and 30-day chronic criteria in the months of October December. The following table lists the calculated limits based on the updated criteria and the new streamflows. Antidegradation shall be assessed based on the comparison of these limits with the limits in the existing WPDES permit. April May 5.2 mg/l weekly average, 2.2 mg/l monthly average June September 3.7 mg/l weekly average, 1.7 mg/l monthly average October March 5.3 mg/l monthly average Month: Jan. Feb. March April May June Current Permit Limits: Weekly Ave. (mg/l) No limit No limit No limit Monthly Ave. (mg/l) Revised Limits Based on Updated Criteria and New Streamflows: Weekly Ave. (mg/l) Monthly Ave. (mg/l) Month: July Aug. Sept. Oct. Nov. Dec. Current Permit Limits: Weekly Ave. (mg/l) No limit No limit No limit Monthly Ave. (mg/l) Revised Limits Based on Updated Criteria and New Streamflows: Weekly Ave. (mg/l) Monthly Ave. (mg/l)
71 Based on the above calculations, all of the revised limits based on updated monthly low flows exceed the corresponding limits in the existing permit, with the exception of the October monthly average limit which decreases from 5.3 to 4.55 mg/l. In addition the October March weekly average limits do not represent increases as defined in NR 207 because there were no corresponding weekly average limits for those months in the current permit. As a result, the only limits subject to the antidegradation provisions in NR 207 are the weekly average limits in April September and the monthly average limits in every month except October. The evaluation process is basically the same as that discussed earlier for BOD5. First, though, it is noted that some of these limits are more restrictive than the new daily maximum limit of 6.7 mg/l based on the effluent ph of 8.48 s.u. If only the single daily maximum limit is included in the reissued permit, only the monthly average limits less than 6.7 mg/l (meaning July December) would need to be included in the permit because in the other cases the daily maximum limit would be protective of chronic toxicity concerns as well as acute. If the variable daily maximum limit table is included in the permit, then all of the average limits should be included as well because of the ph conditions in which the daily maximum limit would be less restrictive and therefore may not be protective of chronic toxicity considerations. Since the option of the table is still available, antidegradation is assessed where applicable without consideration of the daily maximum limit(s) at this point. Returning to the antidegradation evaluation, the first evaluation is of the need for increased permit limits. Comparing past effluent test results to the current permit limits, it was determined that the only exceedance of weekly or monthly average limits in Kiel s current permit was the 5.2 mg/l weekly average limit during April, when the reported weekly average concentration of 5.48 mg/l on April 11 14, 2010 exceeded that 5.2 mg/l limit. In all the remaining months for both weekly and monthly limits where available, the existing discharge from Kiel was in compliance with the existing permit limits. This situation is definitely different than the BOD5 situation discussed earlier in this report because for ammonia, s. NR (2)(a) concludes that based on the treatment plant s ability to meet existing permit limits except for the weekly average April limit, no increases are allowed from the current permit limits. For the weekly average April limit, relaxed limits may be calculated under NR 207. As with BOD5, a limit may be calculated based on significant lowering of water quality (SLOWQ) in April. The SLOWQ limit for April represents 1/3 of the difference between the current weekly average limit of 5.2 mg/l and the new or revised weekly average limit of mg/l. The weekly average SLOWQ limit for April is 9.03 mg/l, or 9.0 mg/l after rounding. Since the April 2010 value of 5.48 mg/l is less than 9.0, the SLOWQ limit of 9.0 mg/l weekly average is recommended for the reissued permit for the month of April because the 4-day P99 in April is less than the SLOWQ limit, but that limit is also subject to the same social/economic justification mentioned earlier for BOD5 since the increased limit would represent lowering of water quality. Where antidegradation does not apply, the limits based on new criteria and streamflows are automatically recommended for the new permit. Those include the weekly average limits for October through March and the monthly average limit in October. Based on the above discussions, the recommended limits for ammonia are as follows (after rounding to two significant digits), with the new April weekly average limit of 9.0 mg/l being applicable only if the social/economic justification in s. NR (1)(b) can be made by Kiel. If the social/economic justification cannot be made, the April weekly average limit would revert to the existing limit of 5.2 mg/l.
72 Jan. Feb. March April May June Weekly ave Monthly ave July Aug. Sept. Oct. Nov. Dec. Weekly ave Monthly ave It is recommended that all of these limits be included in the permit if the ph vs. daily maximum limit table is also included in the permit. If the single daily maximum limit of 6.7 mg/l is included in the permit, the limits in the previous table that exceed 6.7 mg/l may be removed from the permit. Given the variability of effluent ph and ammonia values, the daily maximum limit table is recommended, but not required, for inclusion in the reissued permit for Kiel. Temperature) New surface water quality standards for temperature took effect on October 1, These new regulations are detailed in Chapter NR 102 (Subchapter II Water Quality Standards for Temperature) and NR 106 (Subchapter V Effluent Limitations for Temperature) of the Wisconsin Administrative Code. The following table is used to screen the need to calculate limitations for temperature: Warm Water and Limited Forage Fish designated Waters Cold Water Designated Waters Effluent Temperature Limitation Q s :Q e 20:1 Q s :Q e 30:1 120 o F (no calculation needed) 20:1 > Q s :Q e > 2:1 30:1 > Q s :Q e > 2.5:1 120 o F or the sub-lethal WQBEL (calculation needed), whichever is lower Q s :Q e 2:1 Q s :Q e 2.5:1 Sub-Lethal and Acute WQBELs (calculation needed) For unilateral (stream) flow Q s is determined by using 25% of the 7 Q 10. Q e is the design effluent flow. Determination of Q s :Q e for Kiel: 7Q 10 (cfs) Q s (25% of 7 Q 10 ) (cfs) Q e (0.862 MGD conv. to cfs) Q s :Q e Year-round : 1 Limits are calculated for each month of the year, using the effluent flows reported since April 1, The next two tables (on the following page) summarize the applicable criteria under the new thermal rules as well as the calculated limits based on those criteria. The limit calculation table (second table on the following page) summarizes the effluent flows used to calculate limits, the limits themselves, and the temperatures used to determine the need for permit limits. The Representative Highest Effluent Flow Rate values are the peak daily and 7-day average (Sunday through Saturday) flows calculated for each month of the year based on data submitted by the permittee over the period of June 14, 2011 through January 31, The Representative Highest Monthly Effluent Temperature values are the peak daily and 7-day average temperatures reported by Kiel over the same period. Where those representative temperatures exceed the calculated limits, the limits are bold-faced and have shaded backgrounds.
73 Warmwater Sport Fish Community Thermal Criteria for Sheboygan River (Table 2, ch. NR 102): Water Quality Criteria Mont h Ta (default) Sub- Lethal WQC Acute WQC Ta (default) Sub- Lethal WQC Acute WQC ( F) ( F) ( F) ( F) ( F) ( F) JAN JUL FEB AUG MAR SEP APR OCT MAY NOV JUN DEC Effluent Flow, Temperature, and Calculated Thermal Limits for Kiel: Representative Calculated Effluent Representative Highest Highest Monthly Limit Effluent Flow Rate (Qe) Effluent as per s. NR (7) Temperature Month 7-day Rolling Average (Qesl) Daily Maximum Flow Rate (Qea) f Weekly Averag e Daily Maximum Weekly Average Effluent Limitation Daily Maximum Effluent Limitation (mgd) (mgd) ( F) ( F) ( F) ( F) JAN FEB MAR APR MAY JUN JUL AUG SEP OCT NOV DEC Two sets of comments are appropriate based on the above data: First, some of the effluent results are highly questionable. Over three extended periods, the exact same daily maximum temperature to three decimal places was reported on every single day. December 14, 2011 May 29, 2012 = June 5, 2012 October 8, 2012 = November 2, 2012 November 28, 2012 = This seems like a very unusual occurrence to have it happen three times within a year for periods over 3 weeks at a time..
74 Second, Kiel submitted a Dissipative Cooling Request form on April 1, 2013, apparently in an attempt to avoid the need for sub-lethal effluent limits in its permit. This was done despite the fact that the limits were not known until this report was developed. Several of the items required in s. NR (4) for reporting with that request were either not provided to the Department or were insufficient to enable the Department to reach a conclusion regarding the applicability of the sub-lethal (or weekly average) limits. The following items are required under s. NR (4); after each item is the Department s response based on the April 1, 2013 submittal. s. NR (4)(a) Information needed to allow the Department to determine whether or not sub-lethal criteria are exceeded outside a small area of mixing and cooling: 1. A written description of the physical characteristics of the receiving water or outfall that encourage rapid dilution, diffusion, dispersion, or dissipation of heat. Response: The only documentation was a set of pictures taken from a dye study, almost five years earlier in There is no indication that this had any relationship to the temperature results reported in June 14, 2011 January 31, A written description of the presence or absence of other thermal loads to the receiving stream. Response: This was apparently satisfied by a statement of the absence of other thermal loads. 3. Minimum and maximum effluent temperatures for each calendar week for each permitted outfall over the past two years. Response: The above-mentioned thermal data submittal covered only about 18-1/2 months, from mid-january 2011 through January of During that period, there were questions raised above regarding three extended periods of data. s. NR (4)(b) Information the permittee has collected, generated, reviewed, or received regarding the following site-specific conditions: 1. Information regarding the biological quality of the animal and plant community of the receiving water including, but not limited to, species composition, richness, diversity, density, distribution, age structure, spawning incidence, and presence of any state or federally listed threatened or endangered species. Response: No documentation was submitted related to any of this. 2. Data concerning the physical characteristics of the receiving water or permitted outfalls that encourage rapid dilution, diffusion, dispersion, and/or dissipation of heat. Response: The existence of photos of a dye study was mentioned above in response to sub. (4)(a)1. No relevant data accompanied those photos. 3. Minimum and maximum temperature of the receiving water upstream of all permitted outfalls for each calendar month over the past two years. Response: No receiving water temperature data were provided. Based on the lack of sufficient information provided so far in response to the above items, the Department cannot reach any conclusions at this time regarding the existence of dissipative cooling. Based on the effluent temperature and flow data reported to the Department, weekly average permit limits are recommended for the months of September through April. Recommended Weekly Average Thermal Limits for Kiel: Month Weekly Average Limit ( o F) Month Weekly Average Limit ( o F) September 75 January 53 October 64 February 55 November 52 March 57 December 53 April 60
75 Whole Effluent Toxicity Evaluation: WET testing is used to measure, predict, and control the discharge of toxic materials that may be harmful to aquatic life. In WET tests, organisms are exposed to a series of effluent concentrations for a given time. Acute tests predict the concentration that causes lethality of aquatic organisms during a hour exposure. Chronic tests predict the concentration that interferes with the growth or reproduction of test organisms during a seven day exposure. Acute WET: In order to assure that the discharge from outfall 001 is not acutely toxic to organisms in the receiving water, WET tests must produce a statistically valid LC 50 greater than 100% effluent. Chronic WET: In order to assure that the discharge from outfall 001 is not chronically toxic to organisms in the receiving water, WET tests must produce a statistically valid IC 25 greater than the instream waste concentration (IWC). The IWC is an estimate of the proportion of effluent to total volume of water (receiving water + effluent). The IWC of 85% shown in the WET Checklist summary below was calculated according to the following equation: IWC (as %) = 100 X [Qe / ((1-f) Qe + Qs) Where: Qe = annual average design flow = MGD = 1.33 cfs f = fraction of the Q e withdrawn from the receiving water = 0 Q s = 1/4 of the 7-Q 10 = 0.93 cfs / 4 = cfs Dilution Series: According to the State of Wisconsin Aquatic Life Toxicity Testing Methods Manual (s. NR , Wis. Adm. Code), the default acute dilution series is: 6.25, 12.5, 25, 50, 100%, and the default chronic dilution series is 100, 75, 50, 25, 12.5%. Other dilution series may be chosen by the permittee or Department staff, but alternate dilution series must be specified in the WPDES permit. For guidance on selecting an alternate dilution series, see Chapter 2.11 of the WET Guidance Document. Receiving water: According to the State of Wisconsin Aquatic Life Toxicity Testing Methods Manual (s. NR , Wis. Adm. Code) receiving water must be used as the dilution water and primary control in WET tests, unless the use of another dilution water is approved by the Department prior to use. The dilution water used in WET tests conducted on outfall 001 shall be a grab sample collected from the Sheboygan River, upstream/out of the influence of the mixing zone and any other known discharge. The receiving water location must be specified in the WPDES permit. Historical WET Data: Below is a tabulation of all available WET data for outfall 001. Date Acute Results LC 50 (% survival in 100% effluent) Chronic Results IC 25 Initiated C. dubia Fathead Pass or Use in C. dubia Fathead Algae Pass or Use in minnow Fail? RPF? Minnow Fail? RPF? 9/15/ Pass Yes Pass Yes 5/18/ Pass Yes 10/19/ Pass Yes Pass Yes 3/15/ Pass Yes 4/10/ Pass Yes 3/19/ Pass Yes Pass Yes RPF = Reasonable Potential Factor Footnotes
76 WET Checklist. Department staff use the WET Checklist when deciding whether WET limits and monitoring are needed. As toxicity potential increases, more points accumulate and more monitoring is needed to insure that toxicity is not occurring. The Checklist recommends acute and chronic WET limits (as needed) based on the Reasonable Potential Factor (RPF), as required by s. NR , Wis. Adm. Code, and monitoring frequencies based on points accumulated during the Checklist analysis. The completed WET Checklist and monitoring recommendations are summarized in the table below. (For more on the RPF and WET Checklist, see Chapter 1.3 of the WET Guidance Document, at: WHOLE EFFLUENT TOXICITY (WET) CHECKLIST SUMMARY 1. INSTREAM WASTE CONC. 2. HISTORICAL DATA 3. EFFLUENT VARIABILITY 4. STREAM CLASSIFICATION 5. CHEMICAL SPECIFIC DATA 6. ADDITIVES 7. DISCHARGE CATEGORY 8. WASTEWATER TREATMENT A C U T E 1A. Not Applicable TOTAL POINTS = 0 2A. 3 tests used in RPF, all passed; RPF = 0 TOTAL POINTS = 0 3A. Little variability, a history of violations for BOD5 and TSS, consistent WWTF operations TOTAL POINTS = 5 4A. Warmwater sportfish community TOTAL POINTS = 5 5A. No acute toxicity criteria-based limits triggered due to high effluent results. Detected substances that did not trigger limits due to the detected results include ammonia, chromium, copper, nickel, zinc, chloride (3 pts). TOTAL POINTS = 3 6A. Chlorine added for disinfection, sulfur dioxide added for dechlorination. Ferric sulfate currently used for phosphorus removal. TOTAL POINTS = 5 7A. 5 industrial contributors = Two for food processing/dairy and three for metal finishing. TOTAL POINTS = 9 8A. Secondary Treatment TOTAL POINTS = 0 C H R O N I C 1B. IWC = 85% TOTAL POINTS = 15 2B. 6 tests used in RPF, all passed; RPF = 0 TOTAL POINTS = 0 3B. Same as Acute TOTAL POINTS = 5 4B. Same as Acute TOTAL POINTS = 5 5B. Chronic toxicity criteria-based limits triggered due to high effluent results for chloride and ammonia (6 pts). Detected substances that did not trigger limits due to the detected results include chromium, copper, nickel, and zinc (3 pts). TOTAL POINTS = 9 6B. Additives used more than once per 4 days, same points as acute. TOTAL POINTS = 5 7B. Same as Acute TOTAL POINTS = 9 8B. Same as Acute TOTAL POINTS = 0
77 Continued from previous page 9. DOWNSTREAM IMPACTS A C U T E 9A. None attributable to discharge. TOTAL POINTS = 0 TOTAL POINTS C H R O N I C 9B. Same as Acute TOTAL POINTS = 0 WET Monitoring and Limit Recommendations: Based on historical WET data and RPF calculations (as required in s. NR , Wis. Adm. Code), neither acute nor chronic WET limits are required. Based upon the point totals generated by the WET Checklist, other information given above, and Chapter 1.3 of the WET Guidance Document, three acute WET tests are recommended and twice per year chronic WET testing is recommended in the reissued permit. Tests should be done in rotating quarters, in order to collect seasonal information about this discharge. When including recommended monitoring frequencies in the WPDES permit, staff should specify required quarters (e.g., Jan-Mar, Apr-Jun, Jul-Sep, or Oct-Dec).
78 ATTACHMENT SUMMARY OF KIEL CHLORIDE DATA, Date Chloride (mg/l) Date Chloride (mg/l) Date Chloride (mg/l) 10/30/ /1/ /1/ /30/ /22/ /9/ /3/ /5/ /6/ /13/ /17/ /3/ /15/ /1/ /2/ /2/ /4/ /10/ /2/ /2/ /8/ /4/ /13/ /5/ /2/ /13/ /18/ /6/ /15/ /11/ /4/ /13/ /1/ /8/ /3/ /13/ /7/ (break) 11/7/ /7/ /1/ /4/ /19/ /13/ /16/ /17/ /2/ /27/ /1/ /2/ /4/ /4/ /2/ /1/ /1/ /5/ /6/ /13/ /1/ /24/ /25/ /6/ /14/ /8/ /24/ /6/ /5/ /1/ /9/ /17/ /13/ /5/ /1/ /9/ /5/ /4/ /7/ /9/ /4/ /6/08 265
79 APPENDIX II 3 WISCONSIN DEPARTMENT OF NATURAL RESOURCES (DNR) LETTER Facility Planning Effluent Limits / September 9, 2014
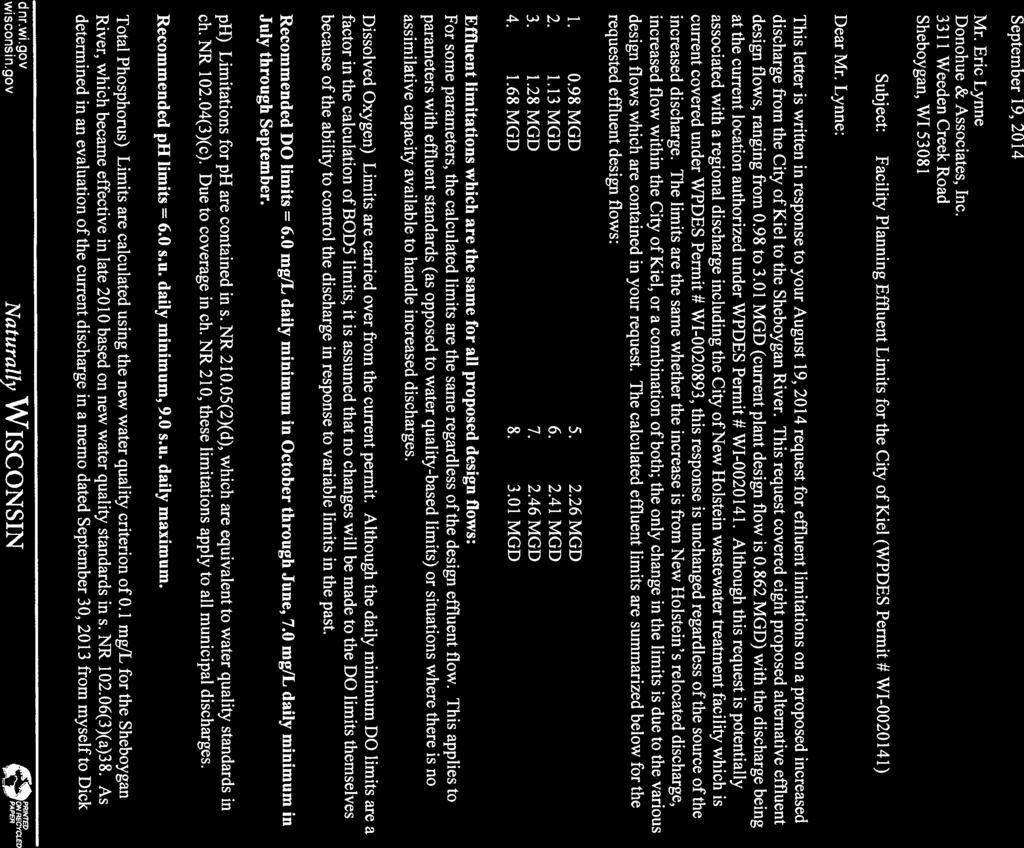


80


81
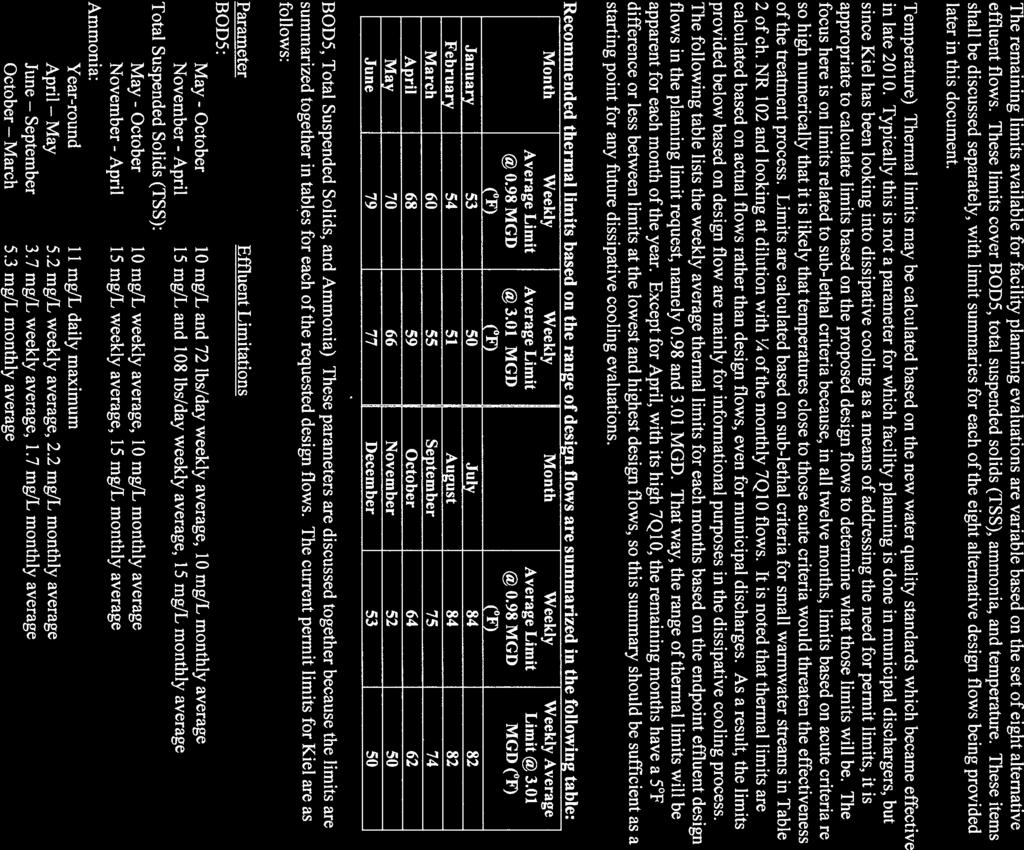

82


83
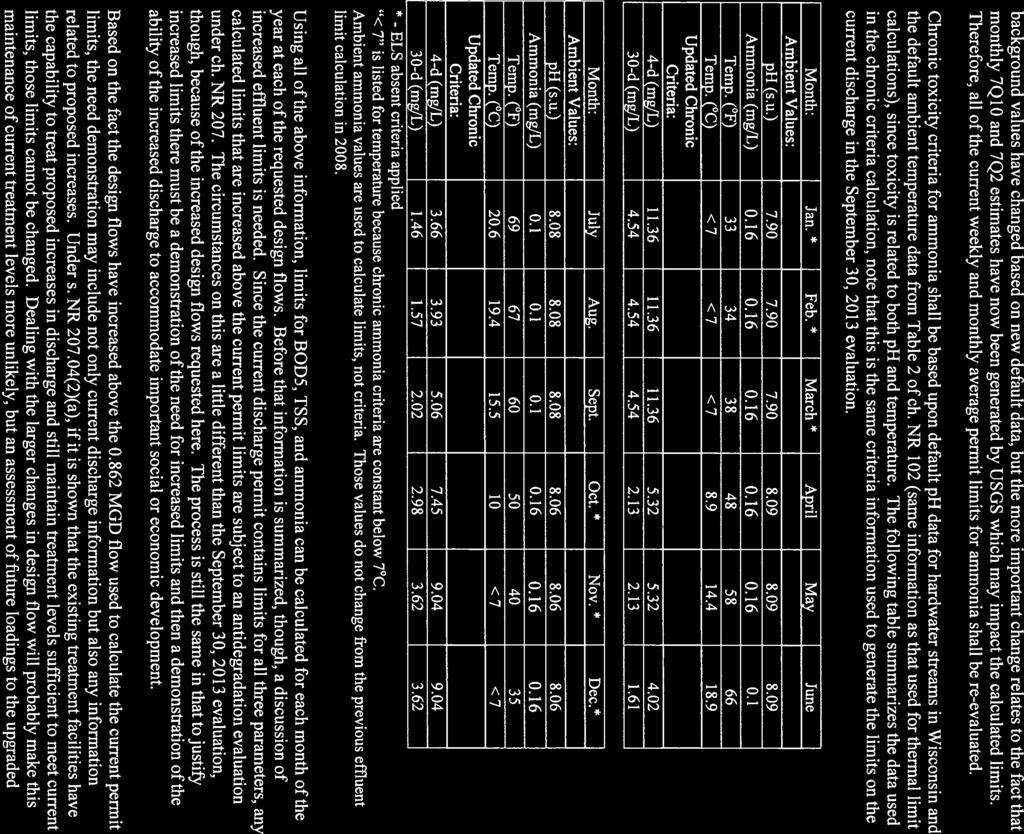
84
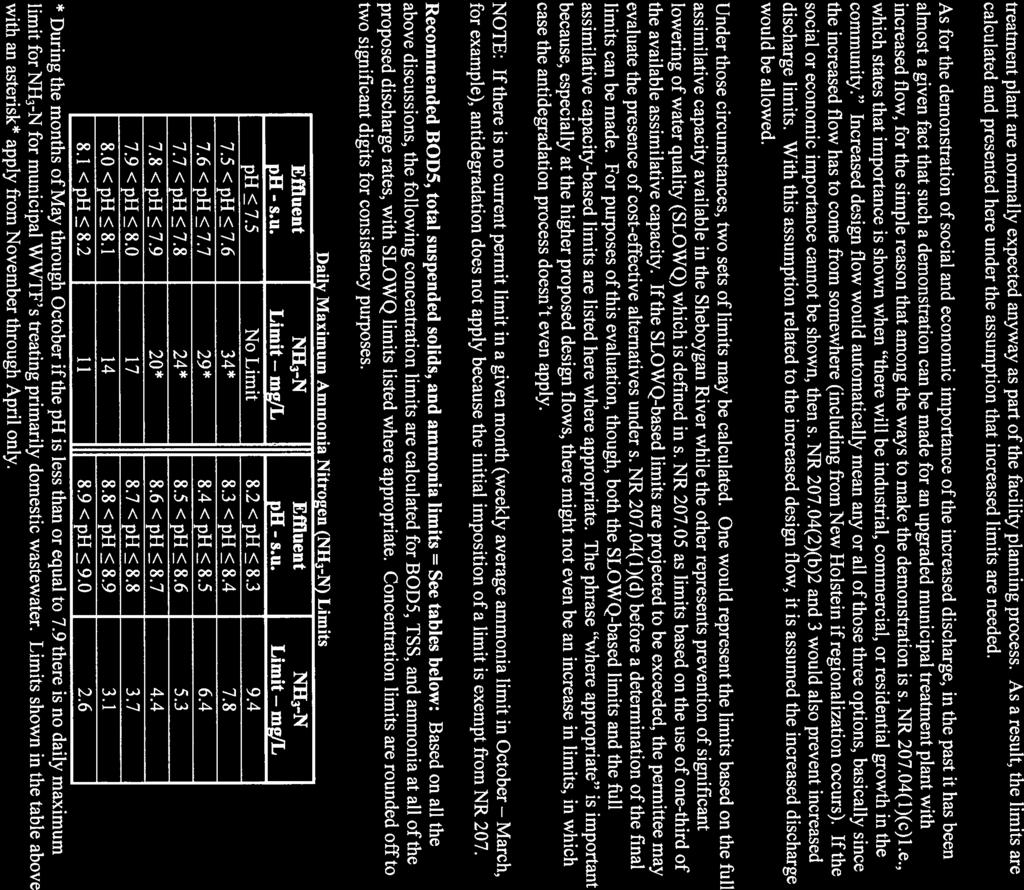
85
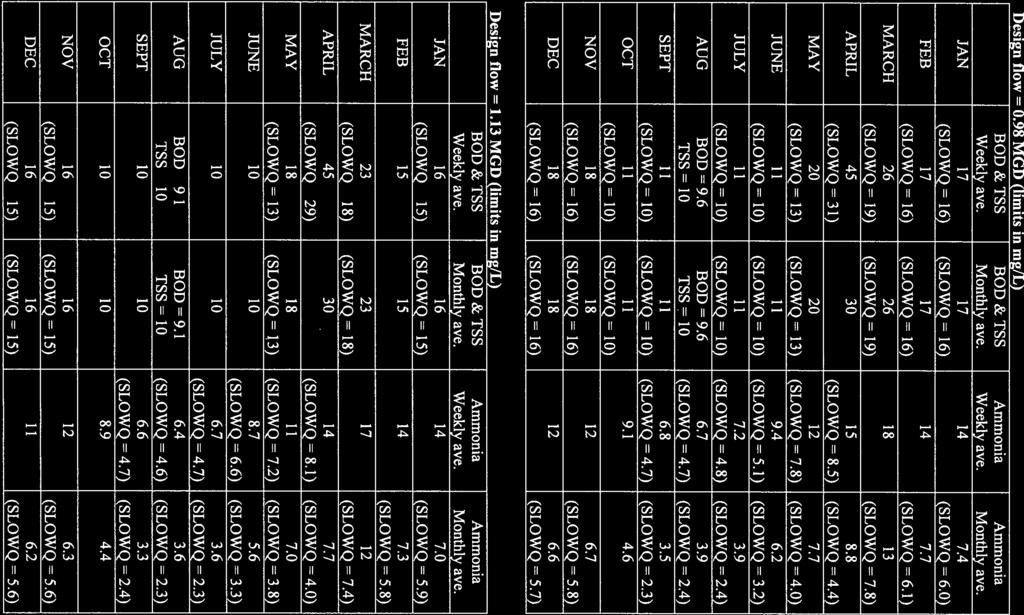
86

87

88
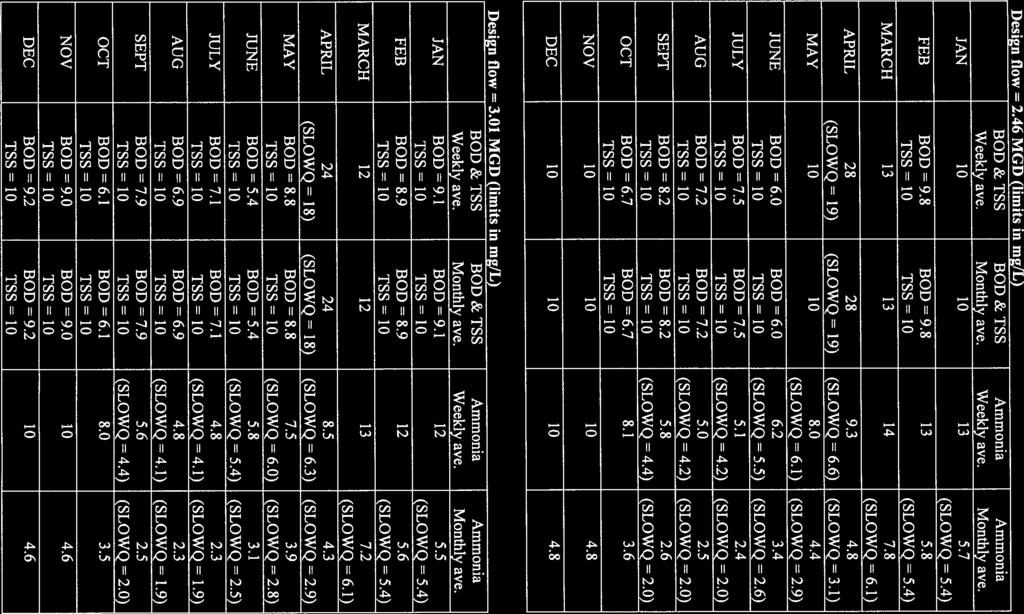
89
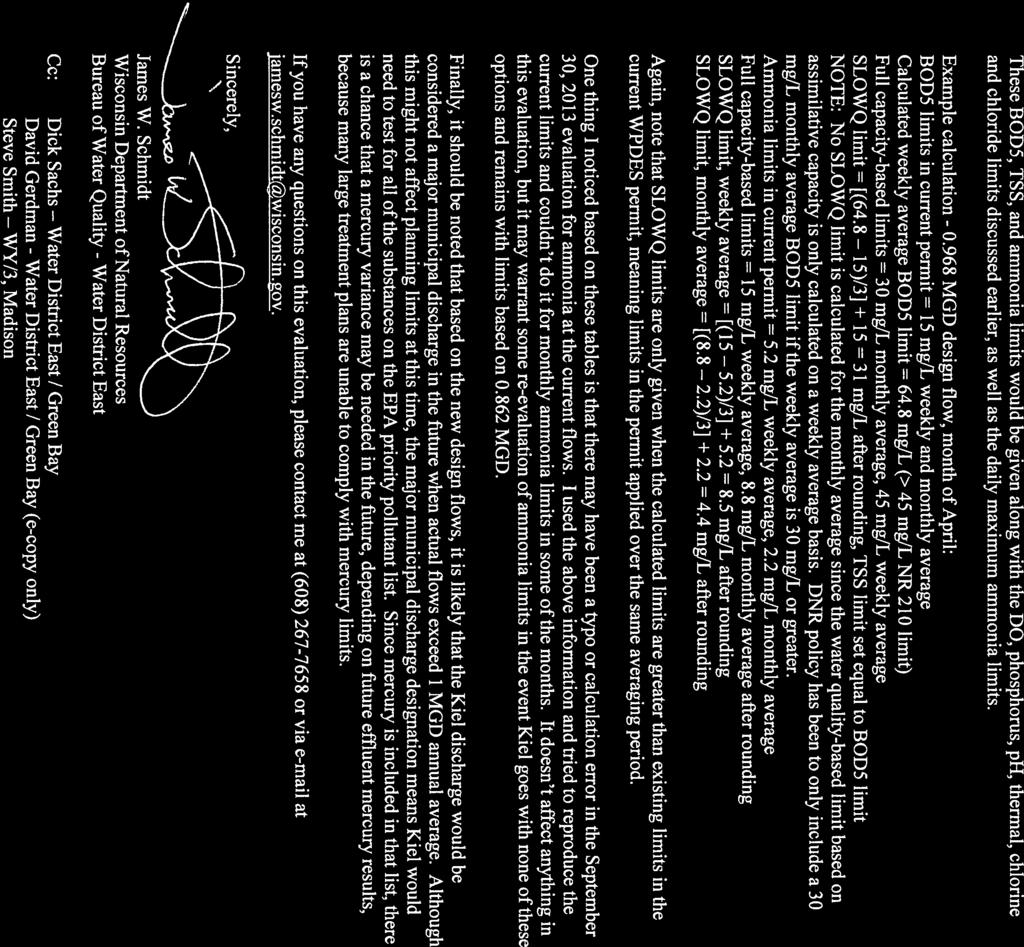
90
91 Chapter III CURRENT SITUATION & NEEDS ASSESSMENT A. PLANNING AREA DESCRIPTION The City of Kiel is located mostly in the far southwest corner of Manitowoc County; the western portion of the City is located in Calumet County. The City is located at the intersection of STH 32/57 and STH 67. The Sheboygan River flows through the southeastern one third of the City. The 20 Year Comprehensive Plan, prepared by Bay Lake Regional Planning Commission, was adopted by the City on December 10, Relevant planning area description information provided in the Comprehensive Plan is included in this Facility Plan document. 1. Topography The topography of the area surrounding the City of Kiel was molded by the last two substages of the Wisconsin Stage of Glaciation. The till left by the glaciers gives the area a Kettle Moraine type topography with gravely hills, kettle shaped holes and coarse, sandy soils. The northwestern area of the City is relatively flat, and there is more relief in the areas closer to the Sheboygan River and especially on the south side of the River. The elevation within the City ranges between approximately 860 to 950 feet about sea level. 2. Geology, Soil Conditions & Hydrology As described in the Comprehensive Plan, the two different glacial drifts that covered the area formed the landscape and distribution of the soils of the Kiel area. The glacial geology is characterized by glacial debris that was pushed or deposited by each glacial sub stage to form plains, depressions, valleys and hills. The following information is provided in the 20 Year Comprehensive Plan regarding the bedrock geology of the area: A layer of undifferentiated dolomite bedrock from the Silurian age underlies the entire planning area. This series of sedimentary rocks, approximately 75 feet thick, is underlain by a formation known as Maquoketa Shale. Below the Maquoketa Shale area is a group of rock units consisting of sandstone, shale and dolomite, known collectively as the sandstone aquifer. The Maquoketa formation is estimated to be 400 to 450 feet thick. The sandstone aquifer is estimated to be 800 to 850 feet thick. The soils in the area consist of the Hochheim Theresa Pella Series. These soils are generally well drained and are well suited to building site development. These soils are susceptible to moderate frost action. CHAPTER III CURRENT SITUATION & NEEDS ASSESSMENT Wastewater Treatment System Facilities Plan CITY OF KIEL Calumet & Manitowoc Counties, Wisconsin Chapter III 1
92 3. Hydrology/Surface Water/Wetlands/Floodplains a. Watersheds: A significant majority of the City of Kiel drains to the Sheboygan River Watershed. A small area in the northwest corner of the Village drains to the South Branch of the Manitowoc River. b. Surface Water: The Sheboygan River bi sects the City, and the Wastewater Treatment Facility discharges to the River. There are no other surface waters of note within the City limits. c. Wetlands & Floodplains: Mapped wetland areas and floodplains within the City are primarily adjacent to the Sheboygan River, as illustrated on Figure III 1. The wetland areas serve an important function by providing flood control during significant precipitation events and spring runoff, they filter pollutants out of water, offer habitat for a variety of plant and animal life and recharge groundwater systems. Wetlands are designated by the State and Federal governments as environmentally sensitive areas that should be protected from development. As stated in the Comprehensive Plan, floodplains are often viewed as valuable recreational and environmental resources. These areas provide for storm water retention, groundwater recharge and habitat for various kinds of wildlife unique to the water. The 100 year floodplain in the Kiel area is outlined on Figure III Endangered Resources Information provided on the Wisconsin Department Of Natural Resources (DNR) website, Endangered Resources Preliminary Assessment, indicates that no endangered resources have been recorded in the vicinity of the Wastewater Treatment Facility site. No further action is required or recommended with regard to Endangered Resources. A copy of the information obtained from the DNR website is provided in Appendix III Archaeological/Historical/Cultural Resources A request was made of the DNR Archaeologist to determine if any archaeological sites or historic structures/sites are present in the vicinity of the Kiel Wastewater Treatment Facility. The response received was that there are no recorded historic properties reported to occur within the project location. A copy of the response letter from the DNR is provided in Appendix III 2. CHAPTER III CURRENT SITUATION & NEEDS ASSESSMENT Wastewater Treatment System Facilities Plan CITY OF KIEL Calumet & Manitowoc Counties, Wisconsin Chapter III 2

93 FIGURE III-1 WETLANDS FACILITIES PLANNING CITY OF KIEL, WI McM #K /29/2015 ID: PPT\2015\MCM WI\KIEL-FACILITIES PLANNING FIGS.PPTX AJV:jmk
94 FIGURE III-2 FLOODPLAINS FACILITIES PLANNING CITY OF KIEL, WI McM #K /29/2015 ID: PPT\2015\MCM WI\KIEL-FACILITIES PLANNING FIGS.PPTX AJV:jmk
95 6. Land Use & Demographics Existing land use within the City of Kiel was identified during the development of the 20 Year Comprehensive Plan in A map of the existing land use was developed from a field survey conducted in September 2001 by Bay Lake Regional Planning Commission, and is included as Figure III 3. A Sewer Service Area Plan has not been developed for the City. Due to the City being under a population of 10,000, the City is not required to develop a Sewer Service Area Plan, as described in NR 121. The Wisconsin Department of Administration (DOA) annually produces population estimates for Wisconsin municipalities based on prior Census, and analysis of contemporary data including housing units, automobile registrations, residential electric meters and other indicators of population change. The DOA also develops population projections for Wisconsin municipalities. The estimates and projections provided by the DOA are presented in Table III 1, and as illustrated graphically in Figure III 4. The projected population for 2035 is 4,260. The population projections were submitted to the Bay Lake Regional Planning Commission for review and comment. The Commission indicated these are the same projections they would use for planning purposes. (Angela Pierce, Natural Resources Planner, May 1, 2015) Table III 1 Population Projection City Of Kiel 1990 Census 2, DOA Estimate 3, Census 3, DOA Estimate 3, Census 3, DOA Estimate 3, DOA Projection 3, DOA Projection 4, DOA Projection 4, DOA Projection 4, DOA Projection 4,235 CHAPTER III CURRENT SITUATION & NEEDS ASSESSMENT Wastewater Treatment System Facilities Plan CITY OF KIEL Calumet & Manitowoc Counties, Wisconsin Chapter III 3

96 FIGURE III-3 LAND USE FACILITIES PLANNING CITY OF KIEL, WI McM #K /29/2015 ID: PPT\2015\MCM WI\KIEL-FACILITIES PLANNING FIGS.PPTX
97 B. INFRASTRUCTURE DESCRIPTION 1. Public Water System The City of Kiel owns and operates a public water system that serves the properties in the City. Below is a brief summary of various features of the system: Number Of Customers & Sales Of Water 2014 Type Number Gallons Sold Residential 1,550 64,547,000 Commercial 142 9,797,000 Industrial 16 92,328,000 Public Authority 19 3,292,000 Multifamily Residential 10 2,100,000 Totals 1, ,064,000 CHAPTER III CURRENT SITUATION & NEEDS ASSESSMENT Wastewater Treatment System Facilities Plan CITY OF KIEL Calumet & Manitowoc Counties, Wisconsin Chapter III 4
98 Water Usage Total Pumpage Into The System Average Day 659,050 gpd Maximum Day 952,000 gpd Total GPCD 175 gpcd based on total pumpage to system Residential GPCD 47 gpcd based on residential metered sales Water System Infrastructure Supply Four Wells Well #1 Washington Street Well #3 North First Street Well #4 STH XX Well #5 Clay Street Storage Elevated Tanks North Tank 200,000 gallons / Constructed 1971 South Tank 200,000 gallons / Constructed 1986 Water Main Approximately 29 miles, ranging in size from 4 inch diameter to 18 inch diameter 2. Sanitary Sewer Collection System The City of Kiel owns and operates the sanitary sewer collection system that collects and transports wastewater to the Wastewater Treatment Facility. A map of the system is provided on Figure III 5. The City provides sewer service to the residential, commercial, industrial and public authority properties within the City limits. Sewer service has been provided since the early 1900 s. Generally, flow in the system drains from the west to the east to the Wastewater Treatment Facility. There is also an area of the City located south and east of the Facility that is served. The sanitary sewer system consists of vitrified clay, truss, concrete and PVC pipe, ranging in size from 6 inches to 24 inches in diameter. Generally speaking, from the mid 1970 s to present, sanitary sewers were constructed of PVC pipe. Sewers constructed from the mid 1950 s to the mid 1970 s were constructed of concrete pipe or truss pipe. Prior to the 1950 s, sanitary sewers and laterals were constructed of 3 foot long sections of vitrified clay or concrete pipe. There are six Lift Stations in the system; the largest of which is the River Road Lift Station, which pumps wastewater from the western three fourths of the City. The locations of the Lift Stations are identified on Figure III 5. CHAPTER III CURRENT SITUATION & NEEDS ASSESSMENT Wastewater Treatment System Facilities Plan CITY OF KIEL Calumet & Manitowoc Counties, Wisconsin Chapter III 5
99 8" 8" 8" 8" 8" 8" 15" 10" 8" 10" 8" 10" 8" 8" 10" 8" 8" 8" 8" 8" 8" 8" 8" 8" 8" 8" 12" 10" 8" 6" 8" 8" 8" 8" 8" 8" 8" 8" 8" 8" 8" 8" 12" 8" 8" 10" 12" Sanitary Sewer System w:\pr O JECTS\K0015\950262\00\GIS\Figure _ I-5_B.m xd June 11,2015 kpk! 2 10" L! 2! 2! 2 8" ") S 8" 8"! 2! 2 6" FM! 2! 8"! 2 2! 2!! 2 2! 8"! 2 10" 8" 8" 8" 8" 8"! 2 6" FM L 8" ") S 8" 8" 8" 8"! 2 8" 8" 10"! 2 12" 10"! 2! 2 10" 2! 8" 8" 8" 8" 6" 8" 12"! 2! 2! 2 8" 8" 10" 15" 12" 2! 2! 2! 2! ") S L 4" FM 8" 8"! 2 8" 8" 8" 8"! 2! 2! 2! 2! 2! 2 8" 21" 8" 8" 8" 2! 2! 2! 2! 2! 2! 8" 2! 2! 2!! 2! 2 2! 2 2!! 8" 8" 8" 8" 8" 10" 2! 8" 8" 24" 12" 8" 8" 6" FM ") S L 8" 8" 10" 8" 21"! 2 8" 8" 15" 8" 18" 2! 2! 12" 15" 24" 8"! 2 ") LS WWTP 8" FM L ") S 8" 15" 8" 12"! 2! 2 2! 2! 2! 2! 2! 8" 2! 2!! 2 12"! 2 2! 2! 8" 8" 8" 8" 8" 2! 8" 8" 8"! 2! 2! 2! 2! 2 8"! 2! 2! 2! 2 8"! 2 ") LS Lift Station SanitaryManhole 4"Forc e m ain 6"Forc e m ain 8"Forc e m ain 6"GravityMain 8"GravityMain 10"GravityMain 12"GravityMain 15"GravityMain 18"GravityMain 21"GravityMain 24"GravityMain Other Mapped Features Munic ipalbound ary Parc e lline Stre am /R ive r Sourc e :Calum e t County, ;Manitowoc County, Dis c laim e r:the prope rtyline s,right-of-wayline s,and othe r prope rty inform ation on this d rawing we re d e ve lope d or obtaine d as part of the CountyGe ographic Inform ation Sys te m or through the County prope rtytaxm apping func tion.mc MAHO Nd oe s not guarante e this inform ation tobe c orre c t,c urre nt,or c om ple te.the prope rtyand right-of-wayinform ation are onlyinte nd e d for us e as age ne ral re fe re nc e and are not inte nd e d or s uitable for s ite -s pe c ific us e s. Anyus e tothe c ontraryof the above s tate d us e s is the re s pons ibility of the us e r and s uc h us e is at the us e r s own ris k. I 0 1,250 2,500 Fe e t FIGUR E I-5 SANITARY SEWER SYSTEM CITYO FKIEL CALUMETANDMANITO WO C CO UNTIES,WISCO NSIN
100 3. Description Of Wastewater Treatment Facility a. Liquid Train: Flow arrives at the Wastewater Treatment Facility via force mains; an 8 inch and 12 inch force main from the River Road Lift Station transports wastewater generated from the majority of the service area, while the smaller Rockville Road Lift Station has a 4 inch force main and serves a residential area southeast of the Treatment Facility. The River Road Lift Station and force mains are equipped with magnetic flow meters, which are utilized for influent flow recording. The Rockville Road Lift Station has no flow meter, and utilizes a wet well calculation to add the flow volume pumped, to the Wastewater Treatment Facility influent flow. The force mains discharge upstream of two (2) parallel fine screens. The incoming flows are split between two (2) channels, each equipped with a spiral type fine screen utilizing a perforated basket with ¼ inch openings. Each screen is rated at 4.3 mgd, which is the firm capacity of the screening system. One (1) ultrasonic level sensor provides liquid level control of the screens. Flows combine after the fine screens are sampled flow proportionally. A 12 x 12 x 12 Sidewater Depth (SWD) aerated grit chamber follows the sampling point. At maximum day design flow, the hydraulic detention time is 6.0 minutes, which is double the time allowable per NR 110. The grit chamber equipment dates back to 1979, while the remainder of the pretreatment facilities were constructed in Settled grit is removed via air lift, and is transported via a 4 inch pipe to a grit classifier located in the adjacent Service Building. There is no grit washer to separate organic and inorganic materials. Originally built in 1965, the Service Building previously provided the pretreatment functions. A more detailed discussion of the Service Building will follow. A bypass channel provided around the grit chamber. Downstream of the aerated grit chamber, a 16 inch pipe transports forward flows to a primary clarifier splitter box. The primary splitter box does not use any weirs to split the flow evenly, rather there are two (2) 16 inch pipes exiting the splitter box. One (1) pipe discharges into the stilling well of the north clarifier, which was originally constructed in 1965, and modified in The 1979 modifications included additional concrete wall height and mechanisms, along with construction of the south primary clarifier and splitter box / sludge / scum handling systems. Uneven flow splitting between the two (2) clarifiers can lead to operational inefficiencies and difficulties. CHAPTER III CURRENT SITUATION & NEEDS ASSESSMENT Wastewater Treatment System Facilities Plan CITY OF KIEL Calumet & Manitowoc Counties, Wisconsin Chapter III 6
101 The primary clarifiers are each 28 feet in diameter with a SWD of feet. Maximum hourly flows in excess of mgd exceed the allowable surface setting basin rate of 1,500 gal/sq.ft./day per NR 110. The 16 inch primary effluent piping from the north and south clarifiers is combined into a single 16 inch diameter pipe that extends to the aeration system splitter box, located at the southwest corner of the north aeration basins. Normally, secondary influent is split between three (3) aeration trains: the original 1965 south aeration train, and two (2) north aeration trains constructed in When flows exceed 2.0 mgd, some forward flow is diverted away from the splitter box and directed to the south aeration train, which is at a lower elevation, alleviating a hydraulic limitation. The aeration systems are designed to provide biological phosphorus removal. Hyperbolic mixers in anoxic zones provide mixing energy to keep the process active. Fine bubble ceramic diffusers provide air within the aerobic zones for mixing and oxygen transfer. The south aeration system consists of Aeration Basins #7, #8 and #9. Basin #7 is divided in two (2) parts by a curtain baffle wall; one (1) side equipped with a hyperbolic mixer, and one (1) side with fine bubble diffusers. Similarly, the north aeration trains are set up with three (3) basins each. The westerly train consists of Aeration Basins #1, #3 and #5; and the easterly train consists of Aeration Basins #2, #4 and #6. Basins #1 and #2 are equipped with hyperbolic mixers and curtain baffle walls, similar to the south train. The north aeration basin trains have dimensions of 65 L x 32 W x 14 SWD, and include a 30 L anoxic zone at the influent end of Basins #1 and #2. The south aeration train has dimensions of 64 L x 28 W x 14 SWD, and contains a 30 L anoxic zone at the influent end of Basin #7. Each north train has approximately 90,500 gallons more than the south train. The four (4) aeration blowers are located in the Solids Handling Building, and the 24 inch air main is buried en route to the aeration basins. Two (2) blowers date back to the 1997 project, while two (2) were included in the 2008 project. The older blowers are 100 HP, each, and rated for 1,680 8 psig, while the two (2) newer blowers are 150 HP with a 2,520 scfm, 8 psig capacity. Only the two (2) newer 150 HP positive displacement blowers are on Variable Frequency Drives (VFD s) and modulate in response to Dissolved Oxygen (D.O.) setpoints within the basins. The firm capacity of the blower system is 5,880 scfm, with one (1) of the new blowers out of service. The older 100 HP blowers have difficulty coming online when the dynamic backpressure increases due to diffuser fouling, and they experience motor overloading. Air splitting between the north and south basins is difficult to control, and the buried air main has leaking joints. CHAPTER III CURRENT SITUATION & NEEDS ASSESSMENT Wastewater Treatment System Facilities Plan CITY OF KIEL Calumet & Manitowoc Counties, Wisconsin Chapter III 7
102 Mixed Liquor Suspended Solids (MLSS) from the three (3) trains is combined in a splitter box adjacent to the east side of the south aeration tanks. A single 10 foot wide weir is provided and, as such, does not evenly split flows between the two (2) final clarifiers; rather, the hydraulics of the 16 inch influent pipe to each clarifier is controlling the flow to each. Two (2) final clarifiers, each 40 feet diameter with a SWD of feet, provide clarified effluent and a thickened sludge for return or wasting from the process. The December 2014 Master Plan notes that the maximum hour solids loading rate is 55.7 lbs./sq.ft./day, which exceeds the NR 110 limit of Settled sludge is removed from each clarifier via an organ pipe style mechanism, and transferred to a sludge well via a telescopic valve. Two (2) Return Activated Sludge (RAS) pumps, each rated at 1, feet Total Dynamic Head (TDH), are provided. There is no common section header for the RAS pumps, rather they are each connected to an individual clarifier s sludge well. While there is a normally open gate separating the two (2) sludge wells, there is no other means of pump backup. Waste sludge is drawn through a 2 inch line tapped into each pump s suction pipe. A single rotary lobe pump provides Waste Activated Sludge (WAS) pumping. At 60 Hz, the WAS pump is rated for psig, and there is no backup pump. The pump can be run up to 90 Hz and discharge 90 gpm. In the event the 2 inch WAS pump is out of service, the RAS pumps can discharge WAS to the aerated sludge holding tanks. Flow metering of RAS and WAS is provided by magnetic flow meters dated back to Scum removed from the final clarifiers is collected in a common wet well, adjacent to the north clarifier. Two (2) centrifugal pumps, each rated at feet TDH, discharge scum to the aerated sludge tanks. Clarified final effluent leaves each clarifier via a 16 inch diameter pipe, and is combined in a single pipe of the same diameter prior to entering the sand filter influent wet well. The sand filter is divided into four (4) cells, each 12 x 12, with 30 inches of mono media. Three (3) dry pit centrifugal feed pumps with extended motor shafts and VFD s are each rated for 1, feet TDH. Backwash is provided by two (2) vertical turbine pumps, each rated for 2, feet TDH. Backwash air scour is provided by a single 25 HP rotary lobe blower. Filtered effluent flows by gravity from a filter effluent wet well to a chlorine contact chamber for disinfection. Flows drop over a weir into a chlorine mix chamber, where chlorine solution is diffused into the flow stream. Two (2) submerged 36 x 36 cast iron gates are utilized to split flows between two (2) chlorine contact chambers. These gates are in need of repair or replacement to provide a tight seal. Each contact chamber consists of five (5) passes, each with a L/W ratio of 26:2.5, which exceeds 40:1 required by NR 110. Upon exiting the contact chambers, an CHAPTER III CURRENT SITUATION & NEEDS ASSESSMENT Wastewater Treatment System Facilities Plan CITY OF KIEL Calumet & Manitowoc Counties, Wisconsin Chapter III 8
103 effluent structure combines the two (2) flow streams and dechlorination is provided with sulfur dioxide. 150 lb. cylinders are utilized for both chlorine and sulfur dioxide gas. Downstream of the disinfection system, a 16 inch pipe conveys flow to a postaeration tank to ensure adequate Dissolved Oxygen (DO) levels prior to discharge. The 32 foot diameter tank has a SWD of 8 feet, and utilizes EPDM membrane fine pore diffusers to aerate the effluent prior to discharge. The Service Building was originally constructed in 1965, and functioned as the Headworks and provided space for the Office/Laboratory, as well as equipment. Currently, the blowers for the sludge holding tanks are housed in the Service Building, along with the grit system, post aeration and channel aeration blowers. Non potable water pumps are housed in the lower level, and a grit classifier is installed in former garage space. High strength waste is received at the Wastewater Treatment Facility via local haulers. A manually cleaned bar rack precedes a converted aeration basin, which serves as a storage tank. Located at the north end of the south aeration train, the tank has a total volume of nearly 188,000 gallons at a 14 foot SWD. The high strength wastes are equalized in the tank, and fed upstream of the two (2) fine screens, un metered, but sampled with the influent flow stream. Later this year, a dividing wall will be constructed in the high strength waste tank to segregate septage, and high strength wastes from dairy facilities. The Treatment Facility is also in the process of adding a 280 kw engine/generator to utilize the digester gas to create electricity and hot water for digester/supplemental heating. b. Solids Train: WAS from the final clarifiers is co thickened in the primary clarifiers. Primary scum flows by gravity into a scum wet well, which can also receive primary sludge via telescopic valves. Typical operation utilizes a direct connection between the clarifier center sludge pit and the sludge pump; once per day the telescopic valve is utilized to check the sludge thickness and to clear the suction piping. Two (2) air driven diaphragm pumps, located in the digester complex, are used to transfer primary sludge/scum to the primary digester. The east pump (SP6) is the principle pump for transferring primary sludge into the primary digester. The west pump (SP5) is on a common suction header with SP6, but is utilized primarily as a sludge transfer pump to send sludge to the aerated sludge holding tanks. The anaerobic digestion system consists of two (2) 45 foot diameter tanks; one (1) designated as a primary, and one (1) designated as a secondary digester. The primary digester has an operating SWD of 21 feet, while the secondary digester has an operating SWD of 26 feet. Total volumetric capacities of the primary and CHAPTER III CURRENT SITUATION & NEEDS ASSESSMENT Wastewater Treatment System Facilities Plan CITY OF KIEL Calumet & Manitowoc Counties, Wisconsin Chapter III 9
104 secondary digesters is 269,652 gallons and 342,537 gallons, respectively. The primary digester is heated via a single boiler/heat exchanger and mixed via a gas mixing system. The secondary digester is unheated and unmixed, and functions as a storage vessel prior to dewatering. The primary digester has a fixed cover, while the secondary has a floating cover; both covers are in need of replacement. A single 150 gpm centrifugal pump is utilized for recirculation of the primary digester contents. The combination boiler/heat exchanger has a boiler capacity of 825,000 btu/hour and a heat exchanger capacity of 375,000 btu/hour. Sludge transfer from the primary to the secondary may be accomplished with the recirculation pump, but is typically a gravity flow operation via an overflow box. Supernatant is decanted and flows by gravity to a submersible pump station, which transfers the flows to the effluent end of the grit removal system via two (2) separate force mains. Stabilized sludge is transferred with one (1) of the air driven diaphragm pumps to a pair of aerated sludge holding tanks. The holding tanks are 62 x 25 x 16 SWD, each, and provide a combined total aerated storage capacity of 371,000 gallons. The sludge holding tanks can be decanted to the recycle wet well in order to maximize the storage volume and minimize the volume of sludge to be dewatered. The recycle wet well has two (2) dry pit centrifugal pumps, each rated for feet TDH, which transfer flows to the effluent end of the grit removal system or to the aeration basin splitter box. The storage tanks are mixed via coarse bubble diffused aeration. Six (6) drop legs per storage tank provide a spiral roll aeration pattern. A separate 8 inch air main extends from the Service Building blowers to each sludge storage tank. Three (3) positive displacement blowers are provided; two (2) duty blowers, and one (1) swing blower for backup. The capacities of the duty and backup blowers are different, as are the manufacturers and age. This may lead to operational problems when one (1) blower cannot overcome the operating pressure of the other in the event supplemental air is required. Sludge dewatering is accomplished with a single 2.0 m belt press. There is no redundancy or backup unit. Two (2) belt press feed pumps transfer sludge from the sludge holding tanks to the belt press; one (1) pump is a progressive cavity type, while the other is a rotary lobe style. Each belt press feed pump is rated for a 150 gpm flow rate, while the press is limited to a 125 gpm/1,000 lbs./hour capacity. Filtrate is discharged to the effluent end of the grit removal system via gravity. Dewatered sludge ranges from 14% to 17% solids. A conveyor system transfers the cake from the press to a lime pasteurization system. The pasteurization system is rated for 800 lbs./hour, and produces a Class A biosolids product. A lime storage silo provides 10 to 12 days of lime storage. However, the Operations Staff has CHAPTER III CURRENT SITUATION & NEEDS ASSESSMENT Wastewater Treatment System Facilities Plan CITY OF KIEL Calumet & Manitowoc Counties, Wisconsin Chapter III 10
105 been utilizing fly ash to reduce costs. The fly ash substitution requires approximately twice as much when compared to lime and the available storage in the silo is approximately 4 to 7 days. The pasteurized biosolids are loaded into a 5 cubic yard dump truck. 3 to 4 times each day, the truck transports the biosolids from the load out garage bay to the Cake Storage Building. The Cake Storage Building is approximately 80 W x 140 L and has 9,260 square feet of available floor space to store biosolids. A front end loader is utilized to stack and load out biosolids; a stack height of 12 feet is achievable, but can vary depending on the solids content. c. Electrical: 1) Utility Service The Wastewater Treatment Facility receives electrical service from the City of Kiel Electric Utility. High voltage (24.9 kv) is routed to the site, and to a pad mounted transformer on the east side of the Treatment Facility. That transformer steps the voltage down from 24.9 kv to 4160V. From there, an underground service lateral extends westward to a transclosure / transformer located near the Solids Handling Building (Building #700). The transclosure contains three (3) single phase transformers, 250 kva each, which step the voltage down from 4160V to 480V. Metering takes place on the secondary (480V) side of the single phase transformers. a) Electric Utility Service, Summary Information: (1) Serving Utility: City of Kiel, Electric Utility (2) Primary Voltage: 4160V (3) Secondary Voltage: 480V (4) Service Transformer Capacity: 750 kva (5) Service Amp Rating: 1,600 amp plug with ampere setting of 0.7; or 1,120 amps (6) Maximum available Fault Current at Utility Service Point: 50,119 amps. b) Assessment: The Electric Utility has stated that the existing service configuration to the Wastewater Treatment Facility is undesirable, and they desire to change it. The Electric Utility does not wish to sustain having two (2) transformer settings, nor do they wish to maintain the existing transclosure and single phase transformers. The Electric Utility s long term intention is to remove both existing transformer settings, and replace them with one (1) new padmounted transformer in place of the existing transclosure. CHAPTER III CURRENT SITUATION & NEEDS ASSESSMENT Wastewater Treatment System Facilities Plan CITY OF KIEL Calumet & Manitowoc Counties, Wisconsin Chapter III 11
106 Of particular concern regarding the utility service is the existing maximum available fault current. The maximum available fault current is the amount of electric current that would be expected to flow in the event of an accidental 3 phase short circuit. According to the Electric Utility, the available fault current at the point of utility service from the Kiel Electric Utility is 50,119 amps. At the location of the main service equipment (MCC 7), the available fault current drops to approximately 48,000 amps. Unfortunately, the main service equipment MCC 7 is rated for a maximum short circuit current of only 42,000 amps. The existing main electrical equipment is, therefore, underrated, when compared to the 48,000 amps of available fault current. In the worst case scenario, if a 3 phase short circuit were to occur within the electrical service gear, the electrical equipment might be subjected to levels of electrical energy beyond its ability to sustain it, and possible violent destruction of equipment could occur. In addition, such an incident would represent a safety hazard to personnel, and the Treatment Facility could be rendered without power for an indefinite period of time. The electrical equipment short circuit rating should be addressed in the near future. 2) Electrical Distribution Equipment The existing Wastewater Treatment Facility power distribution system is depicted in single line diagram form in Figure III 6. Power distribution, as well as motor control, is accomplished with Motor Control Centers (MCC s) distributed throughout the Treatment Facility campus. Existing Wastewater Treatment Facility MCC s are listed in Table III 2. Table III 2 EXISTING TREATMENT FACILTY MOTOR CONTROL CENTERS (MCC s) CITY OF KIEL WISCONSIN Wastewater Treatment Facility Facilities Plan MCC No. Location Installed Manufacturer Model Amp Rating 1 Administration Building 1985 Square D Model 4 300A 1A Administration Building 1985 Square D Model 4 400A 2 Service Building 1982 Cutler Hammer Unitrol 300A 2A Service Building 1985 Square D Model 4 400A 2B Service Building 1985 Square D Model 4 300A 3 Digester Building 1985 Square D Model 4 300A 7 Solids Handling Building 1985 Square D Model 4 1,600A 7A Solids Handling Building 1985 Square D Model 4 1,200A 7B Solids Handling Building 1997 Allen Bradley Centerline 500A CHAPTER III CURRENT SITUATION & NEEDS ASSESSMENT Wastewater Treatment System Facilities Plan CITY OF KIEL Calumet & Manitowoc Counties, Wisconsin Chapter III 12
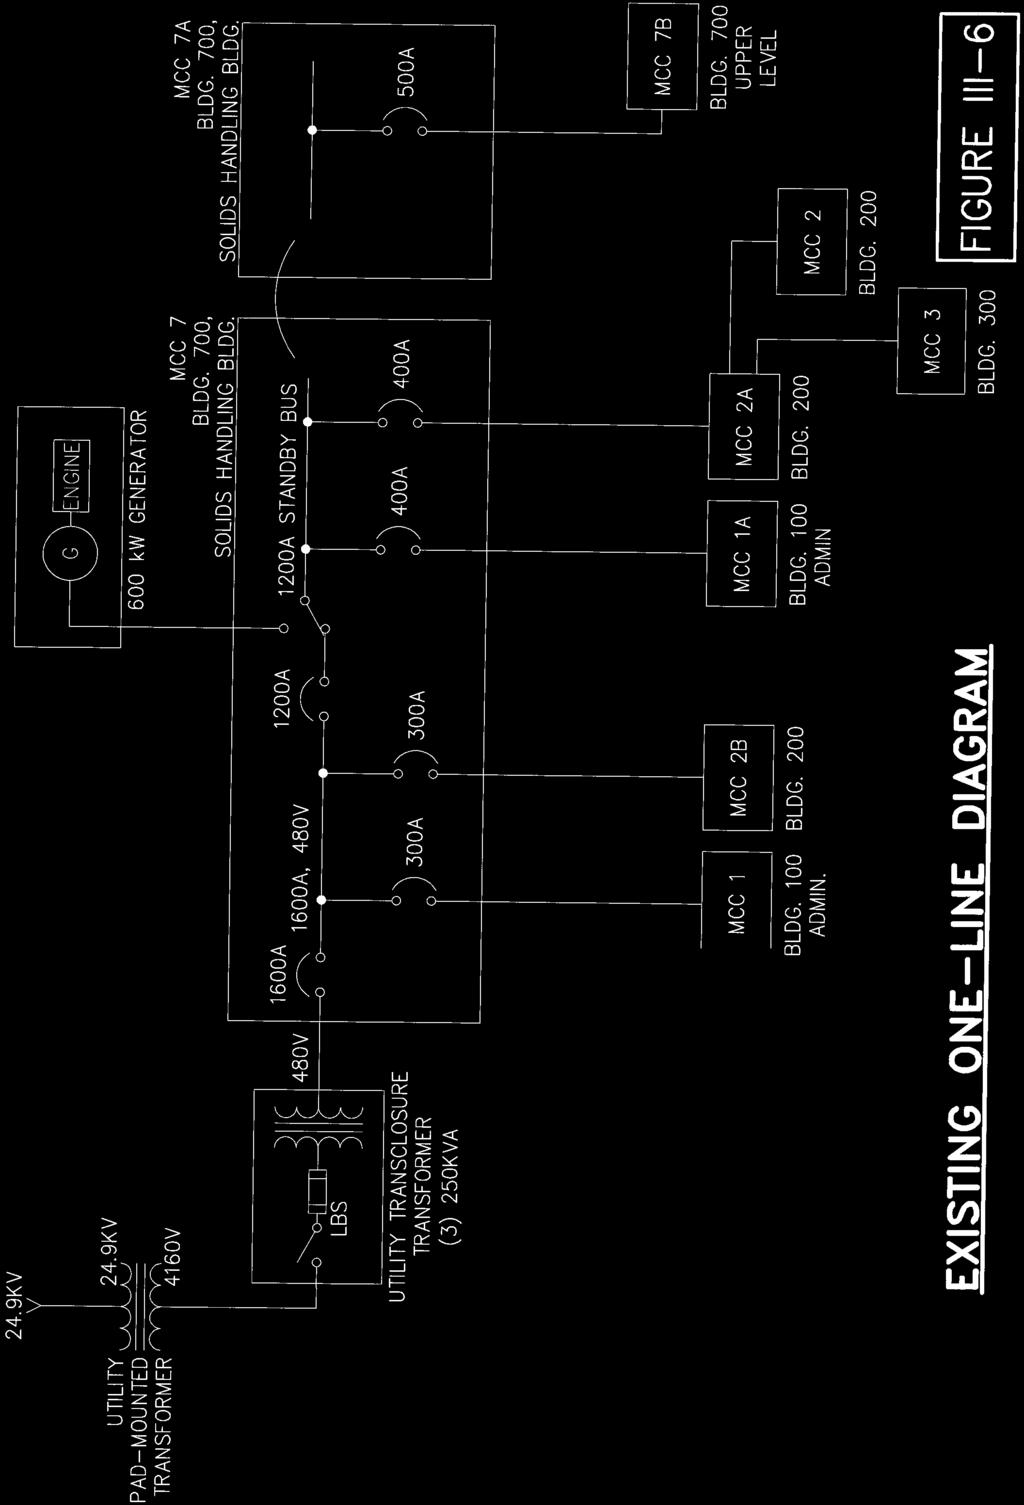
107
108 With the exception of MCC 7B, the MCC s are more than 30 years old. They are Square D, Model 4, MCC s, which have long been obsolete. Some parts are available for Model 4 MCC s, but new structures are not available. Adding VFD s to an existing Model 4 MCC is not practical. MCC 2, located in the Service Building, is an older Cutler Hammer Unitrol MCC, and predates even the Square D, Model 4 s. Like the Model 4 s, the Unitrol MCC is also obsolete. Replacing the existing obsolete MCC s with new structures should be considered. The existing circuit breaker panelboards are mostly of the same vintage as the MCC s. Several of them were manufactured as integral to the MCC s themselves, thus necessitating their replacement if the MCC s are replaced. The existing dry type transformers are also of the same age as the majority of the Treatment Facility electrical equipment; that is, over 30 years of service. In general, dry type transformers have a life expectancy of 25 to 30 years. Expected life increases if the transformer is operating in a cool and dry location; expected life drops if the transformer is operating in warm and humid location. While the indoor environmental conditions vary from building to building, the Wastewater Treatment Facility generally has conditions that are less than ideal for transformer longevity. Replacement of the older dry type power transformers should be considered. 3) Standby Power Standby power is provided at the Wastewater Treatment Facility by means of an on site diesel generator. The generator is 600 kw, 750 kva, as manufactured by Marathon Electric. The generator connects to the Facility electrical distribution system at MCC 7 (in the Solids Handling Building). The connection is made at an Automatic Transfer Switch (ATS), located at a mid point of the MCC 7 bus. With this configuration, MCC 7 is, therefore, comprised of a normal power bus and a standby bus. Only equipment that is connected to the standby bus can operate on standby power. The existing ATS is integrated into the existing MCC 7. As such, the transfer switch represents a single point of failure for the electrical distribution system. In the event of a 3 phase short circuit at the ATS, neither utility or generator power can be provided to the Treatment Facility load. In the event of a failure of the transfer switch, there are no existing bypass provisions to maintain power to the standby bus. A new ATS, which includes isolation and bypass provisions, should be considered. CHAPTER III CURRENT SITUATION & NEEDS ASSESSMENT Wastewater Treatment System Facilities Plan CITY OF KIEL Calumet & Manitowoc Counties, Wisconsin Chapter III 13
109 4) Hazardous Locations d. Controls: The digester structure is an National Electric Code (NEC) Classified Hazardous location. As such, all electrical equipment within the hazardous space must comply with NEC requirements for such locations. No electrical switching is permitted within the hazardous space, junction boxes must be approved for the application, and seal fittings must be provided in conduit runs to prevent migration of explosive gases to spaces outside of the hazardous area. The existing electrical equipment in the Digester Building is not compliant with the NEC requirements for classified hazardous locations. The MCC, which contains electrical switching components, must not be located in the hazardous area. An existing pump control panel in the room is noncompliant with hazardous location requirements. Light switches are not to be located in the hazardous area. Existing lights and exit signs are not compliant for hazardous locations. In general, the entire Digester Facility should be electrically reconfigured, and rewired, for full compliance with the hazardous location requirements of NEC Article 500. The existing controls consist of Programmable Logic Controllers (PLC s) in various parts of the Wastewater Treatment Facility. The PLC s are from various manufacturers: Allen Bradley, Siemens and Automation Direct (Koyo). Of these, some are obsolete, in that they are no longer manufactured and there is no Manufacturer s support. Others are classified as active mature by the Manufacturer, which is defined as the product being fully supported, but a newer replacement product or family exists and the mature product will soon start to be phased out. Some controls are provided by vendors with their equipment and contain either stand alone controllers (not a PLC) or consist of hardwired relays. On the front of the Main Control Panel (MCP) are mounted approximately 50 indicator lights, a lighted graphic of the Wastewater Treatment Facility, an alarm annunciator light box and some selector switches. Several sections have plates covering holes from devices that were removed. Most of the items mentioned in the preceding paragraphs are obsolete; either the devices themselves or the technology currently employed. A MCP is located in the Operator Control Room (OCR) in the Administration and Filtration Building. The MCP covers most of one wall, and is both front and rear accessible. CHAPTER III CURRENT SITUATION & NEEDS ASSESSMENT Wastewater Treatment System Facilities Plan CITY OF KIEL Calumet & Manitowoc Counties, Wisconsin Chapter III 14
110 Internally, the MCP contains two (2) PLC s; a Siemens Simatic TI405 PLC, and an Automation Direct 405 PLC with an expansion rack. The output points from these PLC s drive indicator lights and graphic mounted indicators, all of which are mounted on the front of the MCP. It also has eight (8) outputs for triggering inputs to the alarm autodialer. The Wastewater Treatment Facility has an older Public Address (PA) system that annunciates critical alarms by means of a tone. A local telephone is located adjacent to each PA speaker. This system provides coverage for most internal areas of the Treatment Facility. In addition, each Operator carries a City provided cellular telephone, but there are some areas of the Treatment Facility in which these telephones do not have sufficient signal to receive calls. The PLC s input some analog process signals; mostly signals that had been used to drive circular chart recorders. Some MCP mounted selector switches are input to these PLC s, but the MCP is mostly used as a process monitoring tool and collection point for data that is read by the Supervisory Control and Data Acquisition (SCADA) Personal Computer (PC). The MCP also acts as a central communication hub. There is some inter building Ethernet communication over Category 5 copper cable. An Ethernet switch is mounted in the MCP. The switch has eight (8) ports available for connecting copper Ethernet cables. Currently, six (6) of the eight (8) ports are used: 1) Blower Panel PLC 2) Effluent Pumps PLC 3) Automation Direct 405 PLC 4) Siemens Simatic TI405 PLC 5) SCADA PC 6) Hach PC Two (2) PC s are located in the OCR. One (1) PC runs Wonderware SCADA software, which was purchased in The other PC runs Hach Water Information Management Solutions (WIMS) software. The Wonderware SCADA software can only monitor processes that it can communicate with; the Blower Control Panel and the Effluent Pumps Control Panel. The only supervisory control the current SCADA has is partial control of the RAS. Five (5) of the six (6) remote Lift Stations utilize copper telephone lines to communicate with the Wastewater Treatment Facility. This type of line is being phased out by telephone companies, and usually is no longer available for a new communication service. Consideration should be given to upgrading the communication media, as well as the controls for each Lift Station. CHAPTER III CURRENT SITUATION & NEEDS ASSESSMENT Wastewater Treatment System Facilities Plan CITY OF KIEL Calumet & Manitowoc Counties, Wisconsin Chapter III 15
111 C. WPDES PERMIT The Wisconsin Pollutant Discharge Elimination System (WPDES) Permit limits for Kiel are described in Chapter II Water Quality Objectives. Key limits include: BOD 10 mg/l May thru October BOD 15 mg/l November thru April TSS 10 mg/l May thru October TSS 15 mg/l November thru April NH 3 N 5.3 mg/l October thru March NH 3 N 2.2 mg/l April thru May NH 3 N 1.7 mg/l June thru September P 1.0 mg/l Other effluent limits for conventional parameters, such as ph, fecal coliform, chlorine residual, copper and chlorides, match up with conventional limits seen throughout the State. D. WASTEWATER TREATMENT FACILITY FLOWS & LOADINGS Influent flows and loadings for 2012 through 2014 are summarized in Table III 3. Comparing current Wastewater Treatment Facility design criteria to the actual flows and loadings received in 2012, 2013 and 2014, the Facility is overloaded on a regular basis. Table III 3 WASTEWATER TREATMENT FACILITY HISTORICAL INFLUENT FLOWS & LOADINGS CITY OF KIEL WISCONSIN Wastewater Treatment Facility Facilities Plan Current Design Criteria Parameter Influent Flow, mgd Average Maximum Month Maximum Day BOD, mg/l (Average) BOD, lbs./day Average 5,968 6,999 6,741 6,000 Maximum Month 7,863 9,309 8,915 6,280 Maximum Day 12,358 21,337 17,631 9,250 TSS, mg/l (Average) TSS, lbs./day Average 4,042 5,026 4,185 2,842 Maximum Month 5,408 9,224 5,521 4,480 Maximum Day 10,058 48,746 9,518 7,420 Total P, mg/l (Average) Total P, lbs./day Average Maximum Month Maximum Day CHAPTER III CURRENT SITUATION & NEEDS ASSESSMENT Wastewater Treatment System Facilities Plan CITY OF KIEL Calumet & Manitowoc Counties, Wisconsin Chapter III 16
112 Table III 4 illustrates the number of times the design criteria has been exceeded each year. Table III 4 NUMBER OF DAYS EXCEEDING DESIGN CRITERIA CITY OF KIEL WISCONSIN Wastewater Treatment Facility Facilities Plan No. Days Exceed No. Sampling Days No. Days Exceed No. Sampling Days No. Days Exceed No. Sampling Days Parameter Flow Average Maximum Month Maximum Day BOD Average Maximum Month Maximum Day TSS Average Maximum Month Maximum Day Total P Average Maximum Month Maximum Day Historic Wastewater Treatment Facility influent and industrial flows and loadings are summarized on Table III 5. [The remainder of this page was left blank intentionally.] CHAPTER III CURRENT SITUATION & NEEDS ASSESSMENT Wastewater Treatment System Facilities Plan CITY OF KIEL Calumet & Manitowoc Counties, Wisconsin Chapter III 17
113 Table III 5 WASTEWATER TREATMENT FACILITY HISTORICAL INFLUENT & INDUSTRIAL LOADINGS CITY OF KIEL WISCONSIN Wastewater Treatment Facility Facilities Plan Parameter WWTF Total Land O'Lakes Sargento WWTF Total Land O'Lakes Sargento WWTF Total Land O'Lakes Sargento Influent Flow, mgd Average Maximum Month Maximum Day BOD, mg/l (Average) 830 1,241 2, ,357 2, ,119 2,058 BOD, lbs./day Average 5,968 3,163 1,454 6,999 3,434 1,351 6,741 2,800 1,393 Maximum Month 7,863 3,571 2,229 9,309 4,151 2,094 8,915 3,652 2,344 Maximum Day 12,358 8,205 6,235 21,337 13,994 6,107 17,631 8,896 7,708 TSS, mg/l (Average) , , ,352 TSS, lbs./day Average 4, ,533 5, ,170 4, Maximum Month 5, ,190 9, ,023 5, ,259 Maximum Day 10,058 4,237 20,168 48,746 2,365 8,256 9,518 2,919 10,089 Total P, mg/l (Average) Total P, lbs./day Average Maximum Month Maximum Day W:\WP\Facility-Plan\K0015\ \Chapter III - Current Situation & Needs Assessment.docx
114 E. WASTEWATER TREATMENT FACILITY PERFORMANCE The City of Kiel Wastewater Treatment Facility performance for 2012 through 2014 is summarized in Table III 6. The Compliance Maintenance Annual Report (CMAR) for 2014 is contained in Appendix III 3. The report is intended to be a report card for the Wastewater Treatment Facility to highlight specific areas of concern and those concerns that require action to correct. Overall, the City of Kiel Wastewater Treatment Facility scored an A and is in the voluntary range, in which a response is optional. However, based on influent flows and loadings compared to design criteria, the Facility scored an F, as flows and loadings routinely exceeded the design values. Relative to flows and loadings, the Facility is in the Action Range, which requires a response to the DNR; this Facilities Plan satisfies that requirement. While flows and loadings exceeded the design values on a regular basis in 2014, effluent quality was well within the permit limits. This is indicative of a highly motivated Staff with the knowledge and expertise to maximize the efficiency of the individual unit processes. Figures III 7, III 8, III 9 and III 10 graphically illustrate the influent flows and loadings, and compare them to available design parameters. Figure III 11 through Figure III 20 illustrate effluent concentrations and loadings of the various discharge permit parameters, and compare them to the permit limits. F. NEEDS ASSESSMENT 1. General There are three (3) categories of needs at the City of Kiel Wastewater Treatment Facility, which may be broken down as follows: a. Capacity b. Plant Condition c. Permit Requirements Each category and the corresponding needs are described as follows. 2. Capacity Current flows and loadings have been documented in this Chapter. The capacity of the Wastewater Treatment Facility is limited by the capacity of the individual unit processes. Appendix III 4 contains each unit process and its rated capacity, as described in the December 2014 Master Plan, prepared by Donohue & Associates, Inc. A discussion of each unit process and the limitations follows. CHAPTER III CURRENT SITUATION & NEEDS ASSESSMENT Wastewater Treatment System Facilities Plan CITY OF KIEL Calumet & Manitowoc Counties, Wisconsin Chapter III 18
115 Table III 6 WASTEWATER TREATMENT FACILITY PERFORMANCE CITY OF KIEL WISCONSIN Wastewater Treatment Facility Facilities Plan MONTHLY AVERAGE Effluent BOD, mg/l Effluent TSS, mg/l Effluent P, mg/l Effluent Ammonia, mg/l Effluent Copper, µg/l Effluent Chloride, mg/l Month January February March April May June July August September October November December Annual Avg Max. Month # of Violations Monthly Average Limits Effluent BOD 10 mg/l May thru October 15 mg/l November thru April Effluent TSS 10 mg/l May thru October 15 mg/l November thru April Effluent Total P 1 mg/l Effluent NH 3 N 2.2 mg/l April thru May 1.7 mg/l June thru September 5.3 mg/l October thru March W:\WP\Facility-Plan\K0015\ \Chapter III - Current Situation & Needs Assessment.docx
116 3.50 Figure III-7 Monthly Flows (MGD) / City of Kiel Wastewater Treatment Facilities / Facility Plan Flow, MGD Date Max. Avg. Min. Max Day (3.095 MGD) Max Month (1.214 MGD) Average (0.862 MGD) W:\PROJECTS\K0015\950262\00\DMR DATA\From Client\GRAPHS DEG.xlsx 10/29/2015
117 25000 Figure III-8 Monthly BOD (lbs/day) / City of Kiel Wastewater Treatment Facilities / Facility Plan BOD Loading, lbs/day Date Max. Avg. Min. Max Day (9250 lbs/day) Max Month (6280 lbs/day) Average (6000 lbs/day) W:\PROJECTS\K0015\950262\00\DMR DATA\From Client\GRAPHS DEG.xlsx 10/29/2015
118 Figure III-9 Monthly TSS (lbs/day) / City of Kiel Wastewater Treatment Facilities / Facility Plan TSS Loading, lbs/day Date Max. Avg. Min. Max Day (7420 lbs/day) Max Month (4480 lbs/day) Average (2842 lbs/day) W:\PROJECTS\K0015\950262\00\DMR DATA\From Client\GRAPHS DEG.xlsx 10/29/2015
119 Figure III-10 Monthly Total Phosphorus (lbs/day) / City of Kiel Wastewater Treatment Facilities / Facility Plan Total Phosphorus Loading, lbs/day Date Max. Avg. Min. Max Day (247 lbs/day) Max Month (184 lbs/day) Average (145 lbs/day) W:\PROJECTS\K0015\950262\00\DMR DATA\From Client\GRAPHS DEG.xlsx 10/29/2015
120 16.00 Figure III-11 Weekly Average Effluent BOD (mg/l) / City of Kiel Wastewater Treatment Facilities / Facility Plan Weekly Ave Effluent BOD, mg/l NOTE: Weekly Average Effluent BOD Limits: May through October = 10 mg/l November through April = 15 mg/l Date Effluent BOD Weekly Ave. Effluent BOD Limit W:\PROJECTS\K0015\950262\00\DMR DATA\From Client\Effluent Loading Graphs - DEG.xls 10/29/2015
121 250 Figure III-12 Weekly Average Effluent BOD (lbs/day) / City of Kiel Wastewater Treatment Facilities / Facility Plan 200 Weekly Ave Effluent BOD, lbs/day NOTE: Weekly Average Effluent BOD Limits: May through October = 72 lbs/day November through April = 108 lbs/day Date Effluent BOD Weekly Ave Effluent BOD Limit W:\PROJECTS\K0015\950262\00\DMR DATA\From Client\Effluent Loading Graphs - DEG.xls 10/29/2015
122 16.00 Figure III-13 Monthly Average Effluent BOD (mg/l) / City of Kiel Wastewater Treatment Facilities / Facility Plan Monthly Ave Effluent BOD, mg/l NOTE: Monthly Average Effluent BOD Limits: May through October = 10 mg/l November through April = 15 mg/l Date Effluent BOD Monthly Ave Effluent BOD Limit W:\PROJECTS\K0015\950262\00\DMR DATA\From Client\Effluent Loading Graphs DEG.xls 10/29/2015
123 16.00 Figure III-14 Weekly Average Effluent TSS (mg/l) / City of Kiel Wastewater Treatment Facilities / Facility Plan Weekly Ave Effluent TSS, mg/l NOTE: Weekly Average Effluent TSS Limits: May through October = 10 mg/l November through April = 15 mg/l Date Effluent TSS Weekly Ave Effluent TSS Limit W:\PROJECTS\K0015\950262\00\DMR DATA\From Client\Effluent Loading Graphs DEG.xls 10/29/2015
124 16.00 Figure III-15 Monthly Average Effluent TSS (mg/l) / City of Kiel Wastewater Treatment Facilities / Facility Plan Monthly Ave Effluent TSS, mg/l NOTE: Monthly Average Effluent TSS Limits: May through October = 10 mg/l November through April = 15 mg/l Date Effluent TSS Monthly Ave Effluent TSS Limit W:\PROJECTS\K0015\950262\00\DMR DATA\From Client\Effluent Loading Graphs DEG.xls 10/29/2015
125 1.20 Figure III-16 Monthly Average Effluent Total P (mg/l) / City of Kiel Wastewater Treatment Facilities / Facility Plan 1.00 Monthly Ave Effluent Total P, mg/l Date Effluent Total P Monthly Ave Effluent Total P Limit = 1.0 mg/l W:\PROJECTS\K0015\950262\00\DMR DATA\From Client\Effluent Loading Graphs DEG.xls 10/29/2015
126 Figure III-17 Monthly Average Effluent Ammonia (mg/l) / City of Kiel Wastewater Treatment Facilities / Facility Plan 6.00 Monthly Ave Effluent Ammonia, mg/l NOTE: Monthly Average Effluent NH3-N Limits: April through May = 2.2 mg/l June through September = 1.7 mg/l October through March = 5.3 mg/l Date Effluent Ammonia Monthly Ave Effluent NH3-N Limit W:\PROJECTS\K0015\950262\00\DMR DATA\From Client\Effluent Loading Graphs DEG.xls 10/29/2015
127 6.00 Figure III-18 Weekly Average Effluent Ammonia (mg/l) / City of Kiel Wastewater Treatment Facilities / Facility Plan 5.00 Weekly Ave Effluent Ammonia, mg/l NOTE: Weekly Average Effluent Ammonia Limits: April through May = 5.2 mg/l June through September = 3.7 mg/l Date Effluent Ammonia Weekly Ave. Effluent NH3-N Limit W:\PROJECTS\K0015\950262\00\DMR DATA\From Client\Effluent Loading Graphs DEG.xls 10/29/2015
128 12.00 Figure III-19 Max Day Effluent Ammonia (mg/l) / City of Kiel Wastewater Treatment Facilities / Facility Plan Effluent Ammonia, mg/l Date Effluent Ammonia W:\PROJECTS\K0015\950262\00\DMR DATA\From Client\Effluent Loading Graphs DEG.xls 10/29/2015
129 50.00 Figure III-20 Weekly Average Effluent Copper (µg/l) / City of Kiel Wastewater Treatment Facilities / Facility Plan Weekly Ave Effluent Copper, µg/l Date Effluent Copper Weekly Ave Effluent Copper Limit = 39 ug/l W:\PROJECTS\K0015\950262\00\DMR DATA\From Client\Effluent Loading Graphs DEG.xls 10/29/2015
130 The River Road Pump Station has a firm capacity of 2.42 mgd, with one (1) pump out of service. The peak hour design value is 4.26 mgd, which exceeds the firm capacity of the Pump Station. NR 110 of the Administrative Code requires a firm capacity of 4.26 mgd. Therefore, additional capacity is required. The screening system has a firm capacity of 4.30 mgd, which exceeds the peak hour design flow of The aerated grit system has a peak hour design flow rate of 6.2 mgd, which results in a Hydraulic Retention Time (HRT) of 3.0 minutes. NR 110 requires an HRT of 3 minutes or less, at the design peak hour flow rate. NR 110 requires primary clarifiers to have a surface overflow rate of 1,000 gpd/sq.ft. at the design average flow rate. This results in an average design flow capacity of 1.23 mgd for the primary clarifiers. The 16 inch piping from the primary clarifiers to the aeration system splitter box is a hydraulic bottleneck, which limits forward flow to approximately 2 mgd. Additional capacity should be provided to eliminate the restriction. During periods of high Biochemical Oxygen Demand (BOD) loadings, the aeration system experiences episodes of low Dissolved Oxygen (DO). The aeration system has been re rated to allow a loading rate of 23.5 lbs. BOD/1,000 cu.ft. of basin volume, yielding a capacity of 4,970 lbs. BOD/day. Typical loadings exceed this value on a regular basis. In addition to requiring more tank volume, upgrading the blower system and/or air diffuser system to provide more oxygen will be necessary to achieve desired DO levels. The aeration blowers have a firm capacity of 5,880 scfm with one (1) large blower out of service. 4,227 scfm is required for mixing, per NR 110, and does not govern the air requirement when compared to the oxygen demand. The piping between the aeration system and the final clarifiers is 16 inch diameter, and is hydraulic limiting during periods of high flows. Additional capacity is required to remove this restriction. NR 110 limits the peak hour design surface settling rate to 1,000 gpd/sq.ft., which results in a final clarifier capacity of 2.51 mgd. This flow rate is exceeded during periods of high flows. Additionally, NR 110 limits the average design and peak hour solids loading rate to 1.2 and 2.0 lbs./sq.ft./hour, respectively. The resultant capacities of the final clarifiers are, therefore, 28.8 and 48.0 lbs./sq.ft./hour (average design and peak hour, respectively). The current loading rates are 25.4 lbs./sq.ft./hour (average) and 55.7 lbs./sq.ft./hour. The peak hour loading rate is in excess of the allowable 48.0 value, per NR 110. Although two (2) final clarifiers are utilized, the redundancy is ineffective, as the effluent quality deteriorates significantly with one (1) clarifier out of service. Additional clarifier capacity is required. CHAPTER III CURRENT SITUATION & NEEDS ASSESSMENT Wastewater Treatment System Facilities Plan CITY OF KIEL Calumet & Manitowoc Counties, Wisconsin Chapter III 19
131 The firm capacity of the RAS pumping system is mgd, with one (1) of two (2) pumps out of service. The NR 110 requirement is 1.72 mgd. NR 110 requires a peak hour design filtration rate of 5 gpm/sq.ft., or less, with one (1) cell out of service. This results in a firm capacity of mgd. However, the capacity of the filters with all cells in use is 2.0 mgd, based on actual operating experience. Maximum day flows exceed this value. The filters are in need of maintenance/repairs and are not suited to achieve low phosphorus limits; consideration should be given to upgrading to higher capacity cloth/mesh type filters. The chlorine contact chamber has an average design capacity of 1.26 mgd, based on an HRT of 60 minutes; the peak hour design capacity is 2.53 mgd based on an NR 110 requirement of an HRT of 30 minutes. With only one (1) primary digester that is heated and mixed, on a volumetric basis the anaerobic digestion system has a capacity of 17,977 gpd per the NR 110 requirement of a 15 day HRT. From a solids loading perspective, the capacity is 2,884 lbs. Volatile Suspended Solids (VSS)/day, based on the NR 110 loading rate of 80 lbs. VSS/1,000 cu.ft. The sludge dewatering system is limited to the throughput capacity of the sole belt press, which is 125 gpm and 1,000 lbs. TSS/hour. The Class A pasteurization system has a capacity of 800 lbs. TSS/hour. The Cake Storage Facility has a capacity of 111,120 cu.ft. with a stack height of 12 feet, which exceeds the Administrative Code requirement of 180 days of storage (29,160 cu.ft.). 3. Wastewater Treatment Facility Condition Originally built in 1965, the Wastewater Treatment Facility has been upgraded numerous times and 1985 Phase I and Phase II upgrades resulted in the major treatment systems currently in use today. These upgrades were followed by Headworks additions in 1996, and aeration and sludge handling modifications in Lastly, aeration system upgrades in 2008 and conversion to enhanced Bio P in 2012 resulted in the current treatment works. As such, there are buildings, pipes, tanks and treatment systems that date back 50 years. In general terms, the following needs have been identified: a. General 1) Instrumentation and controls (flow meters, etc.) 2) SCADA, control systems 3) Administration Building HVAC system CHAPTER III CURRENT SITUATION & NEEDS ASSESSMENT Wastewater Treatment System Facilities Plan CITY OF KIEL Calumet & Manitowoc Counties, Wisconsin Chapter III 20
132 4) Laboratory countertops 5) Storage, maintenance space, vehicle storage b. Headworks (Preliminary Treatment) 1) Address Class I, Division 1 compliance 2) Replace aerated grit system 3) Replace grit classifier c. Primary Clarifiers 1) Repair structural cracks 2) Replace mechanisms and drives 3) Replace weirs and baffles 4) Address influent flow splitting 5) Provide dedicated / redundant positive displacement sludge pumps d. Aeration System 1) Consider tying RAS pipe into the primary effluent line to facilitate mixing 2) Replace buried air main with new overhead air main 3) Provide new DO / ph ORP monitoring 4) Structural repair of spalled / cracked concrete, railings 5) Replace weir gates 6) Address flow splitting at splitter box e. Final Clarifiers 1) Address flow splitting at splitter box 2) Provide redundant RAS and WAS pumps 3) Consider replacing Fiberglass Reinforced Plastic (FRP) domes 4) Replace mechanisms and drives 5) Replace weirs and baffles f. Tertiary Sand Filters 1) Repair steel components 2) Upgrade controls 3) Replace valves g. Disinfection System 1) Repair / replace two (2) leaking gates CHAPTER III CURRENT SITUATION & NEEDS ASSESSMENT Wastewater Treatment System Facilities Plan CITY OF KIEL Calumet & Manitowoc Counties, Wisconsin Chapter III 21
133 h. Post Aeration System 1) Repair / modify step at walkway i. High Strength Waste Tank 1) Provide screening system 2) Consider addition of an automated card reader for high strength waste / septage / grease 3) Provide a separate grease tank and pump system to feed directly to digester j. Digesters 1) Consider thickening WAS 2) Optimize use of biogas 3) Replace covers on both digesters 4) Replace mixing system and add mixing to secondary digester 5) Replace pumps and provide redundancy 6) Replace boiler / heat exchanger 7) Address Class I, Division 1 compliance 8) Relocate flare 9) Relocate condensate drain in Service Building 10) Address structural cracks and brick maintenance; consider insulated metal panels 11) Replace instrumentation k. Sludge Dewatering 1) Replace belt press with new redundant dewatering system 2) Consider alternatives to pasteurization to achieve Class A biosolids 3) Provide additional lime / fly ash storage 4) Replace dump truck utilized to transport sludge with larger capacity vehicle l. Electrical 1) Implement electrical utility service improvements. 2) Provide new main electrical service equipment with a short circuiting rating of 65 ka. 3) Demolish and replace existing, obsolete MCC s. 4) Resolve non compliance in Classified Hazardous Locations: a) Remove electrical equipment from the Digester Building that is not Underwriters Laboratories (UL) approved for hazardous locations. CHAPTER III CURRENT SITUATION & NEEDS ASSESSMENT Wastewater Treatment System Facilities Plan CITY OF KIEL Calumet & Manitowoc Counties, Wisconsin Chapter III 22
134 b) Provide new electrical equipment in hazardous locations that is ULapproved for hazardous locations. c) Locate new electrical equipment intended for ordinary locations, so it is outside of classified hazardous atmosphere. d) Provide new MCC 3, to replace existing MCC 3, in the Digester Building. Locate new MCC 3 in a new, non hazardous location in the digester complex. 5) Provide new electrical distribution equipment, as required, to support the Wastewater Treatment Facility process improvements. m. Controls Needs Parts of the existing controls are old technology, and should be upgraded to take advantage of the operational tools available with new controllers and SCADA. Some of the existing PLC s are no longer manufactured, and support for them is becoming less and less available. In view of this, the following needs have been identified: 1) Communications: a) Install a redundant fiber optic cable between all Treatment Facility buildings. b) Install a secure firewall with remote access capability via a VPN (Virtual Private Network). c) Allow vendors limited remote access for equipment support via a VPN. d) Install Ethernet switches to connect fiber optic control network to individual building control networks. 2) Programmable Logic Controllers (PLC s): a) Standardize on a PLC from a specific Manufacturer. b) Replace obsolete PLC s with current technology PLC s. c) Formulate plan to replace mature active PLC s. d) Require new equipment vendors whose equipment needs a PLC for control to provide a PLC from the selected standard Manufacturer. e) Each control panel with a PLC to have an Operator Interface Terminal (OIT) and an Ethernet managed switch. 3) Alarming: a) Control panels containing a PLC to have an alarm horn for annunciating alarms occurring in its area. Alarm horn is silenced when the local Alarm Silence pushbutton is pressed or the alarm is acknowledged at the SCADA. b) OIT s to display alarms generated by the PLC in its control panel and allows the Operator to acknowledge the alarm locally. CHAPTER III CURRENT SITUATION & NEEDS ASSESSMENT Wastewater Treatment System Facilities Plan CITY OF KIEL Calumet & Manitowoc Counties, Wisconsin Chapter III 23
135 c) SCADA also annunciates alarms and retains alarm status. If the alarm is acknowledged at the local OIT, the SCADA alarm is also acknowledged. All alarms logged to its Historian. d) Alarms detected by the SCADA are also annunciated via WIN911 alarm notification software. SCADA shall have a screen that allows the Operator to inhibit individual alarms from being annunciated by WIN911. 4) Supervisory Control & Data Acquisition (SCADA): a) Two (2) PC s; one (1) designated as the Primary, and one (1) designated as the Secondary. (1) Secondary PC acts as a hot backup to the Primary PC, directly connected via a cross over Ethernet cable. (2) WIN911 alarm notification software and the Historian reside on the Primary PC. (3) Both PC s to have two (2) solid state drives with RAID 1 mirrored array configuration. (4) Large screen monitor that can display screens from either PC. In addition to the above items, the existing MCP in the Operator Control Room should be demolished and a wall put in its place. Any required communication equipment or PLC that would be required to support Wastewater Treatment Facility control functions in the OCR would be housed in a considerably smaller panel. The space gained could be put to other uses. Putting a window in this wall and mounting the large screen monitor on the opposite wall will allow the Operator to assess Treatment Facility operation during a walk by. 4. Permit Requirements The City of Kiel Wastewater Treatment Facility operates under Wisconsin Pollutant Discharge Elimination System (WPDES) Permit No. WI This permit, like many others throughout the State of Wisconsin, is expired. The Wisconsin Department of Natural Resources (DNR) anticipates issuing new permits on a watershed wide basis in the near future. A copy of the expired permit, which regulates the Kiel Wastewater Treatment Facility, was located in Chapter II Appendix II 1. In anticipation of permit issuance, the DNR has issued a Memorandum regarding Water Quality Based Effluent Limitations (WQBEL) for the Kiel Wastewater Treatment Facility, dated September 30, A copy of the Memorandum was located in Chapter II Appendix II 2. The purpose of the Memorandum is to provide calculated water quality based effluent limitations for the Kiel Wastewater Treatment Facility discharge into the Sheboygan River. CHAPTER III CURRENT SITUATION & NEEDS ASSESSMENT Wastewater Treatment System Facilities Plan CITY OF KIEL Calumet & Manitowoc Counties, Wisconsin Chapter III 24
136 Key changes to the Kiel discharge permit being considered by the DNR include: a. Temperature Limits (September April) b. Total Phosphorus Limits 1) 0.1 mg/l (May October) 2) 0.3 mg/l (November April) c. Chlorides, 460 mg/l d. Ammonia, 6.7 mg/l daily maximum e. Dissolved Oxygen (DO), 7.0 mg/l (July September) f. Biochemical Oxygen Demand (BOD) 1) 8.9 mg/l (June) 2) 9.5 mg/l (July) 3) 8.7 mg/l (August) 4) 9.9 mg/l (September) 5) 9.3 mg/l (October) g. Total Suspended Solids (TSS) 1) 8.9 mg/l (June) 2) 9.5 mg/l (July) 3) 8.7 mg/l (August) 4) 9.9 mg/l (September) 5) 9.3 mg/l (October) W:\WP\Facility-Plan\K0015\950262\Chapter III - Current Situation & Needs Assessment.docx CHAPTER III CURRENT SITUATION & NEEDS ASSESSMENT Wastewater Treatment System Facilities Plan CITY OF KIEL Calumet & Manitowoc Counties, Wisconsin Chapter III 25
137 APPENDIX III 1 WISCONSIN DEPARTMENT OF NATURAL RESOURCES (DNR) ENDANGERED RESOURCES PRELIMINARY ASSESSMENT
138
139
140 APPENDIX III 2 WISCONSIN DEPARTMENT OF NATURAL RESOURCES (DNR) ARCHAEOLOGICAL / HISTORICAL SIGNIFICANCE RESPONSE


141


142
143 APPENDIX III 3 COMPLIANCE MAINTENANCE ANNUAL REPORT (CMAR) 2014
144 Compliance Maintenance Annual Report Kiel Wastewater Treatment Facility Last Updated: Reporting For: 7/23/ Influent Flow and Loading 1. Monthly Average Flows and (C)BOD Loadings 1.1 Verify the following monthly flows and (C)BOD loadings to your facility. Outfall No. 701 Influent Monthly Average Flow, MGD x Influent Monthly Average (C)BOD Concentration mg/l x 8.34 = Influent Monthly Average (C)BOD Loading, lbs/day January x 1,244 x 8.34 = 6,895 February x 1,128 x 8.34 = 6,736 March x 707 x 8.34 = 5,146 April x 655 x 8.34 = 7,066 May x 642 x 8.34 = 6,897 June x 582 x 8.34 = 8,384 July x 631 x 8.34 = 6,111 August x 810 x 8.34 = 6,688 September x 868 x 8.34 = 6,300 October x 988 x 8.34 = 7,223 November x 1,253 x 8.34 = 8,615 December x 861 x 8.34 = 6, Maximum Month Design Flow and Design (C)BOD Loading 2.1 Verify the design flow and loading for your facility. Design Design Factor x % = % of Design Max Month Design Flow, MGD x 90 = x 100 = Design (C)BOD, lbs/day 6000 x 90 = 5400 x 100 = Verify the number of times the flow and (C)BOD exceeded 90% or 100% of design, points earned, and score: Months of Influent Number of times flow was greater than 90% of Number of times flow was greater than 100% of Number of times (C)BOD was greater than 90% of design Number of times (C)BOD was greater than 100% of design January February March April May June July August September October November December Points per each Exceedances Points Total Number of Points 66 66
145 Compliance Maintenance Annual Report Kiel Wastewater Treatment Facility Last Updated: Reporting For: 7/23/ Flow Meter 3.1 Was the influent flow meter calibrated in the last year? Yes Enter last calibration date (MM/DD/YYYY) No If No, please explain: 4. Sewer Use Ordinance 4.1 Did your community have a sewer use ordinance that limited or prohibited the discharge of excessive conventional pollutants ((C)BOD, SS, or ph) or toxic substances to the sewer from industries, commercial users, hauled waste, or residences? Yes No If No, please explain: 4.2 Was it necessary to enforce the ordinance? Yes No If Yes, please explain: 5. Septage Receiving 5.1 Did you have requests to receive septage at your facility? Septic Tanks Holding Tanks Grease Traps Yes Yes Yes No No No 5.2 Did you receive septage at your faclity? If yes, indicate volume in gallons. Septic Tanks Yes 1,126,916 gallons No Holding Tanks Yes 30,080,550 gallons No Grease Traps Yes 230,695 gallons No If yes to any of the above, please explain if plant performance is affected when receiving any of these wastes. No plant issues recieving the above mentioned wastes. 6. Pretreatment 6.1 Did your facility experience operational problems, permit violations, biosolids quality concerns, or hazardous situations in the sewer system or treatment plant that were attributable to commercial or industrial discharges in the last year? Yes No If yes, describe the situation and your community's response. 6.2 Did your facility accept hauled industrial wastes, landfill leachate, etc.? Yes
146 Compliance Maintenance Annual Report Kiel Wastewater Treatment Facility Last Updated: Reporting For: 7/23/ No If yes, describe the types of wastes received and any procedures or other restrictions that were in place to protect the facility from the discharge of hauled industrial wastes. Dairy wash water waste from cheese plant. Waste placed in recieving basin and time paced into head works. Total Points Generated 66 Score (100 - Total Points Generated) 34 Section Grade F
147 Compliance Maintenance Annual Report Kiel Wastewater Treatment Facility Last Updated: Reporting For: 7/23/ Effluent Quality and Plant Performance (BOD/CBOD) 1. Effluent (C)BOD Results 1.1 Verify the following monthly average effluent values, exceedances, and points for BOD or CBOD Outfall No. 001 Monthly Average Limit (mg/l) 90% of Permit Limit > 10 (mg/l) Effluent Monthly Average (mg/l) Months of Discharge with a Limit Permit Limit Exceedance 90% Permit Limit Exceedance January February March April May June July August September October November December * Equals limit if limit is <= 10 Months of discharge/yr 12 Points per each exceedance with 12 months of discharge 7 3 Exceedances 0 0 Points 0 0 Total number of points 0 NOTE: For systems that discharge intermittently to state waters, the points per monthly exceedance for this section shall be based upon a multiplication factor of 12 months divided by the number of months of discharge. Example: For a wastewater facility discharging only 6 months of the year, the multiplication factor is 12/6 = If any violations occurred, what action was taken to regain compliance? 0 2. Flow Meter Calibration 2.1 Was the effluent flow meter calibrated in the last year? Yes Enter last calibration date (MM/DD/YYYY) No If No, please explain: 3. Treatment Problems 3.1 What problems, if any, were experienced over the last year that threatened treatment? No problems experienced with treatment. 4. Other Monitoring and Limits 4.1 At any time in the past year was there an exceedance of a permit limit for any other pollutants such as chlorides, ph, residual chlorine, fecal coliform, or metals? Yes No If Yes, please explain:
148 Compliance Maintenance Annual Report Kiel Wastewater Treatment Facility Last Updated: Reporting For: 7/23/ At any time in the past year was there a failure of an effluent acute or chronic whole effluent toxicity (WET) test? Yes No If Yes, please explain: 4.3 If the biomonitoring (WET) test did not pass, were steps taken to identify and/or reduce source(s) of toxicity? Yes No N/A Please explain unless not applicable: Total Points Generated 0 Score (100 - Total Points Generated) 100 Section Grade A
149 Compliance Maintenance Annual Report Kiel Wastewater Treatment Facility Last Updated: Reporting For: 7/23/ Effluent Quality and Plant Performance (Total Suspended Solids) 1. Effluent Total Suspended Solids Results 1.1 Verify the following monthly average effluent values, exceedances, and points for TSS: Outfall No. 001 Monthly Average Limit (mg/l) 90% of Permit Limit >10 (mg/l) Effluent Monthly Average (mg/l) Months of Discharge with a Limit Permit Limit Exceedance 90% Permit Limit Exceedance January February March April May June July August September October November December * Equals limit if limit is <= 10 Months of Discharge/yr 12 Points per each exceedance with 12 months of discharge: 7 3 Exceedances 0 0 Points 0 0 Total Number of Points 0 NOTE: For systems that discharge intermittently to state waters, the points per monthly exceedance for this section shall be based upon a multiplication factor of 12 months divided by the number of months of discharge. Example: For a wastewater facility discharging only 6 months of the year, the multiplication factor is 12/6 = If any violations occurred, what action was taken to regain compliance? 0 Total Points Generated 0 Score (100 - Total Points Generated) 100 Section Grade A
150 Compliance Maintenance Annual Report Kiel Wastewater Treatment Facility Last Updated: Reporting For: 7/23/ Effluent Quality and Plant Performance (Ammonia - NH3) 1. Effluent Ammonia Results 1.1 Verify the following monthly and weekly average effluent values, exceedances and points for NH3 Outfall No. 001 Monthly Average NH3 Limit (mg/l) Weekly Average NH3 Limit (mg/l) Effluent Monthly Average NH3 (mg/l) Monthly Permit Limit Exceed ance Effluent Weekly Average for Week 1 Effluent Weekly Average for Week 2 Effluent Weekly Average for Week 3 Effluent Weekly Average for Week 4 Weekly Permit Limit Exceed ance January February March April May June July August September October November December Points per each exceedance of Monthly average: 10 Exceedances, Monthly: 0 Points: 0 Points per each exceedance of weekly average (when there is no monthly averge): 2.5 Exceedances, Weekly: 0 Points: 0 Total Number of Points 0 NOTE: Limit exceedances are considered for mothly OR weekly averages but not both. When a monthly average limit exists it will be used to detect exceedances and generate points. This will be true even if a weekly limit also exists. When a weekly average limit exists and a monthly limit does not exist, the weekly limit will be used to detect exceedances and gernate points. 1.2 If any violations occurred, what action was taken to regain compliance? 0 Total Points Generated 0 Score (100 - Total Points Generated) 100 Section Grade A
151 Compliance Maintenance Annual Report Kiel Wastewater Treatment Facility Last Updated: Reporting For: 7/23/ Effluent Quality and Plant Performance (Phosphorus) 1. Effluent Phosphorus Results 1.1 Verify the following monthly average effluent values, exceedances, and points for Phosphorus Outfall No. 001 Monthly Average phosphorus Limit (mg/l) Effluent Monthly Average phosphorus (mg/l) Months of Discharge with a Limit Permit Limit Exceedance January February March April May June July August September October November December Months of Discharge/yr 12 Points per each exceedance with 12 months of discharge: 10 Exceedances 0 Total Number of Points 0 NOTE: For systems that discharge intermittently to waters of the state, the points per monthly exceedance for this section shall be based upon a multiplication factor of 12 months divided by the number of months of discharge. Example: For a wastewater facility discharging only 6 months of the year, the multiplication factor is 12/6 = If any violations occurred, what action was taken to regain compliance? 0 Total Points Generated 0 Score (100 - Total Points Generated) 100 Section Grade A
152 Compliance Maintenance Annual Report Kiel Wastewater Treatment Facility Last Updated: Reporting For: 7/23/ Biosolids Quality and Management 1. Biosolids Use/Disposal 1.1 How did you use or dispose of your biosolids? (Check all that apply) Land applied under your permit Publicly Distributed Exceptional Quality Biosolids Hauled to another permitted facility Landfilled Incinerated Other NOTE: If you did not remove biosolids from your system, please describe your system type such as lagoons, reed beds, recirculating sand filters, etc If you checked Other, please describe: 3. Biosolids Metals Number of biosolids outfalls in your WPDES permit: 3.1 For each outfall tested, verify the biosolids metal quality values for your facility during the last calendar year. Outfall No Cake Sludge Parameter 80% of Limit H.Q. Limit Ceiling Limit Jan Feb Mar Apr May Jun Jul Aug Sep Oct Nov Dec 80% Value High Ceiling Quality Arsenic Cadmium Copper Lead Mercury Molybdenum Nickel Selenium Zinc Number of times any of the metals exceeded the high quality limits OR 80% of the limit for molybdenum, nickel, or selenium = 0 Exceedence Points 0 (0 Points) 1-2 (10 Points) > 2 (15 Points) If you exceeded the high quality limits, did you cumulatively track the metals loading at each land application site? (check applicable box) Yes No (10 points) N/A - Did not exceed limits or no HQ limit applies (0 points) N/A - Did not land apply biosolids until limit was met (0 points) Number of times any of the metals exceeded the ceiling limits = 0 Exceedence Points 0 (0 Points) 1 (10 Points) > 1 (15 Points) Were biosolids land applied which exceeded the ceiling limit? Yes (20 Points) No (0 Points)
153 Compliance Maintenance Annual Report Kiel Wastewater Treatment Facility Last Updated: Reporting For: 7/23/ If any metal limit (high quality or ceiling) was exceeded at any time, what action was taken? Has the source of the metals been identified? 0 4. Pathogen Control (per outfall): 4.1 Verify the following information. If any information is incorrect, Contact Us. Outfall Number: 004 Biosolids Class: Bacteria Type and Limit: Sample Dates: 01/01/ /31/2014 Density: 4 Sample Concentration Amount: Requirement Met: Land Applied: Process: Process Description: MPN/G TS Yes No PSTZN Sludge Truck Outfall Number: 004 Biosolids Class: Bacteria Type and Limit: Sample Dates: 01/01/ /31/2014 Density: 4 Sample Concentration Amount: Requirement Met: Land Applied: Process: Process Description: MPN/G TS Yes No PSTZN Sludge Storage Building Outfall Number: 004 Biosolids Class: Bacteria Type and Limit: Sample Dates: 04/01/ /30/2014 Density: 3 Sample Concentration Amount: Requirement Met: Land Applied: Process: Process Description: MPN/G TS Yes Yes PSTZN Sludge Storage Building A F A F A F
154 Compliance Maintenance Annual Report Kiel Wastewater Treatment Facility Last Updated: Reporting For: 7/23/ Outfall Number: 004 Biosolids Class: Bacteria Type and Limit: Sample Dates: 04/01/ /30/2014 Density: 4 Sample Concentration Amount: Requirement Met: Land Applied: Process: Process Description: MPN/G TS Yes Yes PSTZN Sludge Truck Outfall Number: 004 Biosolids Class: Bacteria Type and Limit: Sample Dates: 07/01/ /30/2014 Density: 5 Sample Concentration Amount: Requirement Met: Land Applied: Process: Process Description: MPN/G TS Yes No PSTZN Sludge Truck Outfall Number: 004 Biosolids Class: Bacteria Type and Limit: Sample Dates: 07/01/ /30/2014 Density: 5 Sample Concentration Amount: Requirement Met: Land Applied: Process: Process Description: MPN/G TS Yes No PSTZN Sludge Storage Building Outfall Number: 004 Biosolids Class: Bacteria Type and Limit: Sample Dates: 10/01/ /31/2014 Density: 5 Sample Concentration Amount: Requirement Met: Land Applied: Process: Process Description: MPN/G TS Yes Yes PSTZN Sludge Storage Building A F A F A F A F
155 Compliance Maintenance Annual Report Kiel Wastewater Treatment Facility Last Updated: Reporting For: 7/23/ Outfall Number: 004 Biosolids Class: A Bacteria Type and Limit: F Sample Dates: 10/01/ /31/2014 Density: 5 Sample Concentration Amount: MPN/G TS Requirement Met: Yes Land Applied: Yes Process: PSTZN Process Description: Sludge Truck If exceeded Class B limit or did not meet the process criteria at the time of land application Was the limit exceeded or the process criteria not met at the time of land application? Yes (40 Points) No If yes, what action was taken? 5. Vector Attraction Reduction (per outfall): 5.1 Verify the following information. If any of the information is incorrect, Contact Us. Outfall Number: 004 Method Date: 03/31/2014 Option Used To Satisfy Requirement: Requirement Met: Land Applied: Limit (if applicable): Results (if applicable): Yes No PHADJ Outfall Number: 004 Method Date: 06/30/2014 Option Used To Satisfy Requirement: PHADJ Requirement Met: Yes Land Applied: Yes Limit (if applicable): Results (if applicable): Outfall Number: 004 Method Date: 09/30/2014 Option Used To Satisfy Requirement: PHADJ Requirement Met: Yes Land Applied: No Limit (if applicable): Results (if applicable):
156 Compliance Maintenance Annual Report Kiel Wastewater Treatment Facility Last Updated: Reporting For: 7/23/ Outfall Number: 004 Method Date: 12/31/2014 Option Used To Satisfy Requirement: PHADJ Requirement Met: Yes Land Applied: Yes Limit (if applicable): Results (if applicable): Was the limit exceeded or the process criteria not met at the time of land application? Yes (40 Points) No If yes, what action was taken? 6. Biosolids Storage 6.1 How many days of actual, current biosolids storage capacity did your wastewater treatment facility have either on-site or off-site? >= 180 days (0 Points) days (10 Points) days (20 Points) days (30 Points) < 90 days (40 Points) N/A (0 Points) 6.2 If you checked N/A above, explain why Issues 7.1 Describe any outstanding biosolids issues with treatment, use or overall management: BNR sludge harder to dewater causing longer run times on biosolids process. Total Points Generated 0 Score (100 - Total Points Generated) 100 Section Grade A
157 Compliance Maintenance Annual Report Kiel Wastewater Treatment Facility Last Updated: Reporting For: 7/23/ Staffing and Preventative Maintenance (All Treatment Plants) 1. Plant Staffing 1.1 Was your wastewater treatment plant adequately staffed last year? Yes No If No, please explain: Could use more help/staff for: 1.2 Did your wastewater staff have adequate time to properly operate and maintain the plant and fulfill all wastewater management tasks including recordkeeping? Yes No If No, please explain: 2. Preventative Maintenance 2.1 Did your plant have a documented AND implemented plan for preventative maintenance on major equipment items? Yes (Continue with question 2) No (40 points) If No, please explain, then go to question 3: 2.2 Did this preventative maintenance program depict frequency of intervals, types of lubrication, and other tasks necessary for each piece of equipment? Yes No (10 points) 2.3 Were these preventative maintenance tasks, as well as major equipment repairs, recorded and filed so future maintenance problems can be assessed properly? Yes Paper file system Computer system Both paper and computer system No (10 points) 3. O&M Manual 3.1 Does your plant have a detailed O&M Manual that can be used as a reference when needed? Yes No 4. Overall Maintenance /Repairs 4.1 Rate the overall maintenance of your wastewater plant. Excellent Very good Good Fair Poor Describe your rating: The rating is very good. We are always busy preforming maintenance and that is due to age of plant so at this time excellent maintenance can not be met. 0
158 Compliance Maintenance Annual Report Kiel Wastewater Treatment Facility Last Updated: Reporting For: 7/23/ Total Points Generated 0 Score (100 - Total Points Generated) 100 Section Grade A
159 Compliance Maintenance Annual Report Kiel Wastewater Treatment Facility Last Updated: Reporting For: 7/23/ Operator Certification and Education 1. Operator-In-Charge 1.1 Did you have a designated operator-in-charge during the report year? Yes (0 points) No (20 points) Name: KRIS A AUGUST Certification No: Certification Requirements 2.1 In accordance with Chapter NR and , Wisconsin Administrative Code, what grade and subclass(es) were required for the operator-in-charge to operate the wastewater treatment plant and what grade and subclass(es) were held by the operator-in-charge? Required: 4 - ACEFGHIJ; A - PRIMARY SETTLING; C - ACTIVATED SLUDGE; E - DISINFECTION; F - ANAEROBIC DIGESTION; G - MECHANICAL SLUDGE; H - FILTRATION; I - PHOSPHORUS REMOVAL; J - LABORATORY Held: 4 - ACEFGHIJ; 4 - A=PRIMARY SETTLING GRADE 4; C=ACTIVATED SLUDGE GRADE 4; E=DISINFECTION GRADE 4; F=ANAEROBIC DIGESTION GRADE 4; G=MECHANICAL SLUDGE GRADE 4; H=FILTRATION GRADE 4; I=PHOSPHORUS REMOVAL GRADE 4; J=LABORATORY GRADE Was the operator-in-charge certified at the appropriate level to operate this plant? Yes (0 points) No (20 points) 3. Succession Planning 3.1 In the event of the loss of your designated operator-in-charge, did you have a contingency plan to ensure the continued proper operation and maintenance of the plant that includes one or more of the following options (check all that apply)? One or more additional certified operators on staff An arrangement with another certified operator An arrangement with another community with a certified operator An operator on staff who has an operator-in-training certificate for your plant and is expected to be certified within one year A consultant to serve as your certified operator None of the above (20 points) If "None of the above" is selected, please explain: Continuing Education Credits 4.1 If you had a designated operator-in-charge, was the operator-in-charge earning Continuing Education Credits at the following rates? Grades T, 1, and 2: Averaging 6 or more CECs per year. Averaging less than 6 CECs per year. Grades 3 and 4: Averaging 8 or more CECs per year. Averaging less than 8 CECs per year. Total Points Generated 0 Score (100 - Total Points Generated) 100 Section Grade A
160 Compliance Maintenance Annual Report Kiel Wastewater Treatment Facility Last Updated: Reporting For: 7/23/ Financial Management 1. Provider of Financial Information Name: Kris August Telephone: (920) (XXX) XXX-XXXX Address (optional): 2. Treatment Works Operating Revenues 2.1 Are User Charges or other revenues sufficient to cover O&M expenses for your wastewater treatment plant AND/OR collection system? Yes (0 points) No (40 points) If No, please explain: 2.2 When was the User Charge System or other revenue source(s) last reviewed and/or revised? Year: years ago (0 points) 3 or more years ago (20 points) N/A (private facility) 2.3 Did you have a special account (e.g., CWFP required segregated Replacement Fund, etc.) or financial resources available for repairing or replacing equipment for your wastewater treatment plant and/or collection system? Yes (0 points) No (40 points) REPLACEMENT FUNDS [PUBLIC MUNICIPAL FACILITIES SHALL COMPLETE QUESTION 3] 3. Equipment Replacement Funds 3.1 When was the Equipment Replacement Fund last reviewed and/or revised? Year: years ago (0 points) 3 or more years ago (20 points) N/A If N/A, please explain: Equipment Replacement Fund Activity Ending Balance Reported on Last Year's CMAR $ 634, Adjustments - if necessary (e.g. earned interest, audit correction, withdrawal of excess funds, increase making up previous shortfall, etc.) + $ Adjusted January 1st Beginning Balance $ 634, Additions to Fund (e.g. portion of User Fee, earned interest, etc.) + $ 80, Subtractions from Fund (e.g., equipment replacement, major repairs - use description box below*) - $ 69, Ending Balance as of December 31st for CMAR Reporting Year $ 645,340.06
161 Compliance Maintenance Annual Report Kiel Wastewater Treatment Facility Last Updated: Reporting For: 7/23/ All Sources: This ending balance should include all Equipment Replacement Funds whether held in a bank account(s), certificate(s) of deposit, etc Indicate adjustments, equipment purchases, and/or major repairs from above. Electro Tech - Blower Motor $7,886.07, Asc Pumping - F.E. Reuse $7,278.38, Dorner - Final Clarifier valves $11,357.49, Furey Filter - FE booster pump $4,034.63, Xylem - DO Meter Aeration Basin 6 $ $11,700.00, Vogel Chevy - Vehicle $27, What amount should be in your Replacement Fund? $ 487, Please note: If you had a CWFP loan, this amount was originally based on the Financial Assistance Agreement (FAA) and should be regularly updated as needed. Further calculation instructions and an example can be found by clicking the HELP link under Info in the left-side menu Is the December 31 Ending Balance in your Replacement Fund above, (#3.2.6) equal to, or greater than the amount that should be in it (#3.3)? Yes No If No, please explain Future Planning 4.1 During the next ten years, will you be involved in formal planning for upgrading, rehabilitating, or new construction of your treatment facility or collection system? Yes - If Yes, please provide major project information, if not already listed below. No Project # Project Description Estimated Cost Approximate Construction Year 1 Anaerobic Digester Rehab I/I Reduction based on SSES Study. New Data per study Tertiary Filter Upgrade for Phosphorus New sewer North Street 700 block to include private laterals Primary Clarifier rebuild Final Clarifier Rebuild Sewer 6th Street & River Terrace, Blocks th Street, 800 block Washington, 400 & 500 Block North Ave Sludge Process Replacement Rehab concrete structures plant Increase Capacity Main Pump Station (100 River Road) SCADA Upgrade Plant & 500 Block Calumet Street, 300 block North Street Phosphorus Removal Improvements Hydraulic Pipe Improvements Aeration Basins to Final Clarifier Rehab and increase capacity of blocks Financial Management General Comments The utility is in good financial shape with progressive rate increases planned to meet future plant and system planned projects.
162 Compliance Maintenance Annual Report Kiel Wastewater Treatment Facility Last Updated: Reporting For: 7/23/ Total Points Generated 0 Score (100 - Total Points Generated) 100 Section Grade A
163 Compliance Maintenance Annual Report Kiel Wastewater Treatment Facility Last Updated: Reporting For: 7/23/ Sanitary Sewer Collection Systems 1. CMOM Program 1.1 Do you have a Capacity, Management, Operation & Maintenance (CMOM) requirement in your WPDES permit? Yes No 1.2 Did you have a documented (written records/files, computer files, video tapes, etc.) sanitary sewer collection system operation & maintenance (O&M) or CMOM program last calendar year? Yes (Continue with question 1) No (30 points) (Go to question 2) 1.3 Check the elements listed below that are included in your O&M or CMOM program. Goals Describe the specific goals you have for your collection system: 2.0 Goals The City of Kiel has developed this Capacity, Management, Operation and Maintenance Program (CMOM) to put in place the ideals, concepts and procedures to be used to prevent sewer overflows to the extent possible and practicable. The goals of the plan are Prevent overflows from the sanitary sewer to the extent possible and practicable. Manage the assets of the Kiel Wastewater Utility inclusive of personnel and equipment to affect a regular maintenance program and to be able to respond to emergency overflows of the system. Through the use of analytical and engineering methods, develop a system to assess and prioritize maintenance, rehabilitation and replacement activities for the portions of the collection system under operational control of the Kiel Wastewater Utility. Through effective management, develop and enforce appropriate ordinances that will help to better manage the performance of the collection system Goals Clean 25% and known trouble areas yearly. Reevaluate FOG and Sand Trap Program. Update mapping to include new sewer and video options. Organization Do you have the following written organizational elements (check only those that apply)? Ownership and governing body description Organizational chart Personnel and position descriptions Internal communication procedures Public information and education program Legal Authority Do you have the legal authority for the following (check only those that apply)? Sewer use ordinance Last Revised Date (MM/DD/YYYY) Pretreatment/industrial control Programs Fat, oil and grease control Illicit discharges (commercial, industrial) Private property clear water (sump pumps, roof or foundation drains, etc.) Private lateral inspections/repairs Service and management agreements Maintenance Activities (provide details in question 2)
164 Compliance Maintenance Annual Report Kiel Wastewater Treatment Facility Last Updated: Reporting For: 7/23/ Design and Performance Provisions How do you ensure that your sewer system is designed and constructed properly? State plumbing code DNR NR 110 standards Local municipal code requirements Construction, inspection, and testing Others: Overflow Emergency Response Plan: Does your emergency response capability include (check only those that apply)? Alarm system and routine testing Emergency equipment Emergency procedures Communications/notifications (DNR, internal, public, media, etc.) Capacity Assurance: How well do you know your sewer system? Do you have the following? Current and up-to-date sewer map Sewer system plans and specifications Manhole location map Lift station pump and wet well capacity information Lift station O&M manuals Within your sewer system have you identified the following? Areas with flat sewers Areas with surcharging Areas with bottlenecks or constrictions Areas with chronic basement backups or SSOs Areas with excess debris, solids, or grease accumulation Areas with heavy root growth Areas with excessive infiltration/inflow (I/I) Sewers with severe defects that affect flow capacity Adequacy of capacity for new connections Lift station capacity and/or pumping problems Annual Self-Auditing of your O&M/CMOM Program to ensure above components are being implemented, evaluated, and re-prioritized as needed Special Studies Last Year (check only those that apply): Infiltration/Inflow (I/I) Analysis Sewer System Evaluation Survey (SSES) Sewer Evaluation and Capacity Managment Plan (SECAP) Lift Station Evaluation Report Others: 0 2. Operation and Maintenance 2.1 Did your sanitary sewer collection system maintenance program include the following maintenance activities? Complete all that apply and indicate the amount maintained. Cleaning 10 % of system/year Root removal Flow monitoring Smoke testing 1 % of system/year 0 % of system/year 0 % of system/year
165 Compliance Maintenance Annual Report Kiel Wastewater Treatment Facility Last Updated: Reporting For: 7/23/ Sewer line televising Manhole inspections Lift station O&M Manhole rehabilitation Mainline rehabilitation Private sewer inspections Private sewer I/I removal 7 % of system/year 10 % of system/year 52 # per L.S./year.05 % of manholes rehabbed.05 % of sewer lines rehabbed.05 % of system/year.05 % of private services Please include additional comments about your sanitary sewer collection system below: Sanitary system is performing at moderate efficiency with continue removal of problems I/I areas. 3. Performance Indicators 3.1 Provide the following collection system and flow information for the past year Total actual amount of precipitation last year in inches Annual average precipitation (for your location) 17.5 Miles of sanitary sewer 6 Number of lift stations 0 Number of lift station failures 0 Number of sewer pipe failures 0 Number of basement backup occurrences 2 Number of complaints Average daily flow in MGD (if available) Peak monthly flow in MGD (if available) Peak hourly flow in MGD (if available) 3.2 Performance ratios for the past year: 0.00 Lift station failures (failures/year) 0.00 Sewer pipe failures (pipe failures/sewer mile/yr) 0.00 Sanitary sewer overflows (number/sewer mile/yr) 0.00 Basement backups (number/sewer mile) 0.11 Complaints (number/sewer mile) 61.0 Peaking factor ratio (Peak Monthly:Annual Daily Avg) 0.0 Peaking factor ratio (Peak Hourly:Annual Daily Avg) 4. Overflows LIST OF SANITARY SEWER (SSO) AND TREATMENT FACILITY (TFO) OFERFLOWS REPORTED ** Date Location Cause Estimated Volume (MG) None reported ** If there were any SSOs or TFOs that are not listed above, please contact the DNR and stop work on this section until corrected.
166 Compliance Maintenance Annual Report Kiel Wastewater Treatment Facility Last Updated: Reporting For: 7/23/ Infiltration / Inflow (I/I) 5.1 Was infiltration/inflow (I/I) significant in your community last year? Yes No If Yes, please describe: Based on I/I Study and SSES Study areas of high I/I are known. 5.2 Has infiltration/inflow and resultant high flows affected performance or created problems in your collection system, lift stations, or treatment plant at any time in the past year? Yes No If Yes, please describe: 5.3 Explain any infiltration/inflow (I/I) changes this year from previous years: Correction of I/I identified area on North and 7th Street. Lower rainfall events occured. 5.4 What is being done to address infiltration/inflow in your collection system? Replacing planned areas of the sanitary system I/I. During replacement main lines and laterals both public and private are replaced. Total Points Generated 0 Score (100 - Total Points Generated) 100 Section Grade A
167 Compliance Maintenance Annual Report Kiel Wastewater Treatment Facility Last Updated: Reporting For: 7/23/ Grading Summary WPDES No: SECTIONS LETTER GRADE GRADE POINTS WEIGHTING FACTORS SECTION POINTS Influent F BOD/CBOD A TSS A Ammonia A Phosphorus A Biosolids A Staffing/PM A OpCert A Financial A Collection A TOTALS GRADE POINT AVERAGE (GPA) = 3.68 Notes: A = Voluntary Range (Response Optional) B = Voluntary Range (Response Optional) C = Recommendation Range (Response Required) D = Action Range (Response Required) F = Action Range (Response Required)
168 Compliance Maintenance Annual Report Kiel Wastewater Treatment Facility Last Updated: Reporting For: 7/23/ Resolution or Owner's Statement Name of Governing Body or Owner: Date of Resolution or Action Taken: City of Kiel Resolution Number: ACTIONS SET FORTH BY THE GOVERNING BODY OR OWNER RELATING TO SPECIFIC CMAR SECTIONS (Optional for grade A or B. Required for grade C, D, or F. Regardless of grade, required for Collection Systems if SSOs were reported): Influent Flow and Loadings: Grade = F Facility Plan to be completed in 2015 by McMahon Engineering followed by related construction and rehabilitation of current plant processes design started to meet influent flow and loading requirements. Effluent Quality: BOD: Grade = A Effluent Quality: TSS: Grade = A Effluent Quality: Ammonia: Grade = A Effluent Quality: Phosphorus: Grade = A Biosolids Quality and Management: Grade = A Staffing: Grade = A Operator Certification: Grade = A Financial Management: Grade = A Collection Systems: Grade = A ACTIONS SET FORTH BY THE GOVERNING BODY OR OWNER RELATING TO THE OVERALL GRADE POINT AVERAGE AND ANY GENERAL COMMENTS (Optional for G.P.A. greater than or equal to 3.00, required for G.P.A. less than 3.00) G.P.A. = 3.68
169 APPENDIX III 4 UNIT PROCESS DESCRIPTIONS December 2014 Master Plan
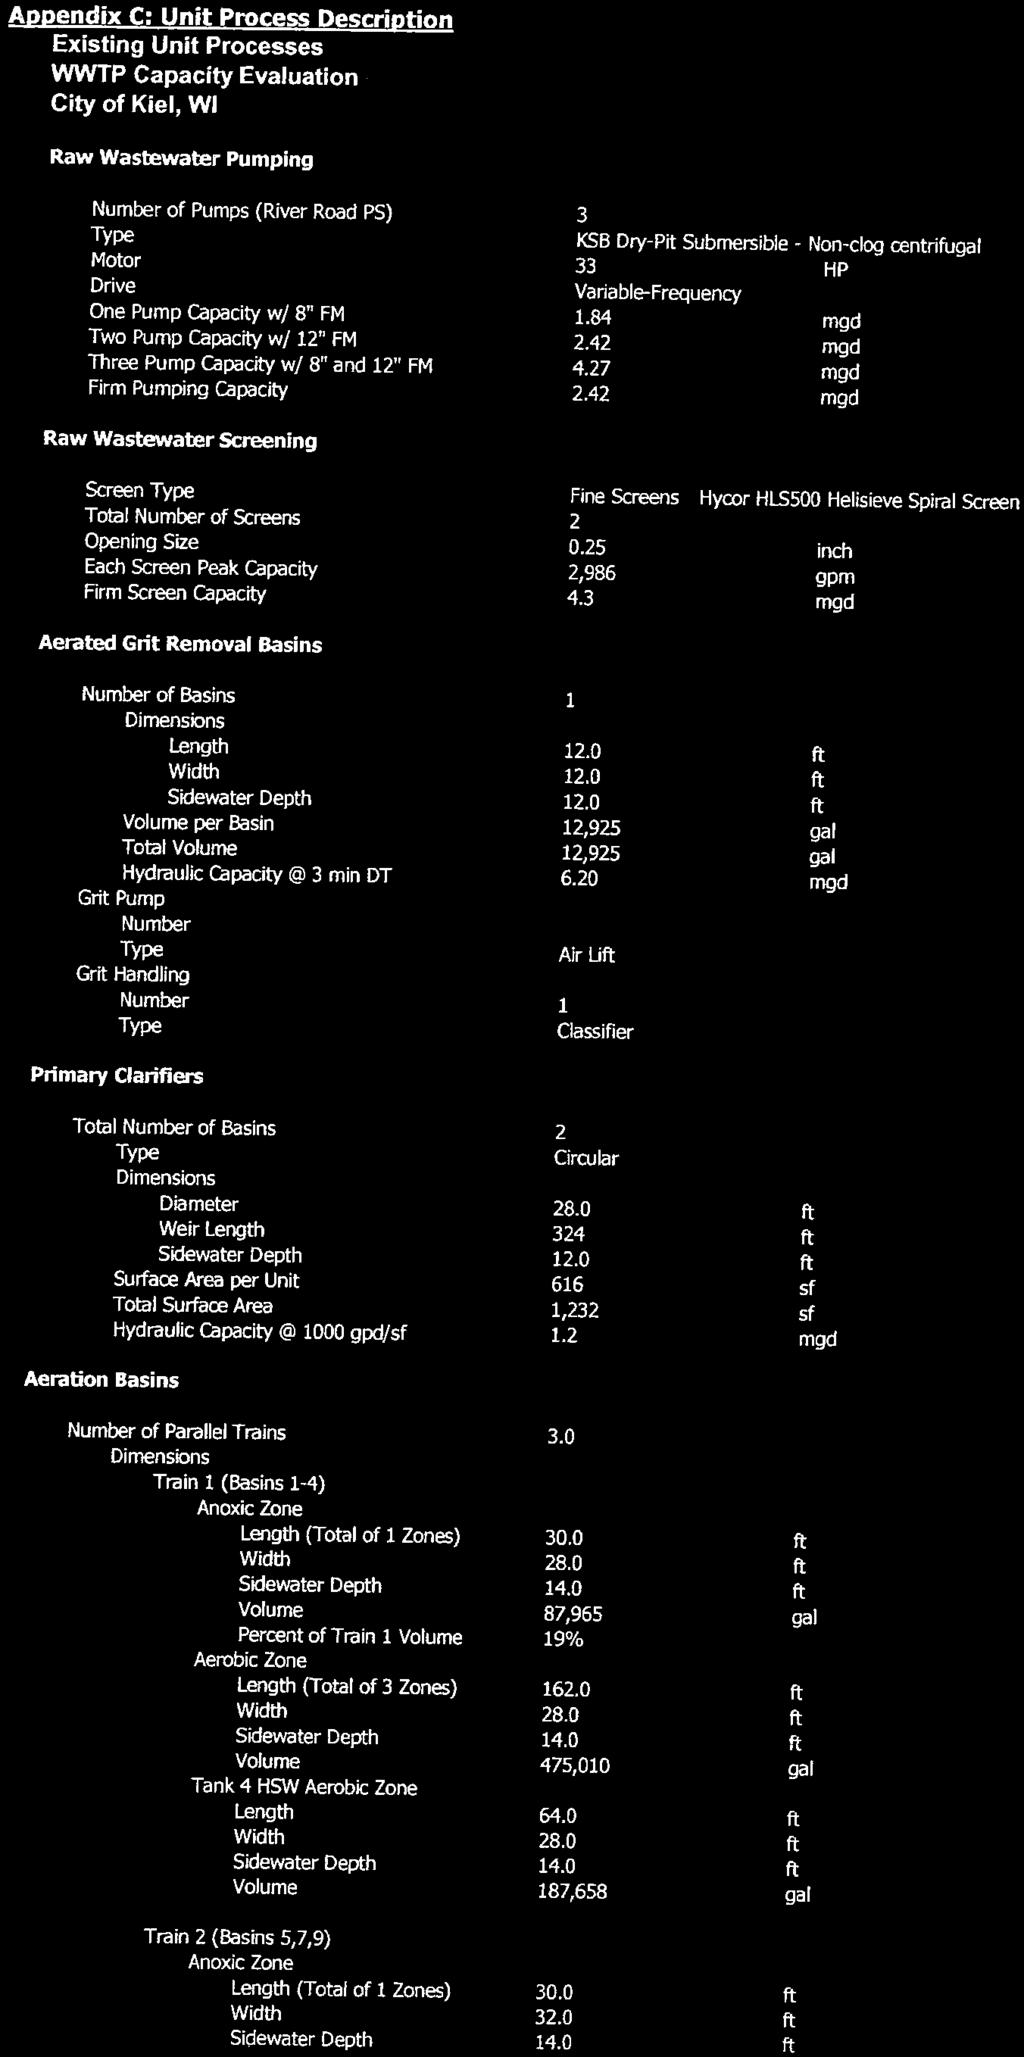
170
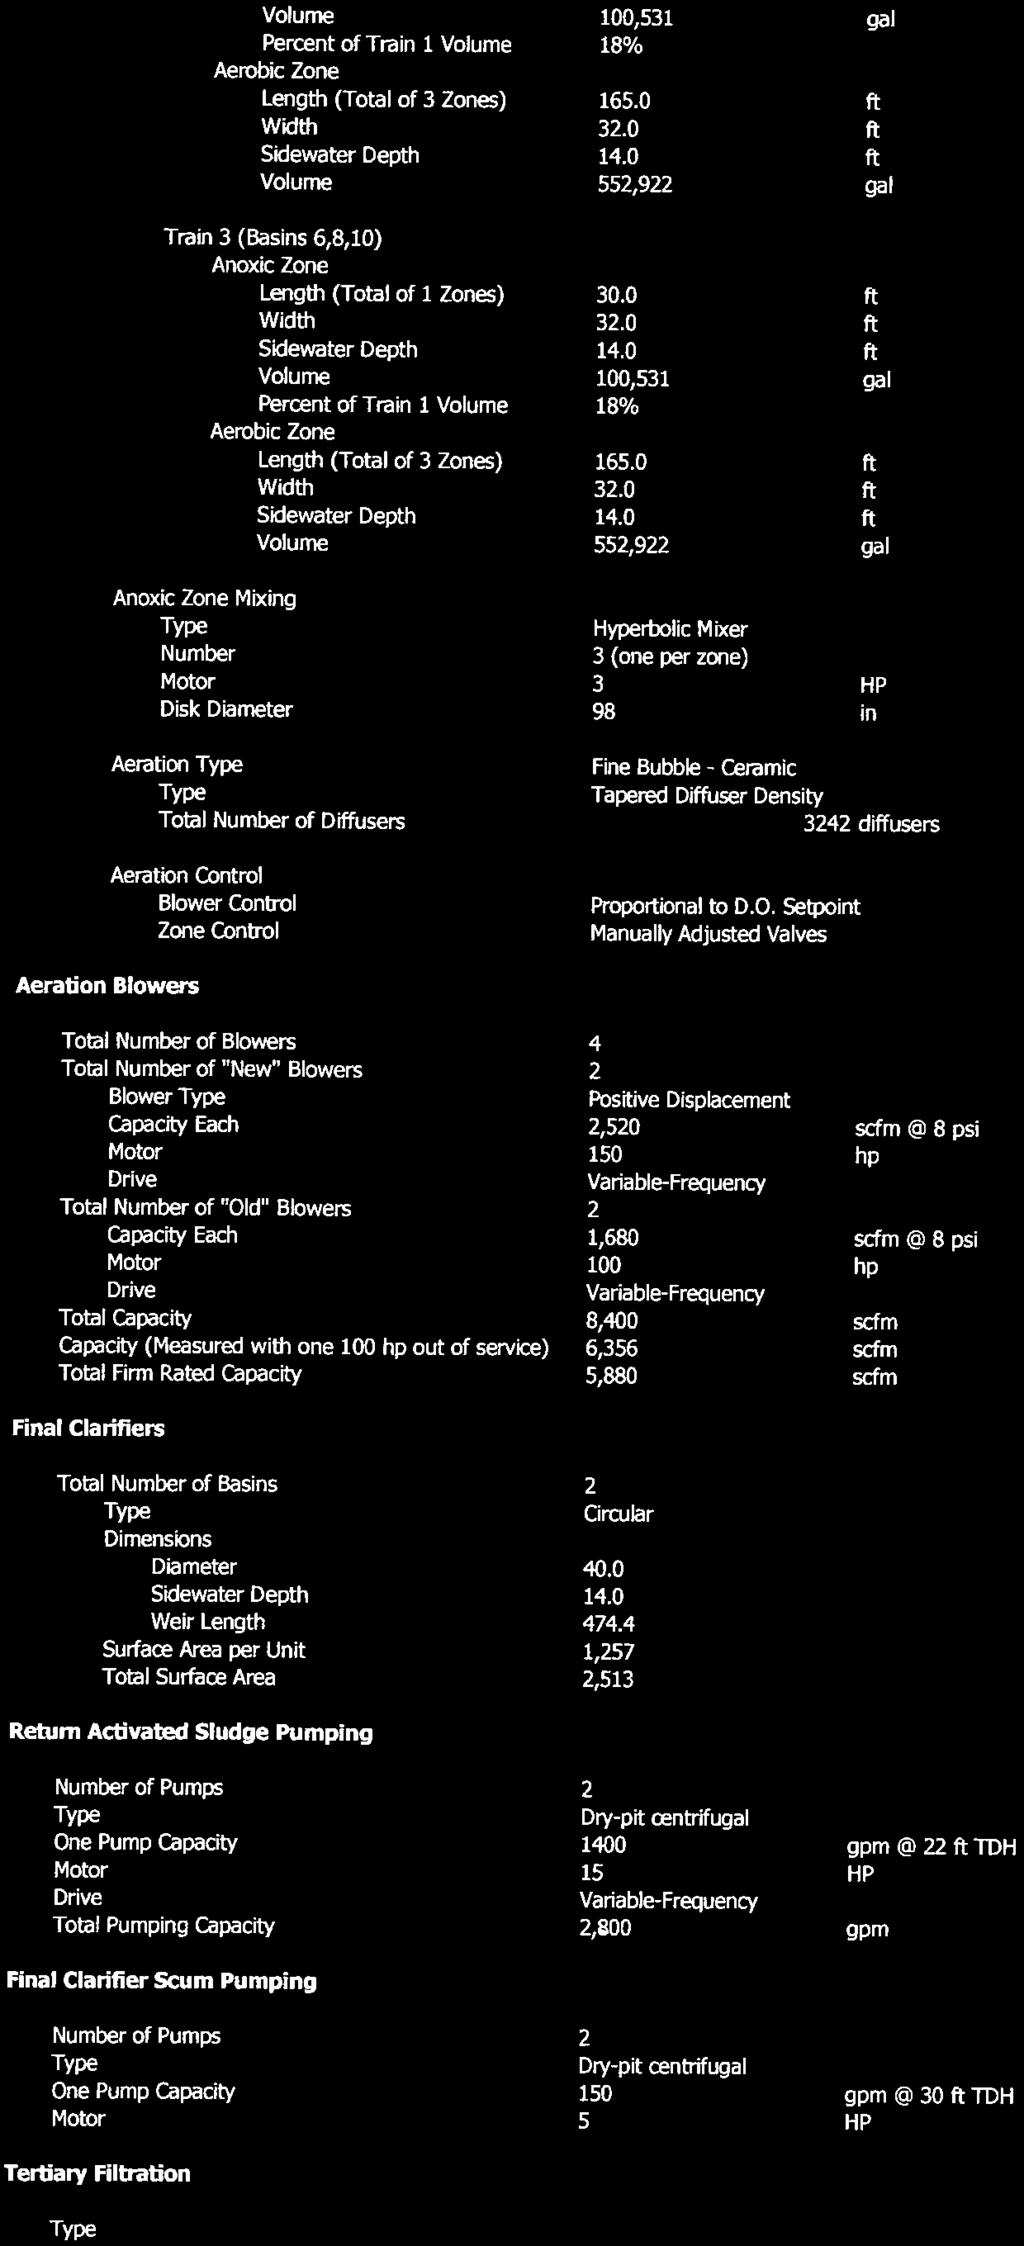
171
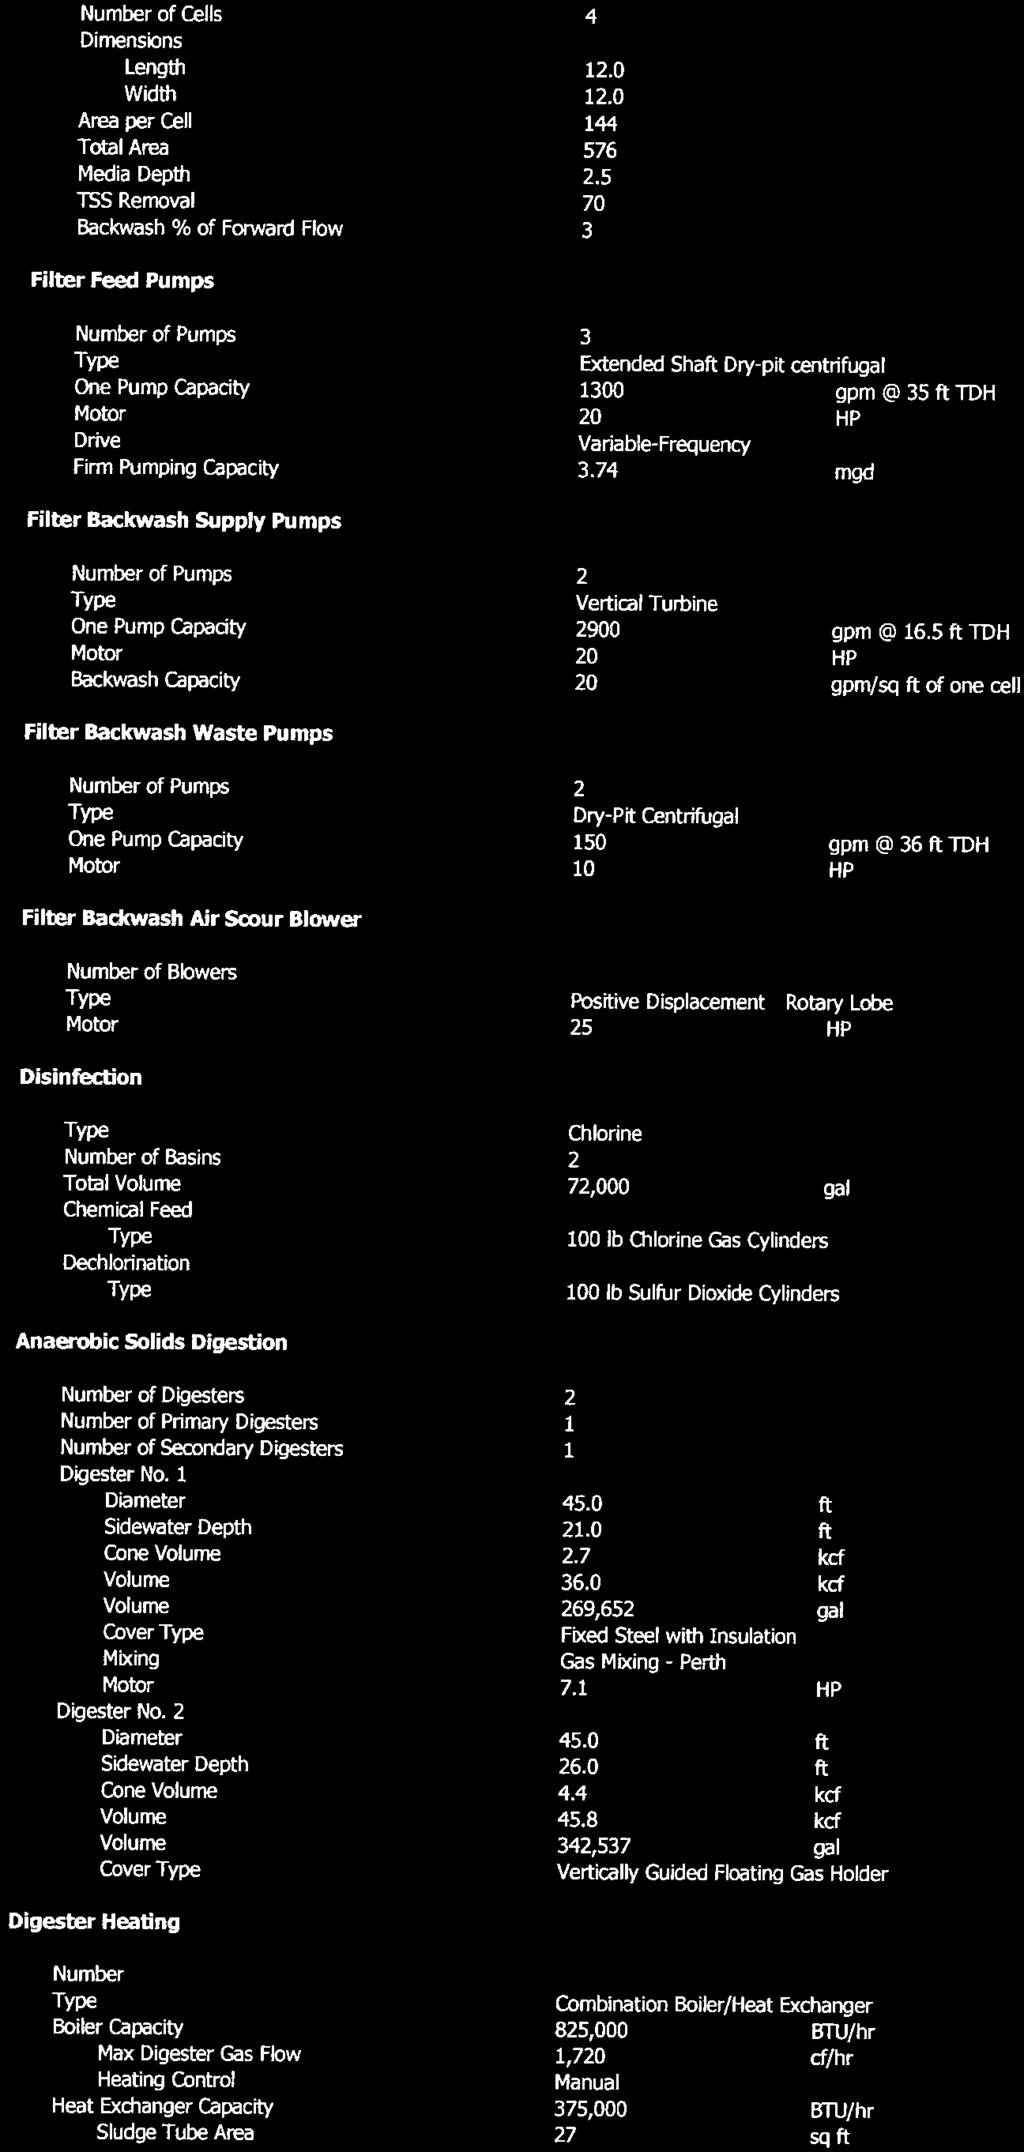
172
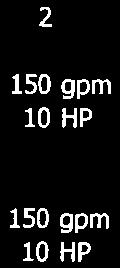
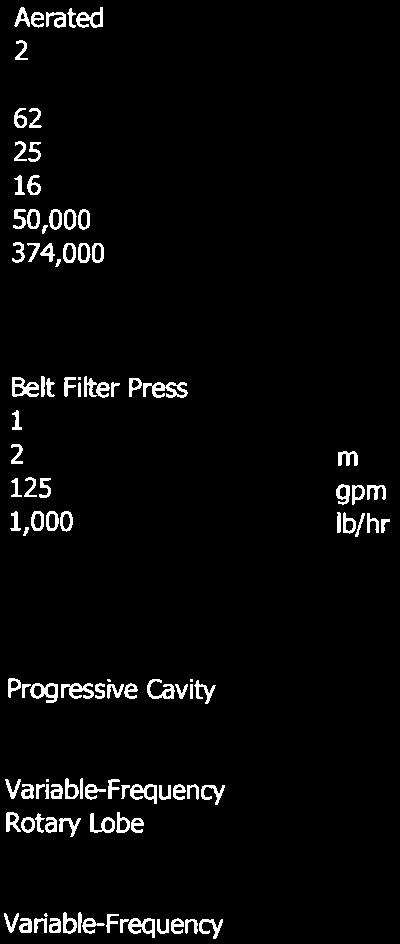
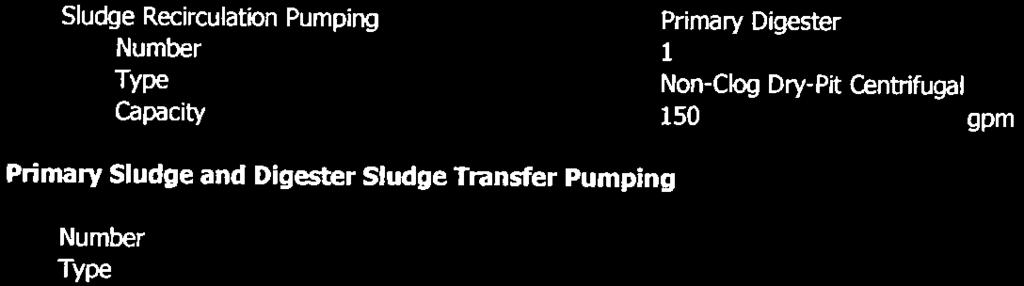


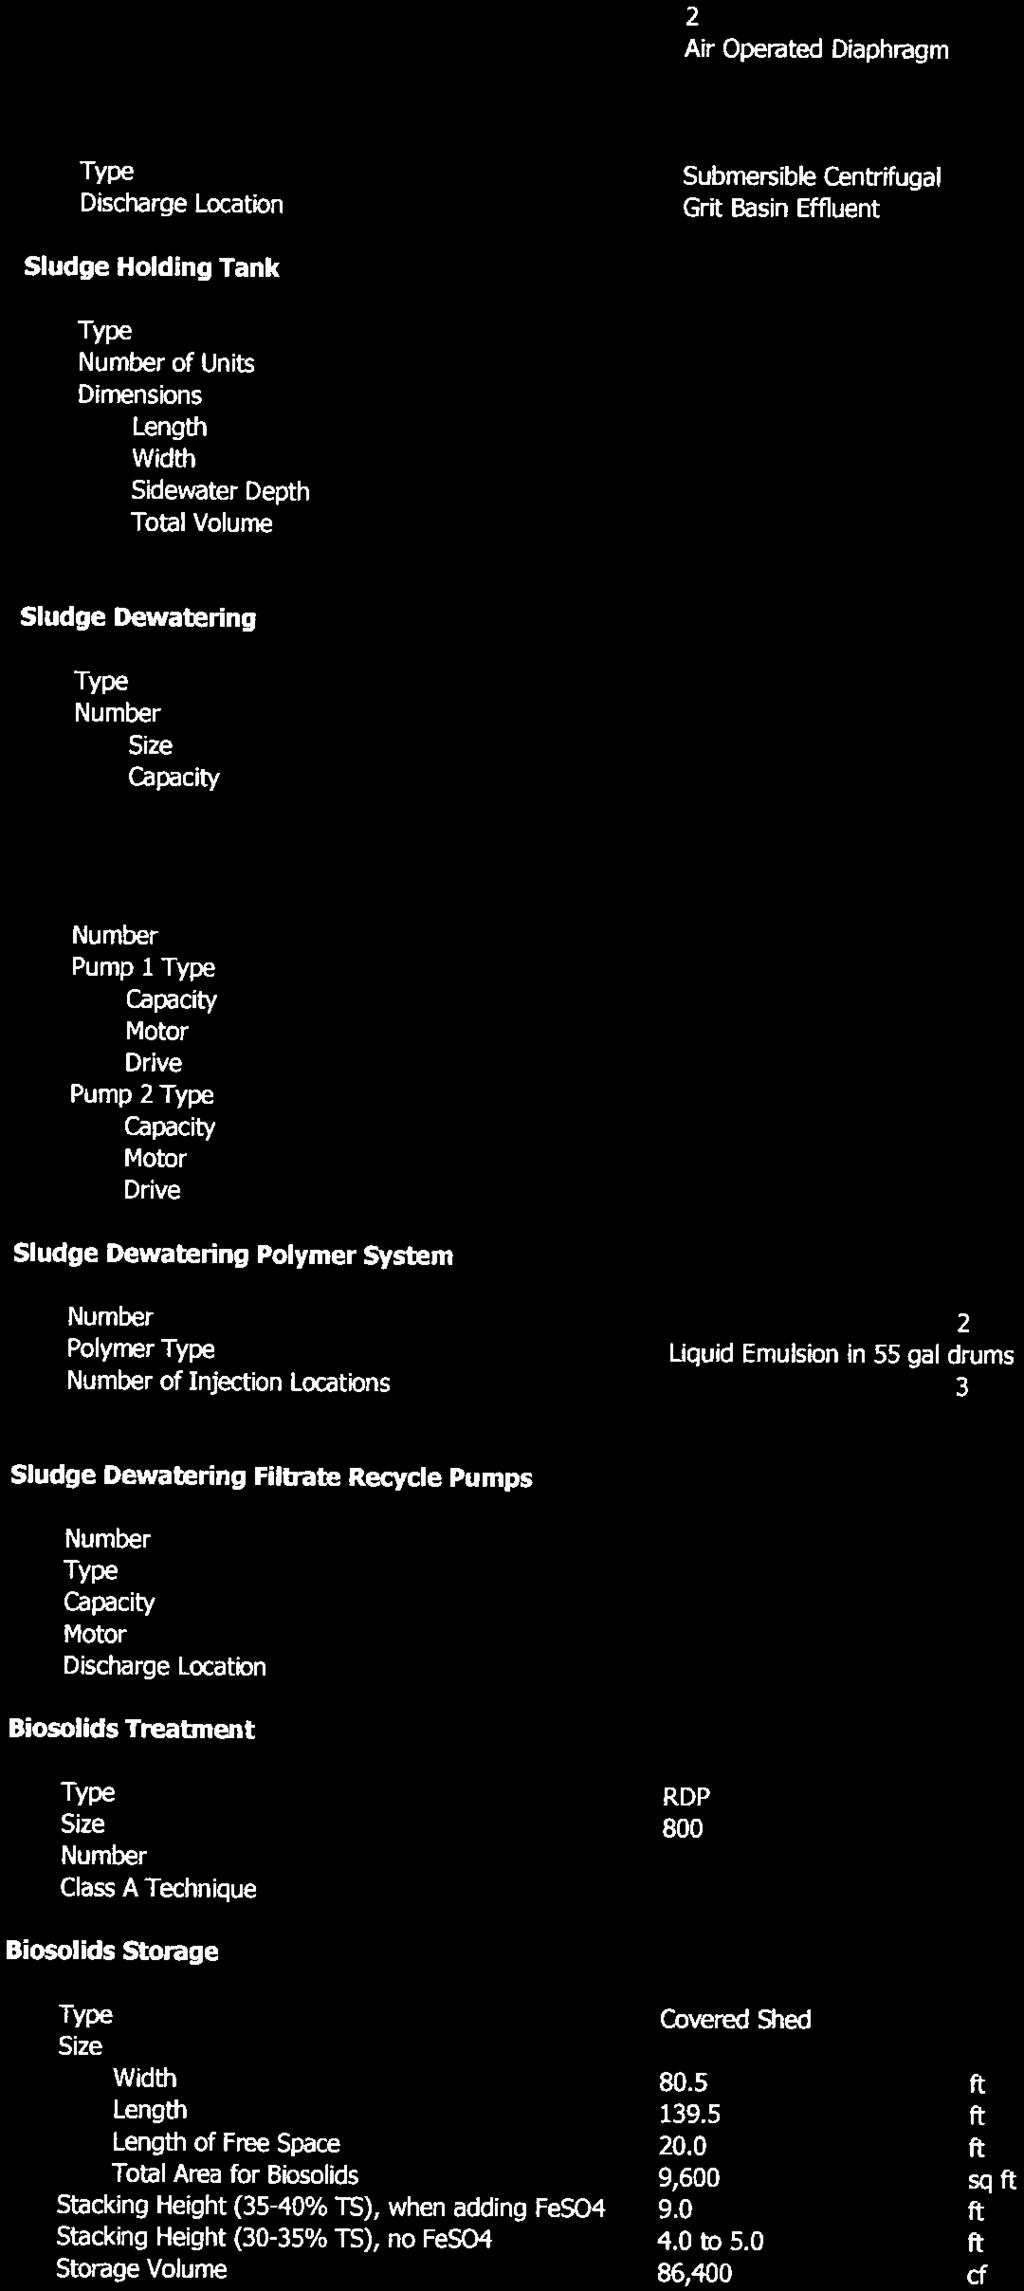
173
174 A. BACKGROUND Chapter IV INFILTRATION / INFLOW ANALYSIS An Infiltration / Inflow (I/I) Analysis is an integral part of Facility Planning, and is required per Wisconsin Administrative Code NR 110. The I/I Analysis shall demonstrate whether or not excess I/I exists in the sewer system. The analysis shall identify the presence, flow rate and type of I/I conditions that exist in the sewer system. Per NR 110, the definition of infiltration and inflow are: "'Infiltration' means water other than wastewater that enters a sewerage system (including sewer service connections) from the ground through such sources as defective pipes, pipe joints, connections or manholes. Infiltration does not include, and is distinguished from, inflow." "'Inflow' means water other than wastewater that enters a sewerage system (including sewer service connections) from sources such as roof leaders, cellar drains, yard drains, area drains, foundation drains, drains from springs and swampy areas, manhole covers, crossconnections between storm sewers and sanitary sewers, catch basins, cooling towers, storm waters, surface runoff, street wash water, or drainage. Inflow does not include, and is distinguished from, infiltration." By Memorandum from the Wisconsin Department of Natural Resources (DNR), dated December 5, 1991, a simplistic I/I Analysis can be used to determine whether or not excessive I/I exists in a sewer system. Two methods are suggested: The first method is from Facilities Planning; 1981, EPA 430/ Figure 2 (page 22) gives criteria for judging when infiltration is non excessive. Figure 2 Non Excessive Infiltration Rate Length of Sewer Pipe Non Excessive Infiltration Rate > 100,000 feet 2,000 to 3,000 gpd / in / mi 10,000 to 100,000 feet 3,000 to 6,000 gpd / in / mi < 10,000 feet 6,000 to 10,000 gpd / in / mi The quantity of infiltration is based upon the highest 7 day to 14 day average infiltration within a 12 month period. The infiltration allowance determined above applies to both I/I Analysis and Sewer System Evaluation Surveys (SSES). CHAPTER IV INFILTRATION / INFLOW ANALYSIS Wastewater Treatment System Facilities Plan CITY OF KIEL Calumet & Manitowoc Counties, Wisconsin Chapter IV 1
175 A second method is provided in I /I Analysis & Project Certification; May, 1985, EPA: Infiltration is non excessive if DWF < 120 gpcd Inflow is non excessive if WWF < 275 gpcd and the treatment plant does not experience hydraulic overloads during storm events. Inflow is excessive if WWF > 275 gpcd or the treatment plant does experience hydraulic overloads during storm events. DWF = Dry Weather Flow Highest average daily flow recorded over a 7 to 14 day period without precipitation during a period of seasonal high groundwater (March through July). WWF = Wet Weather Flow Highest daily flow recorded during a storm event. When calculating the various flows used to evaluate the I/I for the Kiel sanitary sewer system, the industrial flows from Land O Lakes, Inc., Sargento and Polar Ware were deducted from the Wastewater Treatment Facility influent flows. In the remaining sections of this Chapter, these calculated flows are referred to as the adjusted flows. A similar methodology was used in previous I/I investigations in the City of Kiel. The flows from Land O Lakes, Inc. are recorded on a daily basis. The wastewater flows from Sargento are metered for 1 week each month and were then averaged over each month. It was estimated that Polar Ware discharges approximately 50,000 gpd to the wastewater system based on water usage. Land O Lakes, Inc. and Sargento are both cheese manufacturing facilities, and Polar Ware is a metal finishing plant. B. INFILTRATION / INFLOW ANALYSIS 1. Infiltration For communities with 10,000 to 100,000 linear feet of sewer (Kiel has approximately 135,600 LF or 25.7 miles), infiltration is non excessive if the infiltration rate is between 2,000 to 3,000 gpd/inch mile. An alternate method for determining whether infiltration is excessive indicates it is not excessive if the Dry Weather Flow (DWF) is less than 120 gallons per capita per day (gpcd). Infiltration is computed during a high groundwater period using 7 to 14 days consecutive flow data after rain, but not during rain events. Appendix IV 1 contains the I/I Analysis for Kiel. Influent flow versus precipitation for 2012 through 2014 is charted on Figures IV 1, IV 2 and IV 3. In the Kiel collection system, infiltration rates range from 4,519 to 5,932 gpd/inch mile and from 299 to 390 gpcd, in 2012 through Therefore, infiltration in the Kiel system is excessive. CHAPTER IV INFILTRATION / INFLOW ANALYSIS Wastewater Treatment System Facilities Plan CITY OF KIEL Calumet & Manitowoc Counties, Wisconsin Chapter IV 2
176 Overall Total Gravity Pipe Lengths For The City Of Kiel Dia. Of Sewer Line Length Of Sewer Line 6 inch inch 85, inch 20, inch 19, inch 5, inch 1, inch 1, inch 2,104 Gravity TOTAL 135, miles 2. Inflow The Inflow Analysis is also summarized in the Appendix IV 1. The maximum day flows resulting from rainfall events were analyzed from 2012 through Maximum day (adjusted) wet weather flows per capita ranged from 505 gpcd to 700 gpcd. The greatest maximum day (adjusted) wet weather flow to the Wastewater Treatment Facility was 700 gpcd in Inflow is considered excessive if the maximum day wet weather flow exceeds 275 gpcd. Based on this analysis, inflow to the Kiel system is excessive. 3. Peak Flow Analysis Wastewater Treatment Facility influent flow data was reviewed for 2012 through Maximum daily flows are tabulated below: 4. Inflow Quantity / Calculation Year Total WWTF Flows Adjusted WWTF Flows mgd 1.89 mgd mgd 2.64 mgd mgd 2.70 mgd Peak inflow is projected by taking the peak flow to the Wastewater Treatment Facility and subtracting from it the peak dry weather base flow. Peak base flow is calculated as 2.5 times the base flow (per Ten State Standards). The calculations for peak inflow are presented below. These calculations are based on Wastewater Treatment Facility flows that have been adjusted to deduct the industrial flows as previously described. CHAPTER IV INFILTRATION / INFLOW ANALYSIS Wastewater Treatment System Facilities Plan CITY OF KIEL Calumet & Manitowoc Counties, Wisconsin Chapter IV 3
177 Base Flow Peak Base Flow Year mgd gpm gpm Peak Flow Peak Base Flow Estimated I/I Annual Rainfall Year gpm gpm gpm inches , , , , , I/I Reduction Efforts A Sewer System Evaluation Survey (SSES) was prepared for the City of Kiel by McMAHON, dated January 5, 2011, as required by the Wisconsin Department of Natural Resources (DNR) (Case I.D NEEE 074). Flow monitoring was conducted throughout the City to identify general areas contributing higher flows during peak flow events and to help determine if the clear water flow was caused by infiltration or inflow. Identifying the type of clear water inflow assists with the investigative techniques to be used to locate the sources of the I/I. The result of the sewer system flow monitoring was summarized in the SSES. The analysis of the flow monitoring results showed that Basins #1, #2 and #8 exhibited the greatest peak flows. These basins, located primarily in the western and northern areas of the City, encompass a large portion of the City. The collection system in these basins is primarily constructed of clay pipe and a majority of the pipe was constructed prior to the 1930 s. For several years, the City of Kiel has implemented annual I/I Reduction Programs, which focus on replacing clay pipe sewer mains with PVC main, and replacing laterals from the main to the home or building. In addition, approximately ten manholes are rehabilitated annually. The Sewer Utility inspects and televises sanitary sewers and manholes on streets that are scheduled for replacement or re pavement. The televising efforts focus on determining the location of I/I sources, and the City focuses on infrastructure replacement instead of repair to provide a long term solution to reduce clearwater inflow. The City has developed a 5 Year I/I Reduction Plan that is used as a guide for planning annual projects. The projects that are implemented each year may change based on current needs and budget. A copy of the 5 Year I/I Reduction Plan is provided in Appendix IV Handling I/I Flows The City of Kiel will continue to diligently seek out and remove clearwater inflow sources to the sanitary sewer system, but a large amount of clearwater will be conveyed to the Wastewater Treatment Facility for treatment. This will be addressed in a later chapter of this Facility Plan. W:\WP\Facility-Plan\K0015\950262\Chapter IV - Infiltration Inflow Anaylsis.docx CHAPTER IV INFILTRATION / INFLOW ANALYSIS Wastewater Treatment System Facilities Plan CITY OF KIEL Calumet & Manitowoc Counties, Wisconsin Chapter IV 4
178 2.50 Figure IV WWTF INFLUENT FLOW VS. PRECIPTATION CITY OF KIEL WISCONSIN Wastewater Treatment Facility Facility Plan Precipitation, inches Influent Flow, MGD Date Precipitation Influent Flow
179 2.5 Figure IV WWTF INFLUENT FLOW VS. PRECIPITATION CITY OF KIEL WISCONSIN Wastewater Treatment Facility Facility Plan Precipitation, inches Influent Flow, MGD Date NOTE: Sanitary Sewer Overflow (SSO) occurred on April 10, 2013 Precipitation Influent Flow
180 3 Figure IV WWTF INFLUENT FLOW VS. PRECIPITATION CITY OF KIEL WISCONSIN Wastewater Treatment Facility Facilty Plan Precipitation, inches Influent Flow, MGD Date Precipitation Influent Flow
181 APPENDIX IV 1 INFILTRATION / INFLOW (I/I) ANALYSIS
182 Table IV A1 1 SUMMARY OF GRAVITY PIPE LENGTHS & INCH DIAMETER MILE CALCULATIONS CITY OF KIEL WISCONSIN Wastewater Treatment Facility Facility Plan TOTAL IN CITY Diameter Length Inch Miles (inches) (feet) , , , , , , , Total 135, W:\WP\Facility-Plan\K0015\950262\Chapter IV - Infiltration Inflow Anaylsis.docx
183 Year Estimated Population Table IV A1 2 SUMMARY OF EPA SYSTEM FOR DETERMINING CITY WIDE INFILTRATION/INFLOW SEVERITY BASED ON POPULATION CITY OF KIEL WISCONSIN Wastewater Treatment Facility Facility Plan Maximum Dry Weather Flow (mgd) SEVERITY OF INFILTRATION Dry Weather Flow (gpcd) Excessive Criteria Excessive? (Yes/No) Maximum Wet Weather Flow (mgd) SEVERITY OF INFLOW Wet Weather Flow (gpcd) Excessive Criteria Excessive? (Yes/No) , >120 gpcd Yes > 275 gpcd Yes , >120 gpcd Yes > 275 gpcd Yes , >120 gpcd Yes > 275 gpcd Yes 1. Dry Weather Flow = Highest average daily flow recorded over a 7 to 14 day period without precipitation. 2. Wet Weather Flow = Highest daily flow recorded during a storm event. 3. All flows were adjusted to remove the Land 'O Lakes, Sargento and Polar Ware industrial flows. 4. Source of Population Estimates Wisconsin Department of Administration W:\WP\Facility-Plan\K0015\950262\Chapter IV - Infiltration Inflow Anaylsis.docx
184 Year Table IV A1 3 SUMMARY OF EPA SYSTEM FOR DETERMINING CITY WIDE INFILTRATION SEVERITY BASED ON INCH DIAMETER MILES OF PIPE CITY OF KIEL WISCONSIN Wastewater Treatment Facility Facility Plan Estimated Population Maximum Dry Weather Flow (mgd) Total City Inch Miles SEVERITY OF INFILTRATION gpd Inch Miles Excessive Criteria Excessive? (Yes/No) , , < 2,000 gpd/inch mile Yes , , < 2,000 gpd/inch mile Yes , , < 2,000 gpd/inch mile Yes 1. Dry Weather Flow = Highest average daily flow recorded over a 7 to 14 day period without precipitation. 2. All flows were adjusted to remove the Land 'O Lakes, Sargento and Polar Ware industrial flows. 3. Inch Miles are based on 2015 GIS mapping. 4. DNR Criteria: Infiltration is considered non excessive if Dry Weather Flow (DWF) is less than or equal to 120 gpdc, or DWF is < 2,000 to 3,000 gpd/inch mile. W:\WP\Facility-Plan\K0015\950262\Chapter IV - Infiltration Inflow Anaylsis.docx

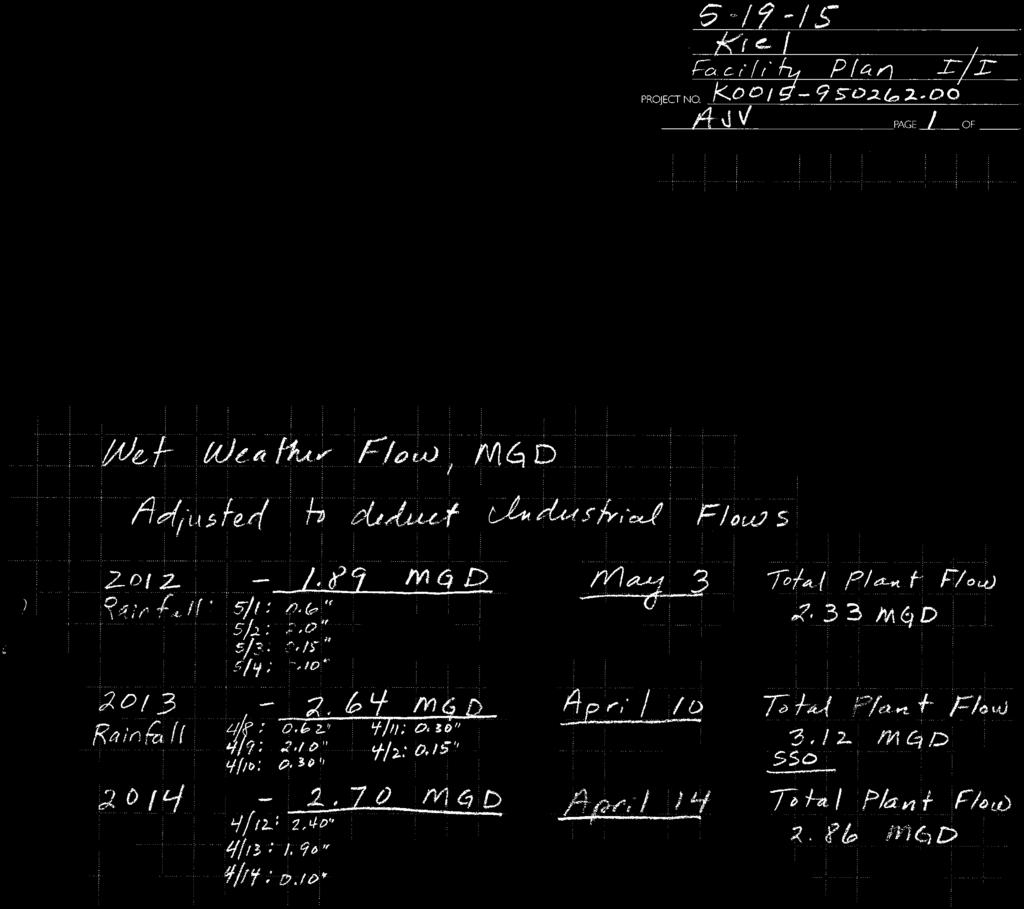
185

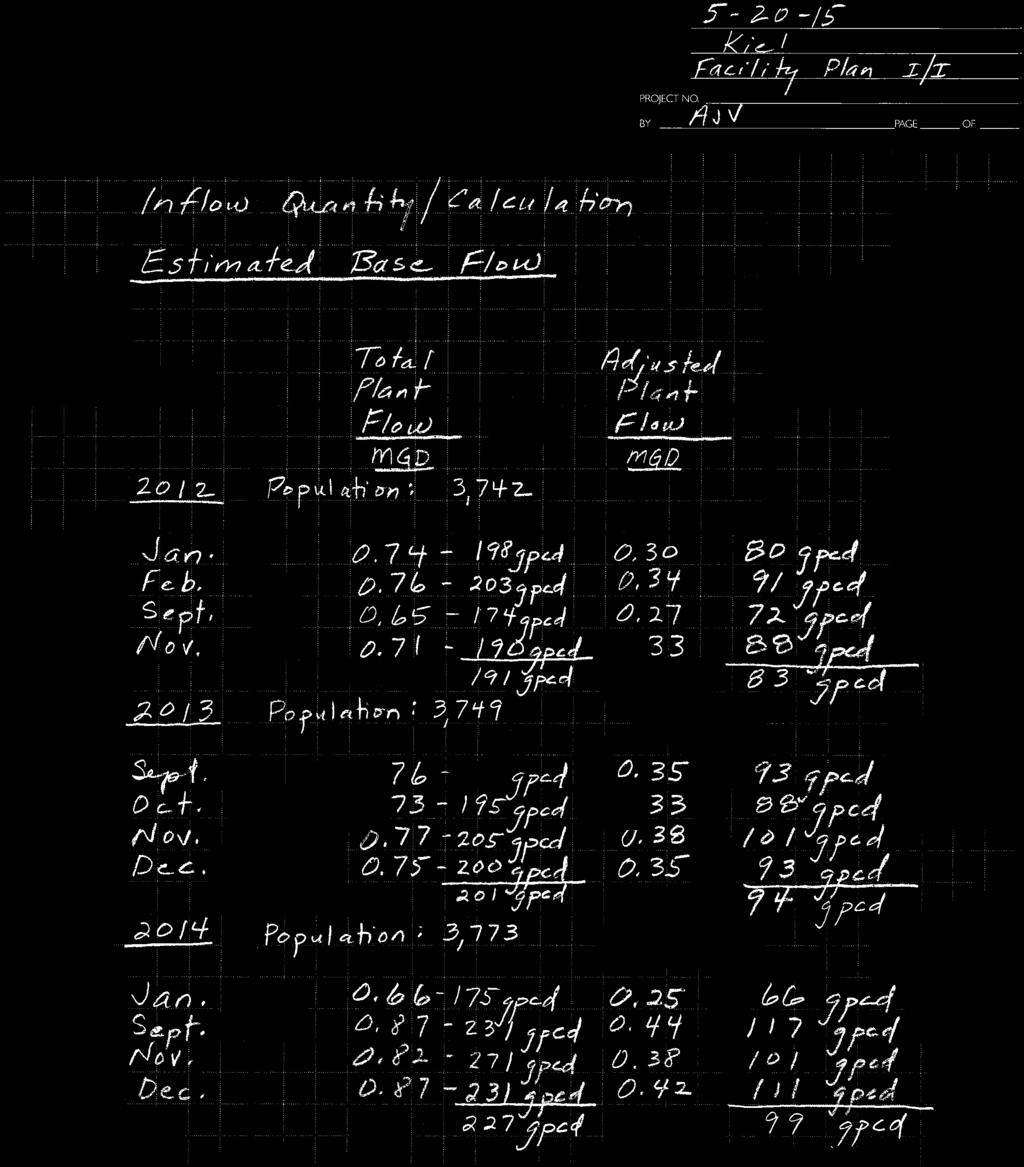


186

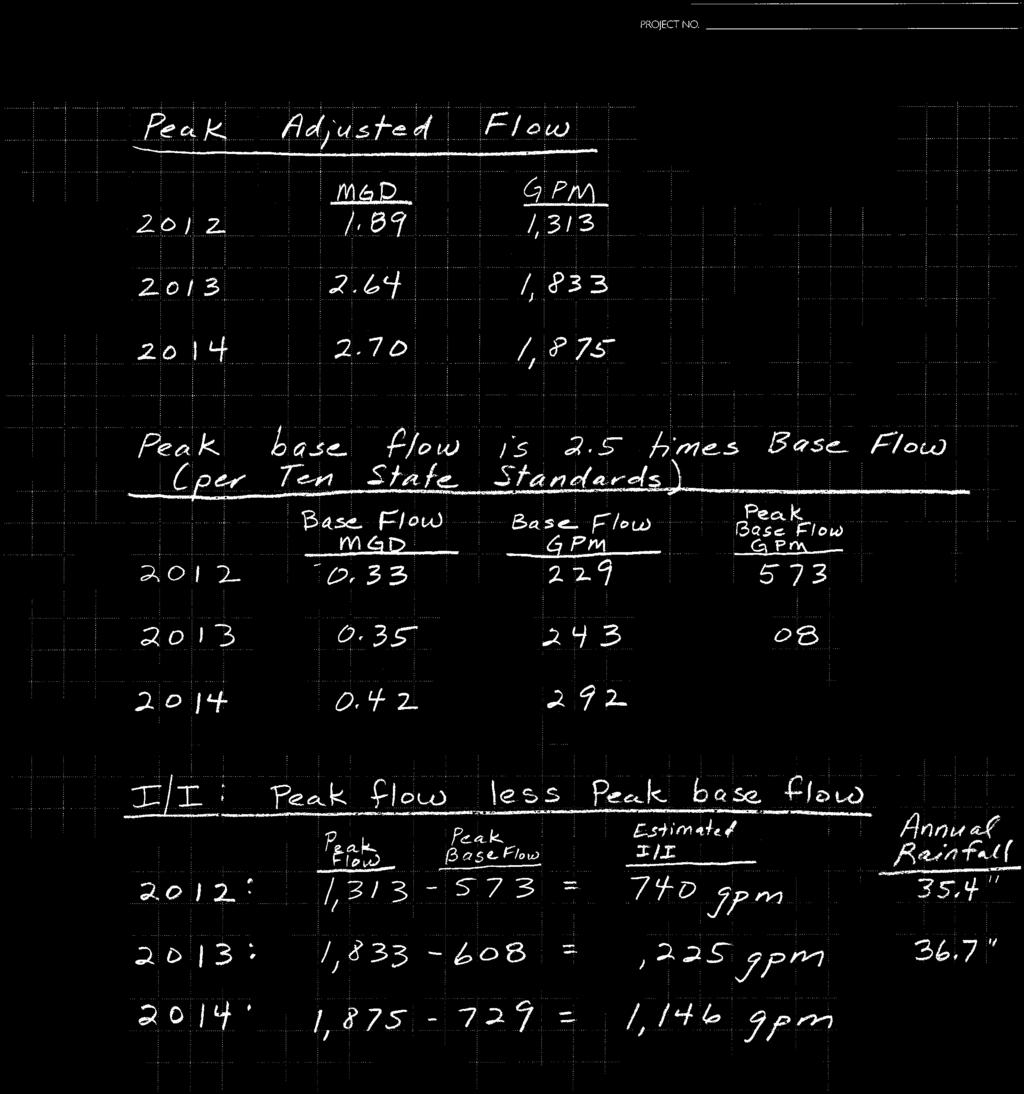

187
188 APPENDIX IV 2 5 YEAR INFILTRATION/INFLOW (I/I) REDUCTION PLAN
189 Table IV A WASTEWATER UTILITY 5 YEAR PLAN COLLECTION SYSTEM CITY OF KIEL WISCONSIN Wastewater Treatment Facility Facility Plan Year Sewer Individual Budget Estimate 2015 Sewer 600 Block of Paine & St Paul Street $84,000 Manhole Rehab 10 Structures $12, Sewer 9th Street $101,110 Sewer 800 Block Washington Street $38,500 Sewer 400 & 500 Blocks North Street $38,500 Manhole Rehab 10 Structures $13, Sewer 500 Block River Terrace $58,000 Sewer Blocks of 6th Street $110,000 Manhole Rehab 10 Structures $13, Sewer Blocks of 6th Street $500,000 Manhole Rehab 10 Structures $13, Sewer 400 & 500 Blocks of Calumet $110,000 Sewer 300 Block of North Street $35,000 Manhole Rehab 10 Structures $14, Sewer 500 Block North Street $58,140 Sewer Kretsch Court $25,000 Manhole Rehab 10 Structures $14,760 Annual Budget Estimate $96,730 $191,220 $181,500 $513,910 $159,330 $97,900 Source: Prepared by The City Of Kiel Sewer work includes sewer main replacement and sewer lateral replacement from the main to the home. The Property Owner is responsible for the lateral cost from the property line to the home. W:\WP\Facility-Plan\K0015\950262\Chapter IV - Infiltration Inflow Anaylsis.docx
190 Chapter V FUTURE CONDITIONS A. INTRODUCTION To evaluate and size facilities for a Wastewater Management System, future population and wastewater flows and loadings must be estimated for the planning area. Wastewater flows and loadings are a function of the sewered population, per capita water use, commercial and industrial discharges, hauled in wastes, and Infiltration/Inflow (I/I). This Chapter defines the planning period, staging period, estimates future population, and estimates future flows and loadings anticipated within the planning area. B. PLANNING PERIOD The planning period is the time period over which the Wastewater Management System is evaluated for cost effectiveness. According to United States Environmental Protection Agency (USEPA) and Wisconsin Department Of Natural Resources (DNR) regulations, the planning period for a Facilities Plan shall be 20 years [NR 110.,09(1)]. For the purposes of this Facilities Plan, the planning period shall be to the year C. POPULATION ESTIMATES As previously noted in Chapter II, the Wisconsin Department Of Administration (DOA) population projections for the 10, 15 and 20 year staging period are as follows: D. FUTURE FLOWS & LOADINGS Year Population Projection , , ,260 Projected future influent raw wastewater flows and loadings for the Kiel Wastewater Treatment Facility are provided in Table V 1. The flows and loadings projections were developed on the following basis: 1. Historical Wastewater Treatment Facility influent flows and loadings [Biochemical Oxygen Demand (BOD 5 ), Total Suspended Solids (TSS), Total Phosphorus (P)] from 2012 through 2014 were used, as well as monitoring data from the two (2) significant industrial contributors, Land O Lakes, Inc. and Sargento. CHAPTER V FUTURE CONDITIONS Wastewater Treatment System Facilities Plan CITY OF KIEL Calumet & Manitowoc Counties, Wisconsin Chapter V 1
191 2. Average adjusted or base residential / commercial Wastewater Treatment Facility flows and loadings were estimated using data from days during the period between January 1, 2012 and December 31, 2014, where total Wastewater Treatment Facility, Land O Lakes, Inc. and Sargento monitoring data were all available. The Land O Lakes, Inc. and Sargento flows and loadings, as well as hauled in waste contributions, were subtracted from the total Wastewater Treatment Facility flows and loadings to establish a data set of adjusted Wastewater Treatment Facility flows and loadings, representing the current average residential, commercial and light industrial contributions. 3. The projected increase in average residential / commercial flows and loadings was determined using an estimated population increase of 467 from 2013 to the Design Year 2035, and textbook per capita flows and loadings factors as follows: a. Average Flow = 100 gallons/capita/day b. Average BOD 5 = 0.18 lbs./capita/day c. Average TSS = 0.2 lbs./capita/day d. Average Total P = lbs. capita/day Source: WEF MOP 8 4. Hauled in waste contributions were determined based on current data and removing the portion contributed by Baker Cheese, which no longer hauls waste to the Kiel Wastewater Treatment Facility. It was assumed that the current hauled in waste contribution (less Baker Cheese) is not expected to increase in the future, and will remain relatively stable. 5. Future average flows and loadings projections for the Land O Lakes, Inc. facility were provided by Land O Lakes, Inc. and are included in Table V Future flow projections for Sargento were initially calculated assuming a 50% increase in flow above the current average; however, this was later reduced to a 25% increase based on discussions with the City of Kiel and the current construction project initiated by Sargento. Average loadings were calculated based on current average concentrations at the future average flow. Refer to Table V Total projected future average flows and loadings were determined to be the sum of the adjusted Wastewater Treatment Facility flows and loadings, projected increases in average residential / commercial based on textbook value, current hauled in waste contributions (less Baker Cheese), and future average projections for Land O Lakes, Inc. and Sargento. 8. The future average Total Kjeldahl Nitrogen (TKN) loadings were projected based on future average flow and an average TKN concentration of 60 mg/l, which was determined based on influent TKN monitoring data from July 27 through August 6, Future maximum month and maximum day flows and loadings were projected using peaking factors determined based on the current total Wastewater Treatment Facility influent data (years 2012 to 2014). Peaking factors for TKN were based on those used in CHAPTER V FUTURE CONDITIONS Wastewater Treatment System Facilities Plan CITY OF KIEL Calumet & Manitowoc Counties, Wisconsin Chapter V 2
192 Kiel s Master Plan. It should be noted that the calculated peaking factor for maximum day TSS was 5.2; however, a more reasonable peaking factor of 2.5 was used for projecting future maximum day TSS, discounting the maximum day TSS value in 2013, which was considered an outlier and skewed the data. Table V 1 PROJECTED 2035 FLOWS & LOADINGS Parameter Influent Flow (mgd) Average Maximum Month (PF = 1.75) Maximum Day (PF = 3.0) Peak (PF = 4.0) BOD, lbs./day Average Maximum Month (PF = 1.3) Maximum day (PF = 2.6) TSS, lbs./day Average Maximum Month (PF = 1.5) Maximum day (PF = 2.5) Total P, lbs./day Average Maximum Month (PF = 1.3) Maximum day (PF = 3.5) TKN, lbs./day Average Maximum Month (PF = 1.6) Maximum day (PF = 2.3) Future ,265 10,745 21,489 6,424 9,636 16, ,427 Table V 2 LAND O LAKES, INC. FUTURE FLOWS & LOADINGS Weekly Avg. Daily Max. Flow, gpd 436, ,636 BOD, lbs./day 4,000 8,000 TSS, lbs./day ,015 P, lbs./day [The remainder of this page was left blank intentionally.] CHAPTER V FUTURE CONDITIONS Wastewater Treatment System Facilities Plan CITY OF KIEL Calumet & Manitowoc Counties, Wisconsin Chapter V 3
193 Influent Flow, mgd Average Maximum Month Maximum Day Table V 3 SARGENTO FUTURE FLOWS & LOADINGS PROJECTIONS Average PF Future BOD, mg/l Average 2,404 2,209 2,058 2,224 BOD, lbs./day Average Maximum Month Maximum Day 1,454 2,229 6,235 1,351 2,094 6,107 1,393 2,344 7,708 1,399 2,222 6,683 TSS, mg/l (Average) 2,458 1,859 1,352 1,880 TSS, lbs./day Average Maximum Month Maximum Day 1,533 4,190 20,168 1,170 2,023 8, ,259 10,089 1,209 2,824 12,838 Total P, mg/l (Average) Total P, lb./day Average Maximum Month Maximum Day ,692 2,688 8,082 1,430 3,341 15, CHAPTER V FUTURE CONDITIONS Wastewater Treatment System Facilities Plan CITY OF KIEL Calumet & Manitowoc Counties, Wisconsin Chapter V 4
194 E. DESIGN PERIOD The design period is the time period in which the Wastewater Management System is expected to reach design capacity. For Wastewater Treatment Facilities, NR (2)(j)4.b. recommends three (3) alternative staging periods of 10, 15 and 20 years be evaluated for cost effectiveness, based upon the following: Table V 4 STAGING PERIODS Flow Growth Factor Maximum Initial Staging Period 1. Avg. Design Flow < 1.3 Times Initial Flow 20 years 2. Avg. Design Flow 1.3 to 1.8 Times Initial Flow 15 years 3. Avg. Design Flow > 1.8 Times Initial Flow 10 years Utilizing a 20 year planning period results in a flow growth factor of 1.24/0.862 = When considering a 15 year staging period, the only flow related change is due to the reduction in population of 65 people, when compared to the 20 year period. The corresponding reduction in flow is equal to only 6,500 gpd, and results in the same flow growth factor of /0.862 = Therefore, it can be concluded that the Wastewater Treatment Facility sizing is the same for both the 15 year and 20 year design periods, with only a 6,500 gpd (0.5%) difference in flow. NR (2)j(4)a states The Owner shall analyze at least 3 alternative staging periods (10 years, 15 years and 20 years) and the least costly (i.e., total present worth or average annual cost) staging period shall be selected. When considering the size of unit treatment processes for the 15 year and 20 year design periods, they may be considered to be equal. When comparing the average annual cost of a project, a 20 year project has a lower annual cost, compared to a 15 year project. Therefore, the 20 year staging period will be utilized for design purposes. [The remainder of this page was left blank intentionally.] CHAPTER V FUTURE CONDITIONS Wastewater Treatment System Facilities Plan CITY OF KIEL Calumet & Manitowoc Counties, Wisconsin Chapter V 5
195 F. DESIGN CAPACITY The current and proposed future Wastewater Treatment Facility design criteria are summarized in Table V 5. Table V 5 PROPOSED WASTEWATER TREATMENT FACILITY DESIGN CRITERIA Design Year Current Design 2035 Population N/A 4,260 Flow (mgd) Average Maximum Month Maximum Day Peak Hour Biochemical Oxygen Demand (BOD) (lbs./day) Average Maximum Month Maximum Day Total Suspended Solids (TSS) Average Maximum Month Maximum Day Total Kjehldahl Nitrogen (TKN) Average Maximum Month Maximum Day Phosphorus (P) Average Maximum Month Maximum Day 6,000 6,280 9,250 2,842 4,480 7,420 8,265 10,745 21,489 6,424 9,636 16,060 CHAPTER V FUTURE CONDITIONS Wastewater Treatment System Facilities Plan CITY OF KIEL Calumet & Manitowoc Counties, Wisconsin Chapter V 6 N/A N/A N/A Capacity limitations of existing unit processes are summarized in Table V 6. Table V , CAPACITY LIMITATIONS Item Current Capacity Current NR 110 Requirement Future Capacity Requirement River Road Pump Station 2.42 mgd 4.26 mgd 4.96 mgd Screening 4.3 mgd 4.26 mgd 4.96 mgd Primary Clarifiers 1.23 mgd Avg mgd Peak mgd, Avg mgd, Peak 1.24 mgd Avg mgd Peak 16 inch PE Piping 2.0 mgd 4.96 mgd Aeration Capacity 4,970 lbs./day 4,970 lbs./day 8,265 lbs./day 16 inch MLSS Piping 2.0 mgd 4.96 mgd Final Clarifiers mgd Peak 4.26 mgd Peak 4.96 mgd Peak RAS Pumping mgd 1.72 mgd 2.48 mgd Tertiary Filters 2.0 mgd 4.26 mgd 4.96 mgd Disinfection 2.53 mgd, Peak 4.26 mgd Peak 4.96 mgd Peak W:\WP\Facility-Plan\K0015\ \Chapter V - Future Conditions.docx
196 Chapter VI ALTERNATIVES EVALUATION & PRELIMINARY SCREENING A. INTRODUCTION Prior to evaluating specific wastewater treatment alternatives, wastewater management options require evaluation on the planning level. The options typically include the Regional Treatment alternative and the No Action alternative. The City of Kiel has recently evaluated joint treatment with the City of New Holstein, and determined it was not cost effective. Therefore, Regional Treatment as an option will be dropped from further consideration, as there are no other suitable regional possibilities. This Chapter evaluates and summarizes planning level alternatives. A preliminary screening is undertaken to identify those alternatives that are applicable to the Kiel facilities. Those alternatives surviving the screening process are evaluated for cost effectiveness in Chapter VII. Each unit process will be discussed, as well as the need or lack thereof for expansion or modification. B. NO ACTION ALTERNATIVE The No Action alternative consists of maintaining status quo conditions at the Wastewater Treatment Facility. Under this alternative, no improvements or modifications would be recommended. The current treatment facilities have reached or exceeded their design capacities for numerous unit processes. Hydraulic limitations exist, hampering the treatment process as flows increase. Many unit processes and equipment have reached or exceeded their service life, and are in need of repair or replacement. Therefore, the No Action alternative is impractical, and will be dropped from further consideration. C. LIQUID TRAIN TREATMENT ALTERNATIVES 1. General The Wisconsin Department Of Natural Resources (DNR) is considering changes to the City of Kiel s Wisconsin Pollutant Discharge Elimination System (WPDES) permit. Changes include Biochemical Oxygen Demand (BOD), Total Suspended Solids (TSS), Ammonia, Phosphorus (P) and Dissolved Oxygen (DO). Treatment system improvements will be evaluated to meet the new, changed limits being proposed. Potential restrictions regarding temperature and chlorides may need to be addressed with a variance, in the event they are CHAPTER VI ALTERNATIVES EVALUATION & PRELIMINARY SCREENING Wastewater Treatment System Facilities Plan CITY OF KIEL Calumet & Manitowoc Counties, Wisconsin Chapter VI 1
197 not dropped from consideration by the DNR; data suggests a temperature limitation is not warranted, and chlorides are not removed by conventional technologies. 2. Pump Station The River Road Pump Station utilizes three (3) dry pit pumps with a combined pumping capacity of 4.27 mgd. The firm capacity, with the largest pump out of service, is 2.42 mgd. In addition to the three (3) pumps in service, the Pump Station also has two (2) spare pumps stored in the Pump Room. This allows for a quick change out of a pump in the event of a failure. Flow data from the past 4 years indicates the peak hour flow rate to the River Road Pump Station is 1.58 mgd (refer to Appendix VI 1 for data). This required pumping rate is less than the projected future peak hour flow rate of 4.96 mgd. The City of Kiel has an on going Infiltration/Inflow (I/I) Reduction Program, as noted in Chapter IV. The City of Kiel intends to continue with I/I reductions within the collection system and, as such, believes the peak hour flows can be held to the current levels. As the Pump Station has two (2) spare pumps available, and the City of Kiel has an I/I Reduction Program, and the current peak hour flows are less than the Pump Station capacity, the City of Kiel will forego any change in the pumping capacity at this time. Should conditions warrant at a future date, the City of Kiel may expand pumping capacity at that time. 3. Headworks The building encompassing the fine screens is a Class I, Division 1, Classified Hazardous Area. The electrical systems, including controls, need to be upgraded to meet safety requirements. The City of Kiel intends to address the issue separately, and not include it in the treatment system upgrade project. The firm capacity of the fine screens is close to the future peak hour flow rate. As such, it is not recommended to replace or upgrade the existing fine screens at this time. They are serviceable, and the combined capacity of both screens is sufficient for current peak hour events. The 4.30 mgd capacity of the screens exceeds the 4.27 mgd River Road Pump Station capacity. Additionally, the screens tilt out of the flow stream to provide an emergency bypass. In the event of a major equipment failure in the future, a larger capacity screen should be installed. The ability of the grit chamber to effectively remove grit is unknown. A very small amount of grit is removed from the influent flow on a daily basis. Considering the surge in flows during rain events, one would expect a larger quantity. The grit classifier is serviceable at this time. When the digesters are taken out of service and cleaned out, the quantity of grit in the bottom of the vessels can be quantified and consideration of replacing the aerated CHAPTER VI ALTERNATIVES EVALUATION & PRELIMINARY SCREENING Wastewater Treatment System Facilities Plan CITY OF KIEL Calumet & Manitowoc Counties, Wisconsin Chapter VI 2
198 grit system with a more efficient vortex type grit system may be evaluated. Upon failure of the current grit classifier, replacement with a grit washer should be considered at that time. 4. Primary Clarifiers Continued use of the primary clarifiers will require repair of the structural cracks to extend the service life of the concrete. Mechanically, new mechanisms with rapid sludge removal headers and new drives will replace the existing equipment. The weirs and baffles will be considered for replacement, as well. The projected weir overflow rate at average design conditions is 5,492 gpd/lf, which is below the NR 110 maximum value of 10,000 gpd/lf. The projected surface settling rate at average conditions is 1,089 gpd/sq.ft., which is close to the NR 110 maximum value of 1,000 gpd/sq.ft.; the peak hour projected value is 4,114 gpd/sq.ft., which exceeds the NR 110 maximum value of 1,500 gpd/sq.ft. However, the activated sludge process, final clarifiers and tertiary filters follow the primary clarifiers, and any inefficiencies with the primaries may be accommodated in downstream processes. As such, primary clarifier removal efficiencies of 50% for TSS and 21% for BOD will be utilized for design of downstream processes. Additionally, 3% solids concentration will be assumed for primary sludge generated with the new sludge removal equipment. Redundant, dedicated sludge pumps should be provided. Pumps should be positive displacement type for use with the 3% primary solids that may be expected with the future upgrades. 5. Activated Sludge Expansion of the existing aeration system will be required to effectively treat the projected flows and loadings for the next 20 years. Influent / effluent piping to / from the aeration basins will need to have an increase in hydraulic capacity. Flow splitting at the existing splitter box will need to be addressed, as well. An additional aeration tank may be added to each of the three (3) trains. Continued use of aeration tankage will require structural repairs to concrete, as necessary to extend their service life. The buried air main, which leaks, should be replaced with an overhead, stainless steel air main. The old, 100 HP blowers are recommended to be replaced with more energy efficient units. Continued use of the 150 HP blowers is recommended, as they can provide on line back up to meet firm capacity requirements, while new energy efficient blowers provide duty service. CHAPTER VI ALTERNATIVES EVALUATION & PRELIMINARY SCREENING Wastewater Treatment System Facilities Plan CITY OF KIEL Calumet & Manitowoc Counties, Wisconsin Chapter VI 3
199 Retrofitting the aeration system with an Integrated Film Activated Sludge (IFAS) system should be considered as an alternative to increasing the existing conventional activated sludge system. An IFAS system combines both attached biological growth and suspended biological growth treatment in the same tank. Media is added to the aeration tankage, which provides a surface for growth of additional attached biomass. Advantages of IFAS include: Allows capacity expansion with same aerobic volume. Increases Biological Nutrient Removal (BNR). Improves solids settleability. Greater resistance to hydraulic washout. Increased resilience to slug loadings. Reduced solids loading to final clarifiers. Consideration should be given to Membrane Bio Reactor (MBR) systems. Factoryassembly of submerged units consisting of air diffusers assemblies, membrane cassettes, and common permeate manifolds provide simpler installation in the field. MBR systems operate at a higher mixed liquor concentration, and require a significantly smaller footprint. Advantages of an MBR system include: Smaller footprint; fits in existing tankage. Multiple barriers; membranes and biofilm. Physical barrier to exclude viruses, bacteria and cysts; reducing need to expand disinfection system or existing filters. No need to rebuild or expand final clarifiers. With the use of an expanded conventional activated sludge system, and with an IFAS system, the existing final clarifiers will be utilized. Replacement of the mechanisms and drives, weirs and baffles is required. In addition, two (2) new 40 foot diameter final clarifiers are required to handle the projected hydraulic capacity and solids loading. Consideration should be given to replacing the Fiberglass Reinforced Plastic (FRP) domes, as well. Redundant Return Activated Sludge (RAS) and Waste Activated Sludge (WAS) pumps are recommended. Final clarifiers are not required for the MBR alternative. 6. Tertiary Filtration The capacity of the filter system must be increased, and efficiencies increased to allow removal of Phosphorus. The ability to remove Phosphorus down to 0.1 mg/l at 4.96 mgd in a retrofit of the existing sand filters is highly unlikely and impractical. Options utilizing ballasted high rate sedimentation (Actiflo and Co Mag) do not allow for installation within the existing filter footprint while providing system redundancy, and are dropped from consideration. Instead, installation of disc type filters in the filter footprint will be CHAPTER VI ALTERNATIVES EVALUATION & PRELIMINARY SCREENING Wastewater Treatment System Facilities Plan CITY OF KIEL Calumet & Manitowoc Counties, Wisconsin Chapter VI 4
200 evaluated with the expanded conventional activated sludge and IFAS options. Filters are not required with the MBR option. 7. Disinfection The detention time in the chlorine contact tanks is 70 minutes at the 1.24 mgd average design flow, while it is only 17.5 minutes at the peak hour flow. NR (2)(e)2 notes that contact tanks shall be sized to provide a detention time of 60 minutes at average design flow or 30 minutes at maximum hour design flow. The existing contact tanks comply with the 60 minute/average design flow requirement. Additionally, a filtration step precedes the disinfection system, which minimizes the solids reaching the contact tanks. Chlorine dosage (and de chlorine dosage) can be adjusted as necessary to achieve adequate kill. The current facilities have a good record of compliance with disinfection requirements. Therefore, it is not recommended that the disinfection system be expanded due to the future peak hour flows. Separation of the chlorine gas and sulfur dioxide gas systems should be provided, as they are not compatible. 8. High Strength Waste The high strength waste system should be provided with an automated screening system to replace the manual bar rack. This would remove more undesirable trash and rocks, and improve Operator efficiency. The City of Kiel will evaluate screening alternatives as a separate maintenance project, and not part of the Wastewater Treatment Facility upgrade. Flow monitoring of incoming loads should be provided, along with consideration of an automated card reader to permit only authorized users to unload, quantify the amount / type of waste received, and facilitate billing. Dedicated pumps to feed high strength waste to the digester and/or Headworks, and septage/holding tank wastes to the Headworks, should also be considered. D. SOLIDS TRAIN TREATMENT ALTERNATIVES 1. Anaerobic Digesters Optimization of the biogas produced is currently underway via a project funded in part by the Focus On Energy program. A biogas conditioning system and a 280 kw engine / generator have been purchased utilizing a Focus On Energy grant. The resultant project will reduce electrical costs and heating costs associated with the digesters. The project is selffunded without the use of Clean Water Fund (CWF) financing, and is not increasing user rates charged to customers. The engine/generator can utilize up to 73 scfm of biogas. To produce this volume of biogas, additional sources of high strength waste will be received at the Wastewater Treatment Facility. CHAPTER VI ALTERNATIVES EVALUATION & PRELIMINARY SCREENING Wastewater Treatment System Facilities Plan CITY OF KIEL Calumet & Manitowoc Counties, Wisconsin Chapter VI 5
201 To produce sufficient volumes of biogas on a daily basis for operation of the engine / generator, the anaerobic digestion process will need to be optimized. With additional High Strength Waste (HSW) volume required in the future, limited space is available within the digesters. To maximize the space available, both digesters will be operated as primary digesters, and consideration should be given to pumping only primary sludge and high value waste streams to the process. Current practice includes co thickening WAS in the primary clarifiers. The resultant primary sludge is typically 1.5% to 2.5% total solids. Continuing to co thicken WAS in the future results in a significant portion of the digester capacity unavailable for a more desirable HSW stream. The maximum month digester Hydraulic Retention Time (HRT) is projected to be less than 14 days with continued co thickening WAS and no additional HSW added. Mechanically thickening the WAS stream prior to digestion would reduce the volume and increase the digester HRT, leaving a small increase in volume available for HSW. However, mechanically thickening WAS and anaerobically digesting WAS has disadvantages: Only a small increase in digester volume is made available. Significant costs are associated with thickening equipment, pumps, polymer system, and tankage. A building enclosing the equipment is required for protection from the elements. Formation of struvite, which has previously caused pipe plugging, will continue. Phosphorus removed in the Enhanced Biological Phosphorus Removal (EBPR) process will be released, requiring removal again. Completely removing the WAS stream from the anaerobic digestion process increases the HRT, maximizing room in the digesters for additional HSW streams for biogas production. Therefore, the continuation of anaerobically digesting WAS will be dropped from further consideration. Treatment alternatives instead will consider thickening WAS while keeping it aerobic, and combining it with anaerobically digested primary sludge and HSW streams. The combined sludges will be thickened and sent to a dewatering step, followed by a Class A stabilization process. Both digester covers are in need of replacement. membrane type gas holding covers may be considered. Steel gas holding covers versus Due to limited room on the site, rooftop linear motion mixers will be provided on each digester cover. A new Digester Equipment Room will be constructed to enclose recirculation and transfer pumps and heat exchanger equipment. The existing flare will be relocated to provide the necessary setback distance. New instrumentation will be provided to optimize operation of the digestion and gas utilization systems. CHAPTER VI ALTERNATIVES EVALUATION & PRELIMINARY SCREENING Wastewater Treatment System Facilities Plan CITY OF KIEL Calumet & Manitowoc Counties, Wisconsin Chapter VI 6
202 Structural cracks and brick maintenance are required on the digester exterior walls. Insulated wall panels may be an option in lieu of brick maintenance for a long term repair. The City of Kiel intends to address this issue separately, and not include it in the treatment system upgrade process. 2. Thickening The existing sludge holding tanks provide a location to store WAS and anaerobically digested sludge prior to dewatering. To optimize the sludge handling systems downstream, thickening will be provided. Gravity Belt Thickeners (GBT s), drum thickeners, centrifuges and membranes could be considered for thickening. However, the sludge holding tanks are currently set up for decanting. A solids concentration of 2% is achievable via the decanting option. The additional thickening of the sludge with a mechanical process does not provide significant benefit when coupled with a dewatering step. Therefore, until such point in time that additional storage volume is required, thickening will not be provided. 3. Dewatering Space limitations in the area currently occupied by the 2 meter belt press preclude using the same technology in the future, when redundant units are provided. Screw press technology and centrifuges, which have a smaller footprint, will be considered for dewatering. 4. Class A Process For as long as it is serviceable, continued use of the existing pasteurization process is recommended, as the basic infrastructure is in place, and a readily stackable and disposable biosolids product is produced. Presently, power plant bottom ash is added in excess of that required for stabilization in order to produce a stackable biosolids product. There is no cost to the City to acquire the bottom ash. When combined in the pasteurization process, the volume of cake produced is doubled. This results in a need to expand the Biosolids Storage Facility in the future should the RDP process be continued. In the event the pasteurization process becomes no longer serviceable, alternative technologies, such as dryers, should be considered, as they also can produce a stackable, readily disposable product. Belt dryers, which utilize hot air, will be considered, as they fit within the space limitations of the existing Solids Handling Building. The resultant Class A process with a dry solids content in excess of 90% will allow continued use of the existing Storage Facility without the need for expansion. The December 2014 City of Kiel Wastewater Treatment Facility Master Plan, prepared by Donohue, evaluated dryers versus the current RDP system. Based on the Total Present Worth and other advantages of a dryer, compared to the lime stabilization systems, the dryer system was recommended for the future Class A process. CHAPTER VI ALTERNATIVES EVALUATION & PRELIMINARY SCREENING Wastewater Treatment System Facilities Plan CITY OF KIEL Calumet & Manitowoc Counties, Wisconsin Chapter VI 7
203 Additionally, continued use of systems utilizing lime or fly ash will likely result in premature equipment failures and corrosion due to lime/ash dust, which is air borne. Treatment Facility Staff has experienced stand by blowers that have the rotary lobes locked in place due to corrosion, which is due to air borne dust from the existing Class A system. To avoid future issues related to dust control and the need to expand the Cake Storage Facility, systems utilizing lime or ash will be dropped from future consideration. Like the 2014 Master Plan, we concur with the recommendation of a dryer for the Class A process. Optimization of the biosolids processing systems will include extending the hours of operation during a 3 or 4 day work week. By operating the systems beyond a typical 8 hour day, the size of the equipment can be reduced and start up/shut down inefficiencies minimized. E. SUMMARY OF ALTERNATIVES Primary clarifiers will be refurbished, including new mechanisms and drives. Weirs and baffles will be replaced, and new dedicated Positive Displacement (P.D.) sludge pumps will be provided for each clarifier. Expanding the activated sludge process to include an additional treatment cell per each of the three (3) trains, and two (2) new 40 foot diameter final clarifiers is Option #1. Retrofitting the existing trains with IFAS and adding the two (2) final clarifiers is Option #2. Option #3 utilizes MBR technology installed in the last cell of the south train, along with modifications to the north trains; no clarifiers are required for Option #3. Increases in hydraulic capacity from the primary clarifiers to the activated sludge tanks, and from the activated sludge tanks to the downstream process, are included in all options. Air main replacement and new aeration blowers are also included in each option. New sludge pumps are required for each option, as well. Replacement of the existing filters with disk type filters is required for activated sludge Options #1 and #2. MBR technology does not require filters. Separation of the chlorine gas and sulfur dioxide gas systems is required for all options. Dedicated pumping of HSW and septage will be provided to direct flow to the Headworks and/or anaerobic digesters. Additional space will be added to the existing Administration Building garage area to accommodate a growing need for maintenance and storage of vehicles and equipment. The anaerobic digesters will be upgraded with new covers and mixers, an additional boiler heat exchanger, dedicated sludge pumps, and optimized for use with the Combined Heat & Power (CHP) system. CHAPTER VI ALTERNATIVES EVALUATION & PRELIMINARY SCREENING Wastewater Treatment System Facilities Plan CITY OF KIEL Calumet & Manitowoc Counties, Wisconsin Chapter VI 8
204 The use of centrifuges or screw presses will be evaluated for dewatering biosolids. The existing RDP system will be utilized for the Class A process until such time it is no longer serviceable. At this time, replacement of the RDP pasteurization system with a belt dryer will be considered. Electrical and control systems throughout the Wastewater Treatment Facility will be upgraded. The Supervisory Control & Data Acquisition (SCADA) system will also receive an upgrade to current technology. F. PROPOSED DESIGN CRITERIA Proposed criteria for individual unit processes are summarized in Table VI 1. Table VI 1 PROPOSED WASTEWATER TREATMENT FACILITY DESIGN CRITERIA Design Year INFLUENT PUMPING (River Road Lift Station) Number Of Pumps Capacity, each pump, gpm Station Firm Capacity, mgd Type Of Pump INFLUENT SCREENING Number Of Units Type Capacity, each unit, mgd Clear Opening, inch GRIT REMOVAL Type Of Unit Number Of Units Capacity, each unit, mgd PRIMARY CLARIFIERS Number Of Units Diameter, each unit, feet Sidewater (SWD) Depth, each unit, feet Surface Overflow Rate, gpd/sq.ft. Average Flow, 1.34 mgd Peak Hour Flow, 5.06 mgd Weir Loading Rate, gpd/ft. Average Flow, 1.34 mgd Detention Time, hours Average Flow, 1.34 mgd Maximum Day Flow, 3.85 mgd Removal Efficiencies BOD, % SS, % TKN Primary Sludge, lbs./day Average Day Maximum 30 Day Proposed Design , Dry Pit Immersible 2 Spiral 4.30 ¼ Aerated @28 2@ @1,089 2@4,114 2@4,542 2@2.0 2@ ,482 5,088 CHAPTER VI ALTERNATIVES EVALUATION & PRELIMINARY SCREENING Wastewater Treatment System Facilities Plan CITY OF KIEL Calumet & Manitowoc Counties, Wisconsin Chapter VI 9
205 Table VI 1 PROPOSED WASTEWATER TREATMENT FACILITY DESIGN CRITERIA Design Year PRIMARY CLARIFIERS (continued) Volatile Sludge, lbs./day Average Day (78% VSS) Maximum 30 Day (78% VSS) Primary Sludge, x% solids Average Day Maximum 30 Day SECONDARY TREATMENT SYSTEM Design Loadings To Secondary, lbs./day Biochemical Oxygen Demand (BOD) Average Day Maximum Day Maximum 30 Day Total Kjeldahl Nitrogen (TKN) (includes sidestreams), lbs./day Average Day Maximum Day Maximum 30 Day Phosphorus (P), lbs./day Average Day Maximum Day Maximum 30 Day Existing Aeration Tanks, size, ft. Proposed Aeration Tanks, size, ft. SWD, ft. Total Tank Volume, cu.ft. Anoxic Selector, ft. Anoxic Volume, cu.ft. Anoxic / Aerobic Ratio Aerobic Volume, cu.ft. BOD Loading, lbs./1,000 cu.ft. Average Day Maximum 30 Day Design MLSS, mg/l Average Maximum Month Design F:M Average Design Sludge Retention Time (SRT), Days Average Volatile Solids, % Total Sludge Production, lbs. SS/lb. BOD Secondary Sludge, lbs./day Average Maximum 30 Day WAS To Dewatering, 1% Average Maximum Month Oxygen Requirements, 1.1 lb. O2/lb. Proposed Design ,716 3, ,917 20,336 6,806 17,253 8, ,783 1, @65x32 + 3@64x28 2@65x32 + 1@64x ,312 2@40x32 + 1@48x28 51, ,792 CHAPTER VI ALTERNATIVES EVALUATION & PRELIMINARY SCREENING Wastewater Treatment System Facilities Plan CITY OF KIEL Calumet & Manitowoc Counties, Wisconsin Chapter VI ,275 3, % ,560 5,873 54,676 70,420
206 Table VI 1 PROPOSED WASTEWATER TREATMENT FACILITY DESIGN CRITERIA Design Year SECONDARY TREATMENT SYSTEM (continued) BOD Applied & 4.6 lb. O2/lb. TKN Applied Average Day Maximum Day Maximum Month Air Requirements, scfm Average Day Maximum Day Maximum Month Blowers Number of Existing PD Blowers Capacity, each existing unit, scfm Number Of New PD Blowers Capacity, each new unit, scfm Discharge Pressure, psig Firm Capacity, scfm SECONDARY CLARIFIERS Number Of Units Diameter, ft. SWD, ft. Surface Settling Rate, gpd/sq.ft. Average Flow, 1.24 mgd Peak Hour Flow, 4.96 mgd Weir Loading, gpd/ft. Average Flow, 1.24 mgd Peak Hour Flow, 4.96 mgd Detention Time, hours Average Flow, 1.24 mgd Peak Hour Flow, 4.96 mgd Solids Loading, lbs./hour/sq.ft. Average Flow, 1.24 mgd Peak Hour Flow, 4.96 mgd FILTERS Filtration Rate, gpm/sq.ft. Average Flow, 1.24 mgd (firm) Peak Hour Flow, 4.96 mgd (firm) DISINFECTION Number Of Tanks Total Volume, gallons Detention Time, minutes Average Flow, 1.24 mgd Peak Hour Flow, 4.96 mgd ANAEROBIC DIGESTION Number Of Digesters Primary Secondary Diameter, feet Proposed Design ,052 27,180 15,345 4,075 11,348 5, , , , @ ,396 5, , @45 CHAPTER VI ALTERNATIVES EVALUATION & PRELIMINARY SCREENING Wastewater Treatment System Facilities Plan CITY OF KIEL Calumet & Manitowoc Counties, Wisconsin Chapter VI 11

207 Table VI 1 PROPOSED WASTEWATER TREATMENT FACILITY DESIGN CRITERIA Design Year ANAEROBIC DIGESTION (continued) Maximum SWD, feet North Digester South Digester Maximum Volume, gallons North Digester South Digesters Total Mixing System Cover Type North Digester South Digester Maximum Month HRT, days North Digester South Digester Total Digestion Capacity, gpd Maximum Month VSS Loading, lbs. VSS/KCF VSS Destruction, % Heat Exchanger Capacity, gpd Sludge To Dewatering, lbs./day Average Maximum Month Anaerobic Sludge To Dewatering, 1% Average Maximum Month SLUDGE HOLDING TANKS Number Of Tanks Size, ft. Volume, gallons, each Volume, gallons, total Solids, % After Decanting 2% Sludge From Outside Sources, gallons/week Sludge To Dewatering, lbs./day Average Maximum Month Sludge To Dewatering, 2% Average Maximum Month SLUDGE DEWATERING Number Of Units Capacity, each gpm lbs./hour Hours Of Operation/Day Average Days Of Operation/Week Cake Solids, %, minimum Proposed Design , , ,189 Linear Motion Gas Holder Gas Holder , ,000 2,396 3,329 29,717 33, x 25 x 16 SWD 185, , ,000 7,194 9,440 43,626 53, <3 20 CHAPTER VI ALTERNATIVES EVALUATION & PRELIMINARY SCREENING Wastewater Treatment System Facilities Plan CITY OF KIEL Calumet & Manitowoc Counties, Wisconsin Chapter VI 12
208 Table VI 1 PROPOSED WASTEWATER TREATMENT FACILITY DESIGN CRITERIA Design Year CLASS A DRYING PROCESS (Existing RDP System) Number Of Units Minimum % Solids Hours Of Operation/Day Days Of Operation/Week Dried Biosolids/Year, cu.yds. Stack 180 Days, ft. CLASS A DRYING PROCESS (New Dryer) Number Of Units Minimum % Solids Hours Of Operation/Day Days Of Operation/Week Dried Biosolids/Year, cu.yd. Stack 180 Days, ft. Proposed Design <3 9,147 cu.yds <3 1, W:\WP\Facility-Plan\K0015\ \Chapter VI - Alternatives Evaluation & Preliminary Screening.docx CHAPTER VI ALTERNATIVES EVALUATION & PRELIMINARY SCREENING Wastewater Treatment System Facilities Plan CITY OF KIEL Calumet & Manitowoc Counties, Wisconsin Chapter VI 13
209 APPENDIX VI 1 PEAK HOUR FLOW DATA
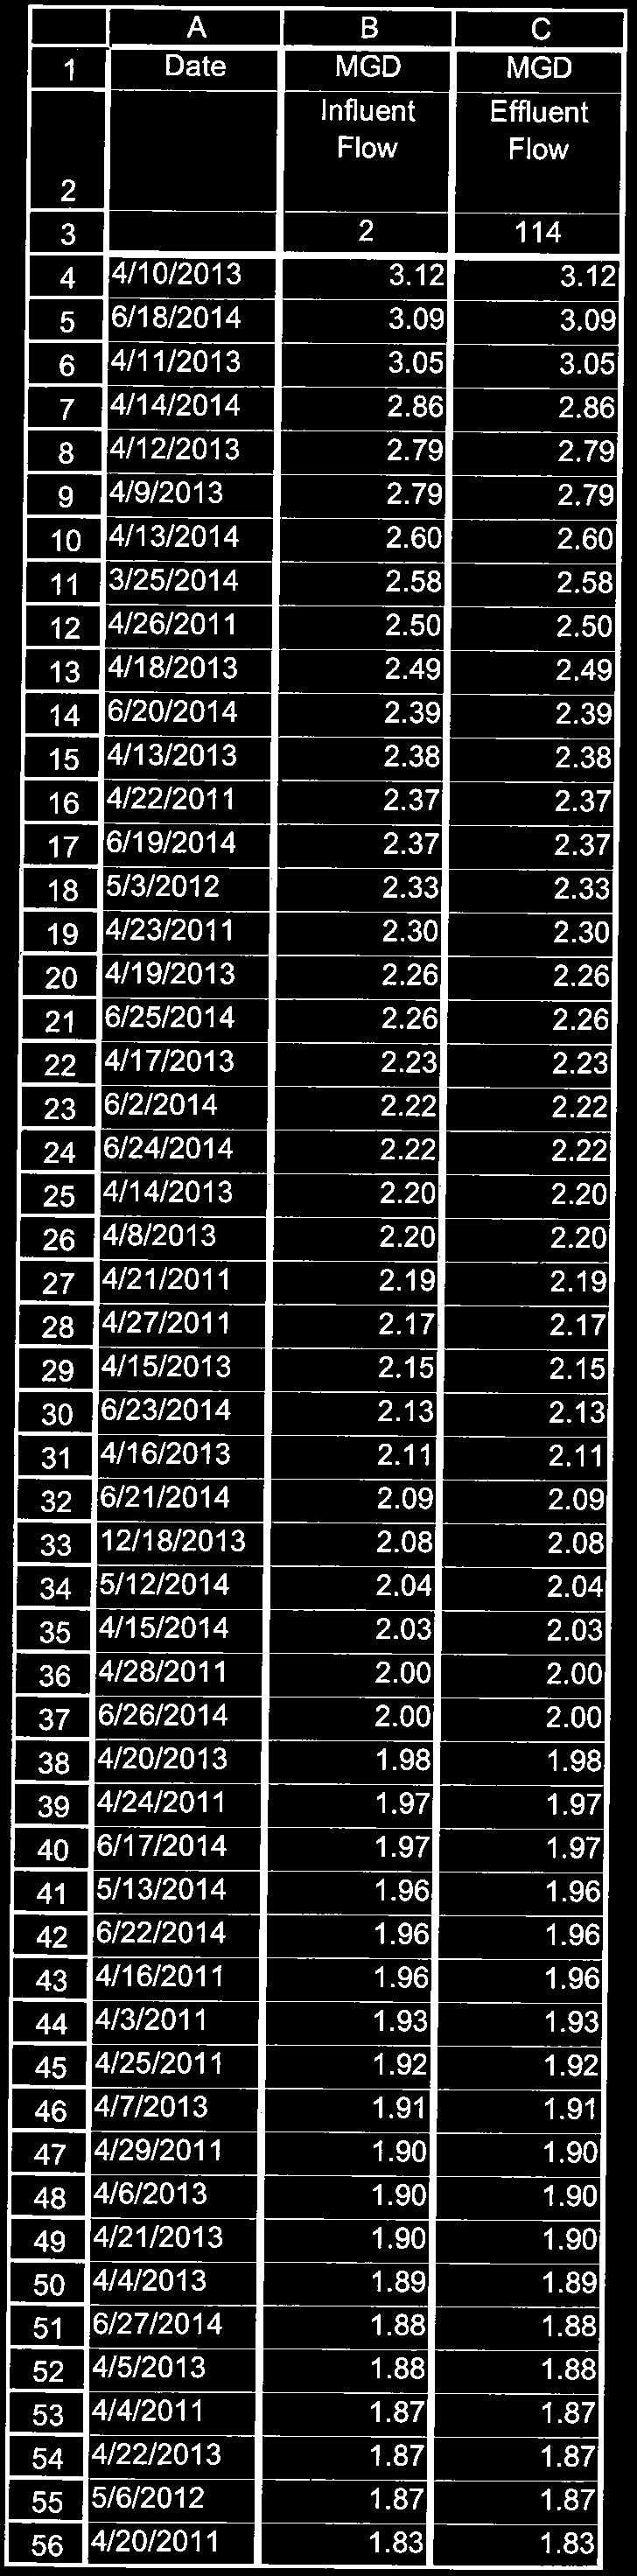
210
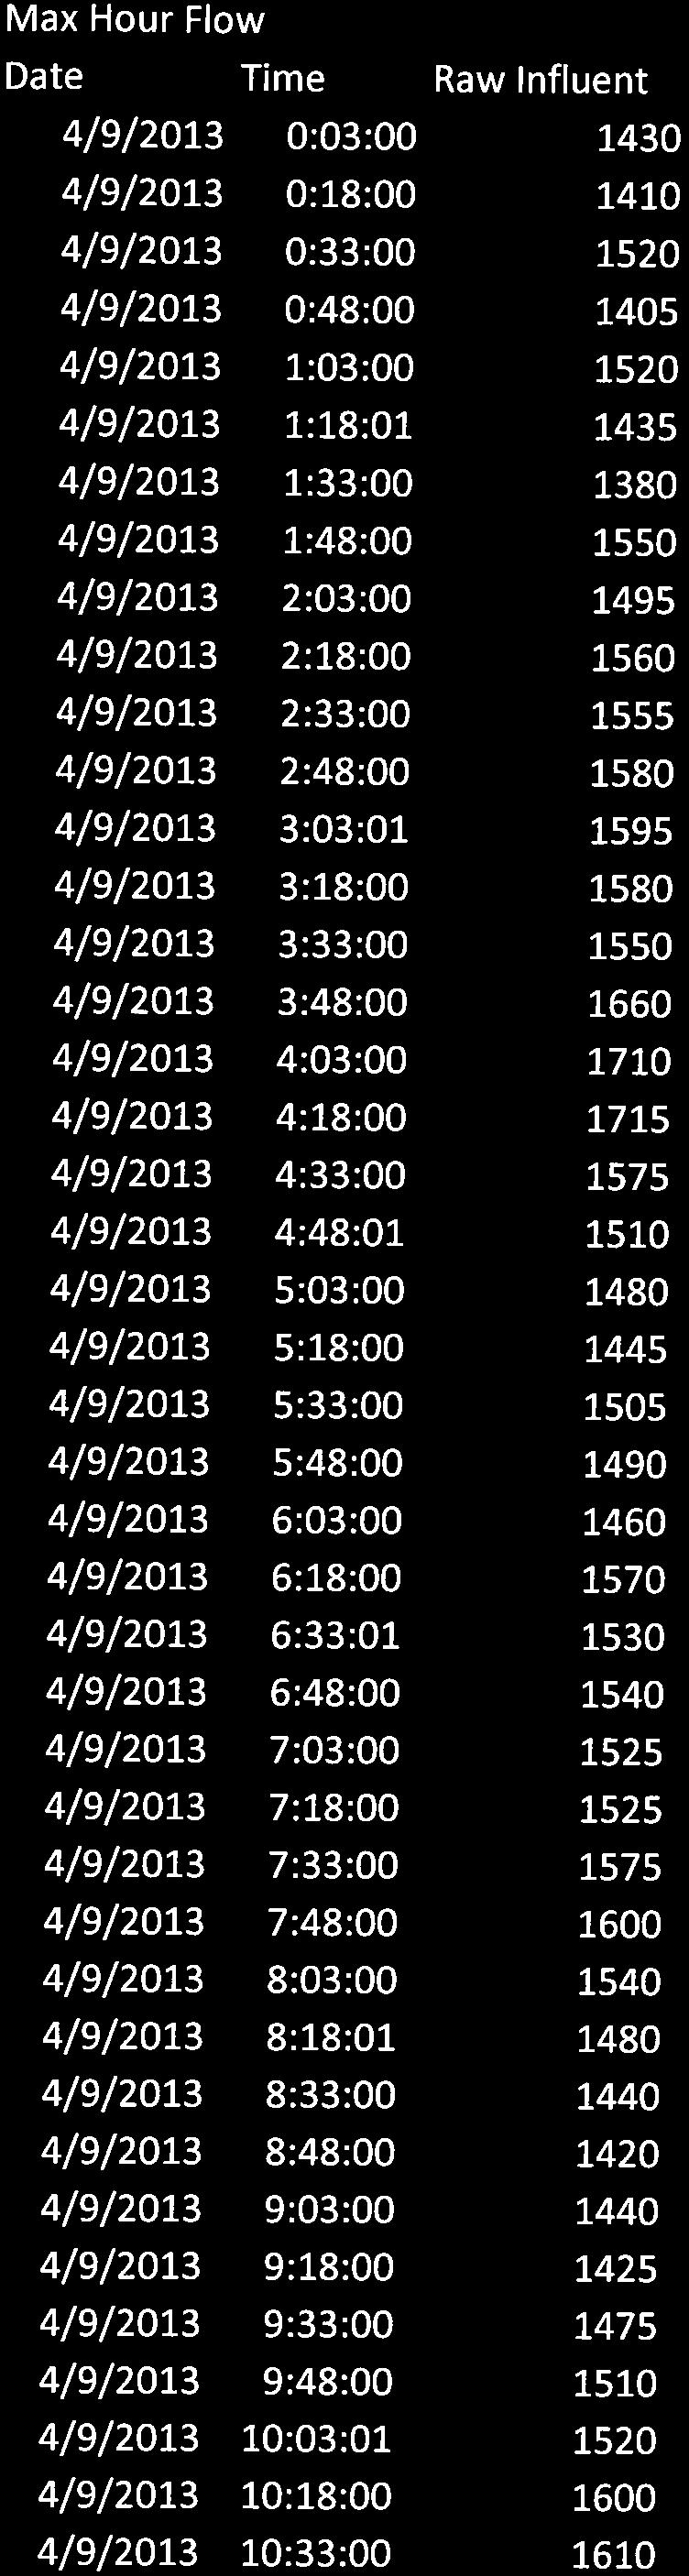
211

212
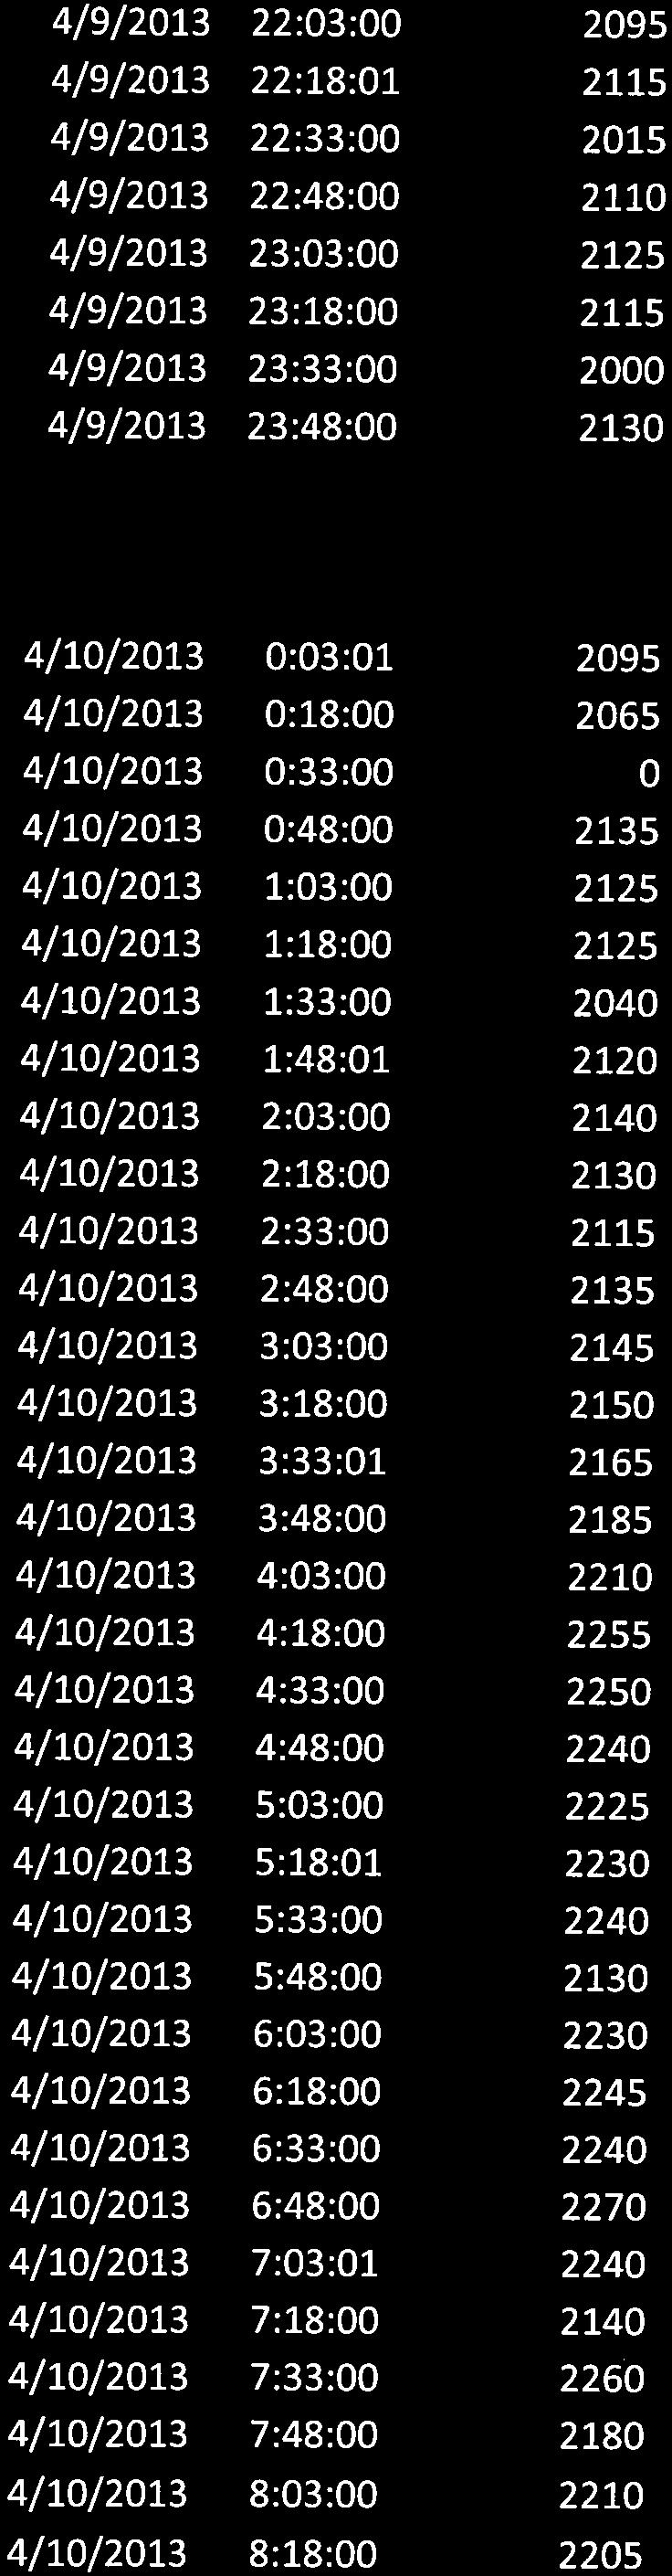
213
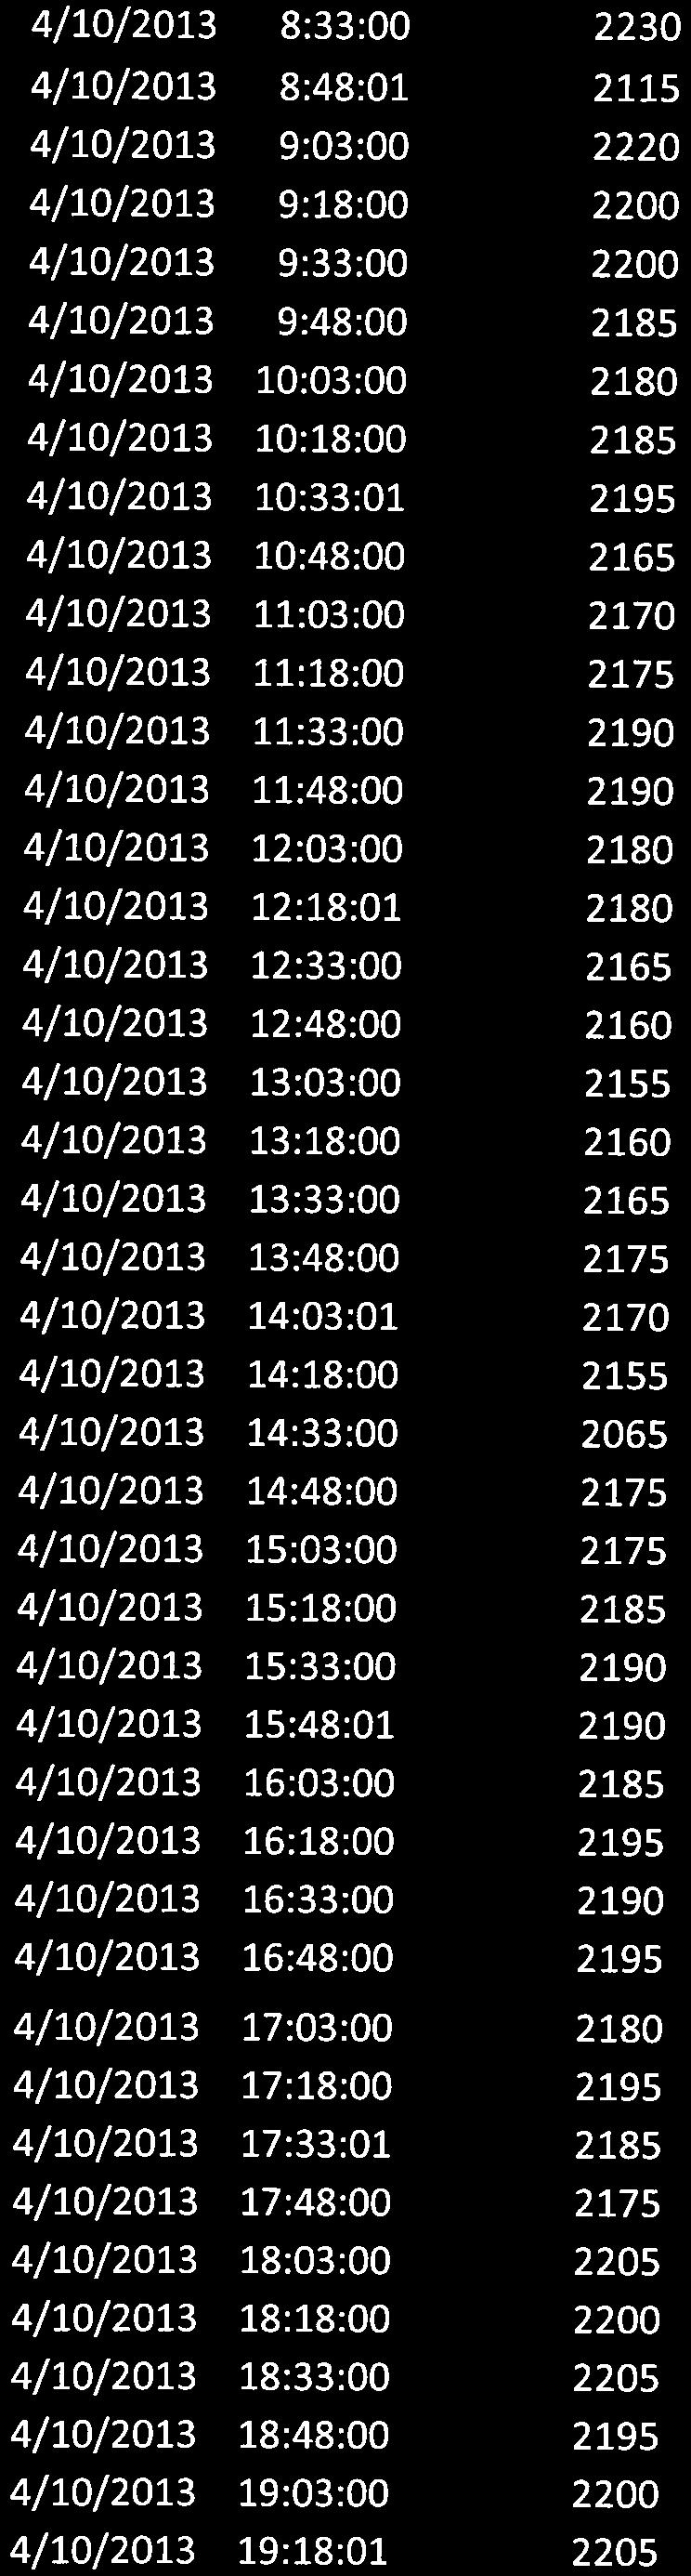
214

215
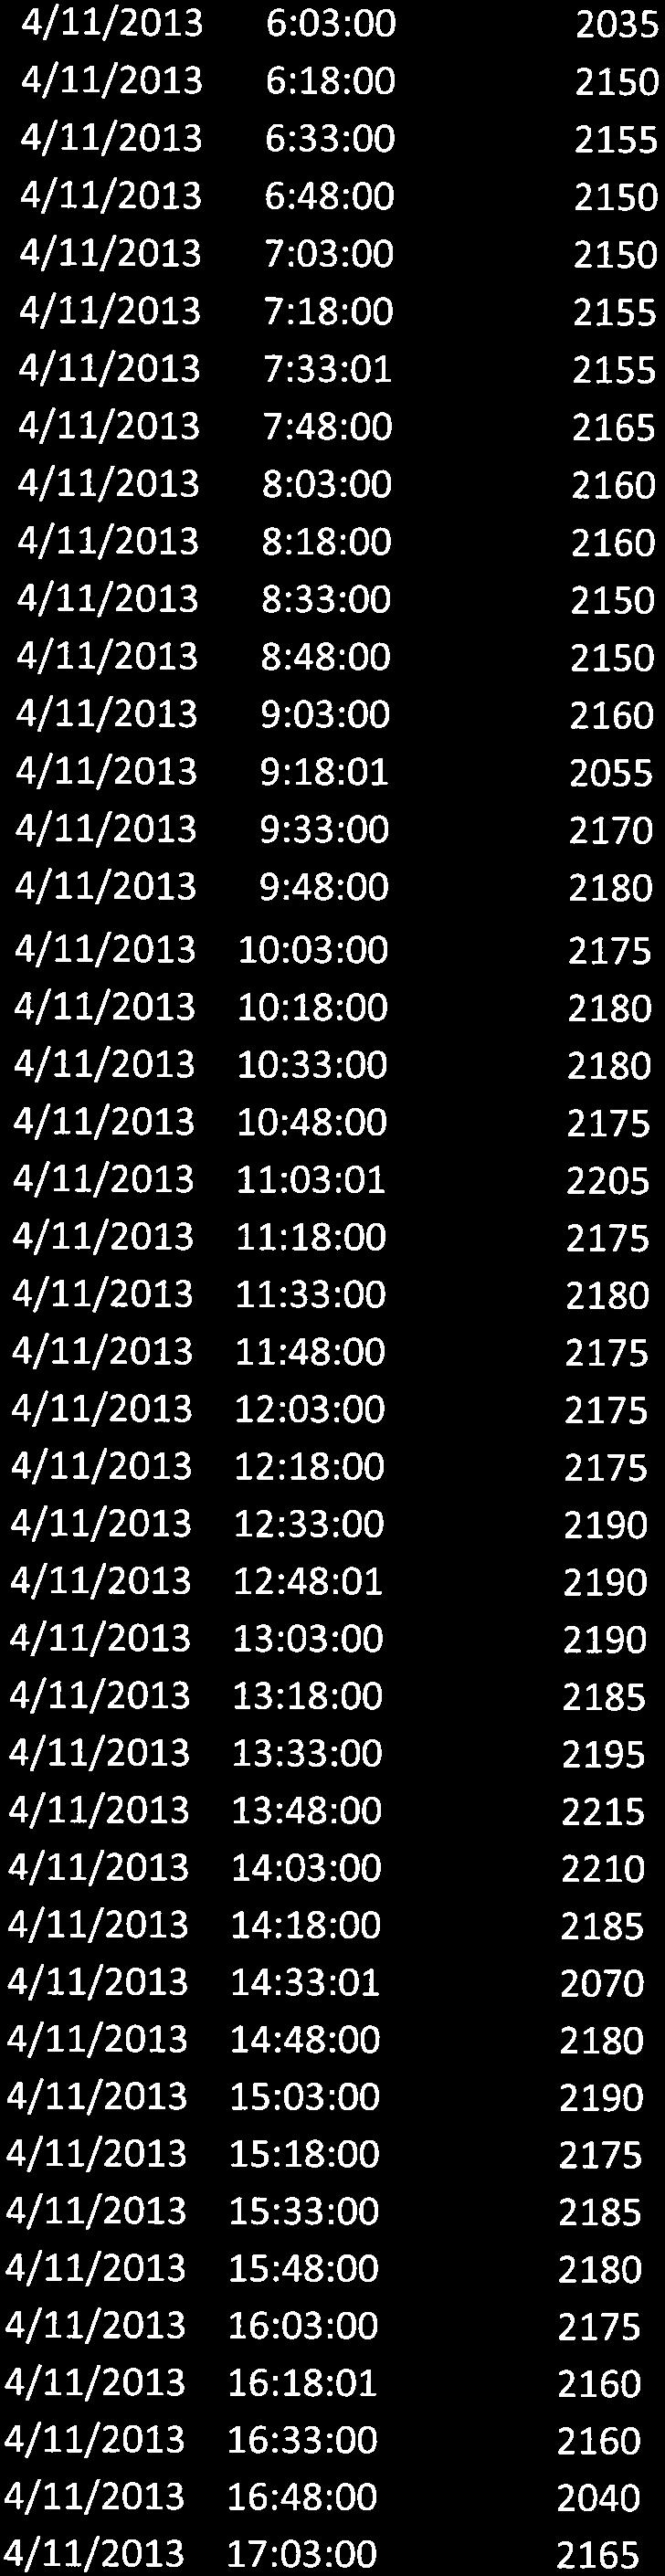
216

217
218 Chapter VII COST EFFECTIVE ANALYSIS A. INTRODUCTION Justification for selection of wastewater treatment alternatives is based upon a Cost Effective Analysis. Cost effectiveness takes into consideration both monetary and non monetary factors. Monetary factors include capital (first costs) and operation and maintenance costs over the entire planning period. Non monetary factors include such items as primary and secondary environmental effects, implementation capability (social and institutional), operability, performance, reliability and flexibility. B. COST ESTIMATING PROCEDURES Capital construction cost items used in the Cost Effective Analysis include the following: Equipment costs. Construction and installation costs, including Contractor s overhead and profit. Cost of engineering, design, field exploration, construction management, on site field representative and start up services. Cost of administration and legal services, including costs of bond sales. Interest during construction. Prices of components and installation are estimated on the basis of market prices as of the third quarter of 2015, with no allowance for inflation of wages or prices. Additional project costs (engineering, contingencies, legal, fiscal and administrative) are estimated at 30% of capital costs; which includes 15% contingencies, and 15% for engineering, legal, fiscal, administrative and interest costs. Since the Cost Effective Analysis is computed on a present worth basis, the salvage value of structure and equipment are computed on a straight line depreciation basis, if there is a use for the structure at the end of the design period and it can be demonstrated that the item can be reused. The design period over which the Cost Effective Analysis occurs is 20 years. Future replacement costs for equipment with a life expectancy of less than 20 years is also included in the analysis. CHAPTER VII COST EFFECTIVE ANALYSIS Wastewater Treatment System Facilities Plan CITY OF KIEL Calumet & Manitowoc Counties, Wisconsin Chapter VII 1
219 The useful life of the various structures and equipment is estimated according to the following: Item Useful Life Land... Permanent Wastewater Conveyance Structures (i.e., pipes, interceptors) years Structures, Tankage, Basins years Process Equipment to 20 years Auxiliary Equipment... 1 to 20 years Operation & Maintenance (O&M) costs include all annual costs (operation and maintenance, labor, equipment parts, repairs and supply costs, chemical, power and fuel costs) necessary to operate and maintain the treatment facility. The costs utilized include: Labor:... $55.00/Hour (includes fringe benefits) Electricity:... $0.07/kWH Polymer... $1.44/lb. Natural Gas:... $0.83/therm O&M Costs are based upon the design criteria for each alternative and the personnel required to operate and maintain these facilities. Annual O&M costs, future costs and salvage values are calculated to total present worth values using a discount rate of 4.625%. C. ALTERNATIVE ANALYSIS Based upon the Preliminary Screening Process, which is summarized in the previous chapter, the following alternatives will be subject to a Cost Effective Analysis: Activated Sludge Process Biosolids Dewatering 1. Activated Sludge Process a. General: The following viable alternatives for the Activated Sludge Process will be considered: 1) Expand Existing System 2) Integrated Film Activated Sludge (IFAS) 3) Membrane Bio Reactor (MBR) CHAPTER VII COST EFFECTIVE ANALYSIS Wastewater Treatment System Facilities Plan CITY OF KIEL Calumet & Manitowoc Counties, Wisconsin Chapter VII 2
220 A diagram of each activated sludge alternative is shown on Figure VII 1, Figure VII 2 and Figure VII 3. The detailed description of each alternative was previously noted in Chapter VI. b. Analysis: Table VII 1, Table VII 2 and Table VII 3 contain the Present Worth Analysis of each of the alternatives. The potential capital construction costs are summarized as follows: Option #1 Expand Existing System... $13,407,849 Option #2 IFAS... $15,297,523 Option #3 MBR... $13,412,022 The Present Worth Total of the potential capital construction costs are as follows: Option #1 Expand Existing System... $13,723,290 Option #2 IFAS... $15,634,745 Option #3 MBR... $13,627,131 The potential annual O&M costs of each alternative were estimated for comparison purposes. The potential annual O&M costs are: Option #1 Expand Existing Facilities... $617,916 Option #2 IFAS... $738,984 Option #3 MBR... $702,108 The present worth of each O&M cost is noted below: Option #1 Expand Existing Facilities... $7,951,454 Option #2 IFAS... $9,509,379 Option #3 MBR... $9,034,852 A summary of the Present Worth Total of the potential capital construction and O&M costs is presented below: Total Present Worth Option #1 Expand Existing Facilities... $21,674,745 Option #2 IFAS... $25,144,124 Option #3 MBR... $22,661,983 On a 20 year Present Worth basis, taking into account capital construction, salvage and O&M potential costs, the MBR option is within 4.5% of the expansion of the CHAPTER VII COST EFFECTIVE ANALYSIS Wastewater Treatment System Facilities Plan CITY OF KIEL Calumet & Manitowoc Counties, Wisconsin Chapter VII 3
221 existing Wastewater Treatment Facility option, and the IFAS option is 16% higher than the expansion option. c. Conclusions: 1) The expansion of the existing system is essentially equal ( $4,173) to the MBR initial construction cost, although the MBR option may have the lowest Present Worth of the capital costs. 2) The expansion of the existing system may have the lowest annual O&M and lowest Present Worth of the O&M cost. 3) The Total Present Worth for the expansion of the existing system may be 4.5% less than the MBR option and 16% less than IFAS, over a 20 year period. 4) The Wisconsin Department Of Natural Resources (DNR) considers Present Worth Values that are within 10% of each other to be essentially equal in monetary value due to normal variability in costs at the planning level. 2. Biosolids Dewatering a. General: Centrifuges and screw presses will be evaluated to determine if one method of dewatering biosolids is more cost effective than the other. Each alterative will utilize the existing sludge pumps and polymer feed systems. Each alternative will be assumed to utilize an overhead monorail system for installation and long term maintenance, and a conveyor system for transporting cake solids to the Class A process. b. Loading Rate & Operation: Both the centrifugal and screw press alternatives will be loaded at a rate of 750 lbs. /hour of solids (dry weight). Centrifuge polymer consumption is assumed to be 15 lbs./dry ton, while the screw press is assumed to utilize 20 lbs./dry ton. To process the predicted 750 lbs./hour loading rate, the required run time will be approximately 3 days while operating 24 hours/day. c. Biosolids Dewatering: A dewatered cake of 22% and 20% has been assumed for the centrifuge and screw press, respectively. The energy to remove the water and achieve 92% solids in a Class A dryer was also taken into consideration. Compared to the centrifuge, the screw press alternative will need to remove an additional 2% of water content in the Class A dryer. CHAPTER VII COST EFFECTIVE ANALYSIS Wastewater Treatment System Facilities Plan CITY OF KIEL Calumet & Manitowoc Counties, Wisconsin Chapter VII 4
222 d. Analysis: The Present Worth Analysis of the centrifuge and screw press alternatives is summarized in Table VII 4 and Table VII 5. The potential capital construction costs are summarized as follows: Centrifuge... $1,289,846 Screw Press... $1,273,635 The Present Worth Total of the potential capital construction costs are as follows: Centrifuge... $1,283,589 Screw Press... $1,267,335 The potential annual O&M costs of each alternative were estimated for comparison purposes. Costs to evaporate an additional 2% water content were added to the screw press alternative. The costs may be summarized as follows: Centrifuge... $109,638 Screw Press... $114,275 The present worth of the potential O&M cost is noted below: Centrifuge... $1,410,842 Screw Press... $1,470,511 A summary of the Present Worth Total of the potential capital construction and O&M costs is presented below: Total Present Worth Centrifuge... $2,694,431 Screw Press... $2,737,846 On a 20 year Present Worth basis, taking into account capital construction, salvage and O&M potential costs, the screw press option is within 1.6% of the centrifuge option. e. Conclusions: 1) The screw press option may have a slight advantage in capital construction and Present Worth value of those costs. CHAPTER VII COST EFFECTIVE ANALYSIS Wastewater Treatment System Facilities Plan CITY OF KIEL Calumet & Manitowoc Counties, Wisconsin Chapter VII 5
223 D. CAKE PROCESS 2) The centrifuge, if it can consistently produce a dewatered biosolids product with 2% less water content compared to the screw press, may have a slight advantage over the screw press with respect to O&M costs. 3) The Total Present Worth for the centrifuge may be 1.6% less than the screw press option over a 20 year period.\ 4) The DNR considers Present Worth Values that are within 10% of each other to be essentially equal in monetary value due to normal variability in costs at the planning level. An Opinion Of Probable Construction Costs for the Class A process utilizing a dryer is presented in Table VII 6. W:\WP\Facility Plan\K0015\ \Chapter VII Cost Effective Analysis.docx CHAPTER VII COST EFFECTIVE ANALYSIS Wastewater Treatment System Facilities Plan CITY OF KIEL Calumet & Manitowoc Counties, Wisconsin Chapter VII 6
224 Table VII 1 OPTION #1 AERATION BASIN EXPANSION CITY OF KIEL Wastewater Treatment System Facilities Plan Capital Construction Costs Service Replacement Salvage Item Life Cost Value Miscellaneous Mechanical and Structural Demolition $25,000 Tank Cleaning (Pri. Clar., AB, Sec. Clar., Digesters) $120,000 Miscellaneous Metals (grating, railing, hatches, etc.) $54, $0 $0 Painting (Digesters, Digester Bldg. Expansion, HSW Tank) $241, $0 $0 Site Work Underground Piping (20" P.E., 18" AB, 18" FE, 8" RAS) $149, $0 $74,500 Air Main Replacement (24" Main, 20" to N, 14" to S) $176, $0 $88,000 Relocate Flare $7,500 Grading and Landscaping $50, $0 $25,000 Fencing $11, $0 $5,500 Paving $197, $0 $0 Structures Primary Clarifier Repairs $27, $0 $0 Aeration Basin Repairs $5, $0 $0 North Aeration Basins (65' x 32' x 14' swd x 2) $526, $0 $263,000 Tunnel Structure/Secondary Clarifiers (2 x 40' diameter) $467, $0 $233,500 South Aeration Basin (64' x 28' x 14' swd) $291, $0 $145,500 Chlor/Dechlor Gas Storage Room Modifications $5, $0 $2,500 Digester Building Expansion $400, $0 $200,000 High Strength Waste Tank Seperation $24, $0 $12,000 Admin. Bldg. Maintenance Addition $165, $0 $82,500 Equipment Pri. Clarifier Drives, Mechanisms, Weirs, Baffles (2) $200, $0 $0 Primary Sludge Pumps (3) $75, $75,000 $0 Aeration Splitter Box Gates (3) $37, $0 $18,500 Aeration Systems (3 Basins) $135, $0 $0 New Aeration Blowers hp) $472, $0 $0 Sec. Clarifier Drives, Mechanisms, Weirs, Baffles (Typ 4) $449, $0 $0 Sec. Clarifier Launder Covers $80, $0 $0 RAS Pumps (6) $150, $150,000 $0 WAS Pumps (2) $50, $50,000 $0 Scum Pump (1) $13, $13,000 $0 Disc Filters $1,050, $0 $0 High Strength Waste Pumps (2) $26, $26,000 $0 Digester Covers and Mixers $557, $0 $0 Digester Recirc Pumps (2) $50, $50,000 $0 Boiler/Heat Exchanger $155, $0 $0 Equiment Installation (20% of Equipment) $699,800 $72,800 $0 Mechanical (Process Piping, Plumbing, HVAC) (30% Equip.) $1,049, $0 $524,850 Electrical $850, $0 $425,000 Controls and SCADA $600, $600,000 $0 Subtotal $9,639,000 $1,036,800 $2,100,350 General Conditions, Bonds, Insurance, $674,730 Total $10,313,730 $1,036,800 $2,100,350 Contingencies (15% of Total) $1,547,060 Engineering (15% of Total) $1,547,060 Grand Total $13,407,849 $1,036,800 $2,100,350 Present Worth of Total $13,723,290 $659,691 $344,249 Present Worth (P) = Future (F) x (1+i) n i = % n = 10 (Replacement) n = 40 (Salvage) (1 + i) n = (Replacement) (1 + i) n = (Salvage) Operation and Maintenance Costs Labor/Maintenance $50,000 Power $244,000 Chemical $30,000 Replacement (5% Equipment) $209,940 Parts & Supplies (2% Equipment) $83,976 Total Annual $617,916 O&M Present Worth $7,951,454 Capital Present Worth $13,723,290 Total Present Worth $21,674,745 Present Worth (P) = Annual Cost (A) x (1+n) n 1 i(1+i) n i= 4.625% n= 20 (1+i) n 1 ix(1+i) n W:\WP\Facility Plan\K0015\ \Chapter VII Cost Effective Analysis (Tables).xlsx
225 Table VII 2 OPTION #2 IFAS CITY OF KIEL Wastewater Treatment System Facilities Plan Capital Construction Costs Service Replacement Salvage Item Life Cost Value Miscellaneous Mechanical and Structural Demolition $27,000 Tank Cleaning (Pri. Clar., AB, Sec. Clar., Digesters) $120,000 Miscellaneous Metals (grating, railing, hatches, etc.) $28, $0 $0 Painting (Digesters, Digester Bldg. Expansion, HSW Tank) $241, $0 $0 Site Work Underground Piping (20" P.E., 18" AB, 18" FE, 8" RAS) $149, $0 $74,500 Air Main Replacement (24" Main, 20" to N, 14" to S) $176, $0 $88,000 Relocate Flare $7,500 Grading and Landscaping $40, $0 $20,000 Fencing $8, $0 $4,000 Paving $194, $0 $0 Structures Primary Clarifier Repairs $27, $0 $0 Aeration Basin Repairs $5, $0 $0 Tunnel Structure/Secondary Clarifiers (2 x 40' diameter) $467, $0 $233,500 Chlor/Dechlor Gas Storage Room Modifications $5, $0 $2,500 Digester Building Expansion $400, $0 $200,000 High Strength Waste Tank Seperation $24, $0 $12,000 Admin. Bldg. Maintenance Addition $165, $0 $82,500 Equipment Pri. Clarifier Drives, Mechanisms, Weirs, Baffles (Typ 2) $200, $0 $0 Primary Sludge Pumps (3) $75, $75,000 $0 Aeration Splitter Box Gates (3) $37, $0 $18,500 IFAS System $1,625, $0 $0 New Aeration Blowers 200hp) $472, $0 $0 Sec. Clarifier Drives, Mechanisms, Weirs, Baffles (Typ 4) $449, $0 $0 Sec. Clarifier Launder Covers $80, $0 $0 RAS Pumps (6) $150, $150,000 $0 WAS Pumps (2) $50, $50,000 $0 Disc Filters $1,050, $0 $0 High Strength Waste Pumps (2) $26, $26,000 $0 Digester Covers and Mixers $557, $0 $0 Digester Recirc Pumps (2) $50, $50,000 $0 Boiler/Heat Exchanger $155, $0 $0 Equiment Installation (20% of Equipment) $995,200 $70,200 $0 Mechanical (Process Piping, Plumbing, HVAC) (30% Equip.) $1,492, $0 $746,400 Electrical $850, $0 $425,000 Controls and SCADA $600, $600,000 $0 Subtotal $10,997,500 $1,021,200 $1,906,900 General Conditions, Bonds, Insurance, $769,825 Total $11,767,325 $1,021,200 $1,906,900 Contingencies (15% of Total) $1,765,099 Engineering (15% of Total) $1,765,099 Grand Total $15,297,523 $1,021,200 $1,906,900 Present Worth of Total $15,634,745 $649,765 $312,542 Present Worth (P) = Future (F) x (1+i) n i = % n = 10 (Replacement) n = 40 (Salvage) (1 + i) n = (Replacement) (1 + i) n = (Salvage) Operation and Maintenance Costs Labor/Maintenance $50,000 Power $241,000 Chemical $30,000 Replacement (5% Equipment) $298,560 Parts & Supplies (2% Equipment) $119,424 Total Annual $738,984 O&M Present Worth $9,509,379 Capital Present Worth $15,634,745 Total Present Worth $25,144,124 Present Worth (P) = Annual Cost (A) x (1+n) n 1 i(1+i) n i= 4.625% n= 20 (1+i) n 1 ix(1+i) n W:\WP\Facility Plan\K0015\ \Chapter VII Cost Effective Analysis (Tables).xlsx
226 Table VII 3 OPTION #3 MBR's CITY OF KIEL Wastewater Treatment System Facilities Plan Capital Construction Costs Service Replacement Salvage Item Life Cost Value Miscellaneous Mechanical and Structural Demolition $21,000 Tank Cleaning (Pri. Clar., AB, Digesters) $100,000 Painting (Digesters, Digester Bldg. Expansion, HSW Tank) $241, $0 $0 Site Work Underground Piping (20" P.E., 20" FE, 16" RAS, 6" WAS) $69, $0 $34,500 Air Main Replacement (24" and 16" Main) $40, $0 $20,000 Relocate Flare $7,500 Grading and Landscaping $40, $0 $20,000 Paving $187, $0 $0 Structures Primary Clarifier Repairs $27, $0 $0 Aeration Basin Repairs $5, $0 $0 Aeration Basin Modifications $20, $0 $10,000 MBR Equipment Building $150, $0 $75,000 Chlor/Dechlor Gas Storage Room Modifications $5, $0 $2,500 Digester Building Expansion $400, $0 $200,000 High Strength Waste Tank Seperation $24, $0 $12,000 Admin. Bldg. Maintenance Addition $165, $0 $82,500 Equipment Replace Fine Screen Baskets $15, $0 $0 Pri. Clarifier Drives, Mechanisms, Weirs, Baffles (Typ 2) $200, $0 $0 Primary Sludge Pumps (3) $75, $75,000 $0 Aeration Splitter Box Gates (3) $37, $0 $18,500 MBR Equipment $2,850, $0 $0 Aeration Systems (2 Trains) $100, $0 $0 New Aeration Blowers 200hp) $472, $0 $0 High Strength Waste Pumps (2) $26, $26,000 $0 Digester Covers and Mixers $557, $0 $0 Digester Recirc Pumps (2) $50, $50,000 $0 Boiler/Heat Exchanger $155, $0 $0 Equiment Installation (20% of Equipment) $907,400 $30,200 $0 Mechanical (Process Piping, Plumbing, HVAC) (30% Equip.) $1,361, $0 $680,550 Electrical $780, $0 $390,000 Controls and SCADA $555, $555,000 $0 Subtotal $9,642,000 $736,200 $1,545,550 General Conditions, Bonds, Insurance, $674,940 Total $10,316,940 $736,200 $1,545,550 Contingencies (15% of Total) $1,547,541 Engineering (15% of Total) $1,547,541 Grand Total $13,412,022 $736,200 $1,545,550 Present Worth of Total $13,627,131 $468, $253, Present Worth (P) = Future (F) x (1+i) n i = % n = 10 (Replacement) n = 40 (Salvage) (1 + i) n = (Replacement) (1 + i) n = (Salvage) Operation and Maintenance Costs Labor/Maintenance $50,000 Power $238,000 Chemical $33,000 Replacement (5% Equipment) $272,220 Parts & Supplies (2% Equipment) $108,888 Total Annual $702,108 O&M Present Worth $9,034,852 Capital Present Worth $13,627,131 Total Present Worth $22,661,983 Present Worth (P) = Annual Cost (A) x (1+n) n 1 i(1+i) n i= 4.625% n= 20 (1+i) n 1 ix(1+i) n W:\WP\Facility Plan\K0015\ \Chapter VII Cost Effective Analysis (Tables).xlsx
227 Table VII 4 OPTION #4 CENTRIFUGE OPTION CITY OF KIEL Wastewater Treatment System Facilities Plan Capital Construction Costs Service Replacement Salvage Item Cost Life Cost Value Miscellaneous Demolition $25,000 Equipment Centrifuge Equipment (Including Polymer Feed) $500, $0 $0 Grinders $28, $0 $0 Conveyor Equipment $60, $0 $0 Monorails, Bridge Beam, and Hoist $30, $0 $15,000 Equiment Installation (30% of Equipment) $185,400 Mechanical (Process Piping and Valves) (7.5% of Equipment) $46, $23,175 Electrical, Controls, and SCADA (8.5% of Equipment) $52, Subtotal $927,280 $0 $38,175 General Conditions $64,910 Total $992,190 $0 $38,175 Contingencies (15% of Total) $148,828 Engineering (15% of Total) $148,828 Grand Total $1,289,846 $0 $38,175 Present Worth of Total $1,283,589 $0 $6,257 Present Worth (P) = Future (F) x (1+i) n i = % n = 10 (Replacement) n = 40 (Salvage) (1 + i) n = (Replacement) (1 + i) n = (Salvage) Operation and Maintenance Costs Labor/Maintenance $13,300 Power $11,800 Chemical $28,300 Replacement (5% of Equipment) $40,170 Parts & Supplies (2% of Equipment) $16,068 Additional Class 'A' Costs $0 Total Annual $109,638 O&M Present Worth $1,410,842 Capital Present Worth $1,283,589 Total Present Worth $2,694,431 Present Worth (P) = Annual Cost (A) x (1+n) n 1 i(1+i) n i= 4.625% n= 20 (1+i) n 1 ix(1+i) n W:\WP\Facility Plan\K0015\ \Chapter VII Cost Effective Analysis (Tables).xlsx
228 Table VII 5 OPTION #5 SCREW PRESS OPTION CITY OF KIEL Wastewater Treatment System Facilities Plan Capital Construction Costs Service Replacement Salvage Item Cost Life Cost Value Miscellaneous Demolition $25,000 Equipment Screw Press Equipment (Including Polymer Feed) $570, $0 $0 Conveyor Equipment $25, $0 $0 Monorails, Bridge Beam, and Hoist $30, $0 $15,000 Equiment Installation (30% of Equipment) $187,500 Mechanical (Process Piping, Plumbing and HVAC) (7.5% Eqnt) $46, $0 $23,438 Electrical, Controls, and SCADA (5% of Equipment) $31, $0 $0 Subtotal $915,625 $0 $38,438 General Conditions $64,094 Total $979,719 $0 $38,438 Contingencies (15% of Total) $146,958 Engineering (15% of Total) $146,958 Grand Total $1,273,635 $0 $38,438 Present Worth of Total $1,267,335 $0 $6,300 Present Worth (P) = Future (F) x (1+i) n i = % n = 10 (Replacement) n = 40 (Salvage) (1 + i) n = (Replacement) (1 + i) n = (Salvage) Operation and Maintenance Costs Labor/Maintenance $6,900 Power $900 Chemical $37,700 Replacement (5% of Equipment) $40,625 Parts & Supplies (2% of Equipment) $16,250 Additional Class 'A' Costs $11,900 Total Annual $114,275 O&M Present Worth $1,470,511 Capital Present Worth $1,267,335 Total Present Worth $2,737,846 Present Worth (P) = Annual Cost (A) x (1+n) n 1 i(1+i) n i= 4.625% n= 20 (1+i) n 1 ix(1+i) n W:\WP\Facility Plan\K0015\ \Chapter VII Cost Effective Analysis (Tables).xlsx
229 Table VII 6 OPTION #6 SLUDGE DRYER CITY OF KIEL Wastewater Treatment System Facilities Plan Capital Construction Costs Item Cost Equipment Sludge Drying Equipment $2,900,000 Equiment Installation (25% of Equipment) $725,000 Mechanical (Process Piping, Plumbing and HVAC) (15% Eqnt) $435,000 Electrical, Controls, and SCADA (10% of Equipment) $290,000 Subtotal $4,350,000 General Conditions $304,500 Total $4,654,500 Contingencies (10% of Total) $465,450 Engineering (10% of Total) $465,450 Grand Total $5,585,400 W:\WP\Facility Plan\K0015\ \Chapter VII Cost Effective Analysis (Tables).xlsx
230 NEW FINAL CLARIFIER NEW FINAL CLARIFIER PUMP ROOM NEW GATES FLARE FUTURE CLASS A DRYER DEWATERING NEW DIGESTER BUILDING FILTERS NEW DIGESTER COVERS/MIXERS MAINTENANCE/ STORAGE FIGURE VII-1 EXPAND EXISTING SYSTEM FACILITIES PLANNING CITY OF KIEL, WISCONSIN McM #K /13/2015 ID: PPT\2015\MCM WI\KIEL WWTF PLANNING SITE PLAN ALTERNATES.PPTX TJK:JMK
231 NEW FINAL CLARIFIER NEW FINAL CLARIFIER PUMP ROOM NEW GATES FLARE FUTURE CLASS A DRYER NEW DIGESTER BUILDING DEWATERING FILTERS NEW DIGESTER COVERS/MIXERS MAINTENANCE/ STORAGE FIGURE VII-2 IFAS FACILITIES PLANNING CITY OF KIEL, WISCONSIN McM #K /13/2015 ID: PPT\2015\MCM WI\KIEL WWTF PLANNING SITE PLAN ALTERNATES.PPTX TJK:JMK

232 PERMEATE PUMPS AND BLOWERS MEMBRANE REACTORS SPLITTER BOX NEW GATES FLARE FUTURE CLASS A DRYER DEWATERING NEW DIGESTER BUILDING NEW DIGESTER COVERS/MIXERS FINE SCREEN BASKETS MAINTENANCE/ STORAGE FIGURE VII-3 MBR FACILITIES PLANNING CITY OF KIEL, WISCONSIN McM #K /13/2015 ID: PPT\2015\MCM WI\KIEL WWTF PLANNING SITE PLAN ALTERNATES.PPTX TJK:JMK
233 A. INTRODUCTION Chapter VIII ENVIRONMENTAL SITE ASSESSMENT The potential impacts associated with the construction of Wastewater Treatment Facility Improvements for the City of Kiel Wastewater Treatment Facility are discussed in this chapter. Environmental impacts are put into categories of primary and secondary impacts. Primary impacts result directly from construction activities and facility operations. Secondary impacts are indirect, and occur because the project causes changes that induce actions that would not occur without the project. A third category is that of unavoidable, adverse impacts. The proposed Treatment Facility improvements project will be confined to the existing Wastewater Treatment Facility site, and public roads by which the facility is accessed. 1. Noise, Odor & Aesthetics Construction of improvements at the City of Kiel Wastewater Treatment Facility will inevitably generate some dust. Fumes, dust and noise will be a short term impact from truck travel and heavy machinery associated with construction activities. These short term impacts may be a nuisance to residents living near the activities and along truck routes. Mitigation of these impacts will be discussed in the Mitigation of Impacts section of this chapter. A short term aesthetic impact will also be associated with construction of Treatment Facility improvements. It should be noted that there are no residential properties adjacent to the Treatment Facility site. 2. Erosion & Sedimentation Soils exposed during construction will be subject to accelerated erosion until the surface is re vegetated. Erosion will be mitigated by Best Management construction practices for erosion control, as appropriate for the Treatment Facility site. 3. Surface Water Erosion control will be provided, as necessary, to protect nearby surface water from sedimentation due to runoff during construction at the Treatment Facility site. Appendix VIII 1 contains the floodplain mapping indicating the Wastewater Treatment Facility site is outside the 100 year floodplain. CHAPTER VIII ENVIRONMENTAL SITE ASSESSMENT Wastewater Treatment System Facilities Plan CITY OF KIEL Calumet & Manitowoc Counties, Wisconsin Chapter VIII 1
234 4. Groundwater There is groundwater approximately 15 feet below grade at the Treatment Facility site. Dewatering may be required when excavating for new below ground structures at the Treatment Facility site. However, no significant long term impacts are expected as a result of construction. 5. Wetlands Construction of improvements at the City of Kiel Wastewater Treatment Facility will be confined to the existing Treatment Facility site. Therefore, there are no anticipated impacts on wetland areas. Appendix VIII 2 contains a wetlands map of the area surrounding the Wastewater Treatment Facility site, confirming there are no affected wetlands. 6. Fish & Wildlife Information provided on the Wisconsin Department Of Natural Resources (DNR) website, Endangered Resources Preliminary Assessment, indicates no endangered resources have been recorded in the vicinity of the Wastewater Treatment Facility site. Appendix VIII 3 provides documentation from the website. 7. Agricultural Lands The wastewater treatment improvements and their implementation are to be located at the site of the existing Wastewater Treatment Facility. As a result, there will be no immediate impact on agricultural lands. There may be secondary impacts associated with potential growth and development, as well as Class A biosolids disposal as a result of the project. 8. Land Use The project is not expected to induce changes in previously identified land use. The City of Kiel has zoning controls in place, and has adopted a 20 year Comprehensive Plan. Development will continue within the Sewer Service Area. Mitigation of growth related impacts will be discussed in the Mitigation of Impacts section of this chapter. 9. Transportation Short term impacts will include increased truck traffic from construction activities. Due to the Treatment Facility location, these activities are not expected to disrupt traffic flow in CHAPTER VIII ENVIRONMENTAL SITE ASSESSMENT Wastewater Treatment System Facilities Plan CITY OF KIEL Calumet & Manitowoc Counties, Wisconsin Chapter VIII 2
235 and around the City of Kiel or result in the use of short term detours. transportation impacts are not expected. Long term 10. Economics Construction of the Wastewater Treatment Facility improvements will lead to short term increases in employment, and purchased goods and services in the immediate area. 11. Cultural Resources With regard to the existing Treatment Facility site, the Wisconsin Historical Society files would have previously been reviewed by the DNR Archeologist for potential impacts to archeological sites or historical structures during previous projects. New correspondence with the DNR Archeologist regarding this review is provided in Appendix VIII 4. No impacts are anticipated. 12. Unavoidable Adverse Impacts Some impacts associated with implementation of the Recommended Plan cannot be avoided. The construction of the Wastewater Treatment Facility improvements may have the following adverse impacts: a. Short term construction dust, noise and traffic. b. Minor erosion during construction. 13. Irretrievable & Irreversible Resource Commitments The proposed construction of the Wastewater Treatment Facility improvements would include the commitment of the following resources: a. Fossil fuel, electrical energy and human labor for facilities construction and operation. b. Increased user fees to cover construction and operation. c. Some unsalvageable construction material. CHAPTER VIII ENVIRONMENTAL SITE ASSESSMENT Wastewater Treatment System Facilities Plan CITY OF KIEL Calumet & Manitowoc Counties, Wisconsin Chapter VIII 3
236 B. MITIGATION OF IMPACTS As previously discussed, various adverse impacts would be associated with the proposed alternative. Many of these adverse impacts could be reduced significantly by the application of mitigative measures. These mitigative measures consist of a variety of legal requirements, planning measures and design practices. The extent to which these measures are applied will determine the ultimate impact of the particular actions. Potential measures for alleviating construction, operation, and secondary effects are discussed in the following section. 1. Mitigation Of Construction Impacts Construction related impacts are primarily short term effects resulting from construction activities. Mitigation measures for these impacts are the responsibility of the Contractor, and are governed by requirements in the project Drawings and Specifications, and appropriate local, State and Federal regulations. Erosion and sediment control measures are required by the project Specifications. The Specifications require the Contractor provide an Erosion and Sediment Control Program consisting of a schedule for land clearing and grading for each structure and trench excavation, along with a description of measures to be used during construction for erosion and sediment control. Adherence to the required Program will minimize adverse impacts from erosion and sedimentation. If the area disturbed by construction activities is larger than 1 acre, the Contractor will also be required to obtain a DNR Storm Water Discharge Permit. The Permit requirements would be implemented and administered by the Contractor throughout the project. The Specifications will require the Contractor to provide dust control measures. These measures generally consist of periodic watering of the construction area. Traffic control during construction activities will adhere to appropriate requirements. 2. Mitigation Of Operation Impacts Proper operation and maintenance of the Wastewater Treatment Facilities will improve the reliability of the system, leading to the discharge of high quality effluent. The new facilities will be constructed without disrupting existing level of treatment. 3. Mitigation Of Secondary Impacts Secondary impacts are principally associated with induced development associated with the improvements to the wastewater treatment system. Induced growth can be controlled with proper planning and zoning controls. The City of Kiel has zoning controls in place at CHAPTER VIII ENVIRONMENTAL SITE ASSESSMENT Wastewater Treatment System Facilities Plan CITY OF KIEL Calumet & Manitowoc Counties, Wisconsin Chapter VIII 4
237 A. INTRODUCTION Chapter VIII ENVIRONMENTAL SITE ASSESSMENT The potential impacts associated with the construction of Wastewater Treatment Facility Improvements for the City of Kiel Wastewater Treatment Facility are discussed in this chapter. Environmental impacts are put into categories of primary and secondary impacts. Primary impacts result directly from construction activities and facility operations. Secondary impacts are indirect, and occur because the project causes changes that induce actions that would not occur without the project. A third category is that of unavoidable, adverse impacts. The proposed Treatment Facility improvements project will be confined to the existing Wastewater Treatment Facility site, and public roads by which the facility is accessed. 1. Noise, Odor & Aesthetics Construction of improvements at the City of Kiel Wastewater Treatment Facility will inevitably generate some dust. Fumes, dust and noise will be a short term impact from truck travel and heavy machinery associated with construction activities. These short term impacts may be a nuisance to residents living near the activities and along truck routes. Mitigation of these impacts will be discussed in the Mitigation of Impacts section of this chapter. A short term aesthetic impact will also be associated with construction of Treatment Facility improvements. It should be noted that there are no residential properties adjacent to the Treatment Facility site. 2. Erosion & Sedimentation Soils exposed during construction will be subject to accelerated erosion until the surface is re vegetated. Erosion will be mitigated by Best Management construction practices for erosion control, as appropriate for the Treatment Facility site. 3. Surface Water Erosion control will be provided, as necessary, to protect nearby surface water from sedimentation due to runoff during construction at the Treatment Facility site. Appendix VIII 1 contains the floodplain mapping indicating the Wastewater Treatment Facility site is outside the 100 year floodplain. CHAPTER VIII ENVIRONMENTAL SITE ASSESSMENT Wastewater Treatment System Facilities Plan CITY OF KIEL Calumet & Manitowoc Counties, Wisconsin Chapter VIII 1
238 4. Groundwater There is groundwater approximately 15 feet below grade at the Treatment Facility site. Dewatering may be required when excavating for new below ground structures at the Treatment Facility site. However, no significant long term impacts are expected as a result of construction. 5. Wetlands Construction of improvements at the City of Kiel Wastewater Treatment Facility will be confined to the existing Treatment Facility site. Therefore, there are no anticipated impacts on wetland areas. Appendix VIII 2 contains a wetlands map of the area surrounding the Wastewater Treatment Facility site, confirming there are no affected wetlands. 6. Fish & Wildlife Information provided on the Wisconsin Department Of Natural Resources (DNR) website, Endangered Resources Preliminary Assessment, indicates no endangered resources have been recorded in the vicinity of the Wastewater Treatment Facility site. Appendix VIII 3 provides documentation from the website. 7. Agricultural Lands The wastewater treatment improvements and their implementation are to be located at the site of the existing Wastewater Treatment Facility. As a result, there will be no immediate impact on agricultural lands. There may be secondary impacts associated with potential growth and development, as well as Class A biosolids disposal as a result of the project. 8. Land Use The project is not expected to induce changes in previously identified land use. The City of Kiel has zoning controls in place, and has adopted a 20 year Comprehensive Plan. Development will continue within the Sewer Service Area. Mitigation of growth related impacts will be discussed in the Mitigation of Impacts section of this chapter. 9. Transportation Short term impacts will include increased truck traffic from construction activities. Due to the Treatment Facility location, these activities are not expected to disrupt traffic flow in CHAPTER VIII ENVIRONMENTAL SITE ASSESSMENT Wastewater Treatment System Facilities Plan CITY OF KIEL Calumet & Manitowoc Counties, Wisconsin Chapter VIII 2
239 and around the City of Kiel or result in the use of short term detours. transportation impacts are not expected. Long term 10. Economics Construction of the Wastewater Treatment Facility improvements will lead to short term increases in employment, and purchased goods and services in the immediate area. 11. Cultural Resources With regard to the existing Treatment Facility site, the Wisconsin Historical Society files would have previously been reviewed by the DNR Archeologist for potential impacts to archeological sites or historical structures during previous projects. New correspondence with the DNR Archeologist regarding this review is provided in Appendix VIII 4. No impacts are anticipated. 12. Unavoidable Adverse Impacts Some impacts associated with implementation of the Recommended Plan cannot be avoided. The construction of the Wastewater Treatment Facility improvements may have the following adverse impacts: a. Short term construction dust, noise and traffic. b. Minor erosion during construction. 13. Irretrievable & Irreversible Resource Commitments The proposed construction of the Wastewater Treatment Facility improvements would include the commitment of the following resources: a. Fossil fuel, electrical energy and human labor for facilities construction and operation. b. Increased user fees to cover construction and operation. c. Some unsalvageable construction material. CHAPTER VIII ENVIRONMENTAL SITE ASSESSMENT Wastewater Treatment System Facilities Plan CITY OF KIEL Calumet & Manitowoc Counties, Wisconsin Chapter VIII 3
240 the present time. The City of Kiel also has adopted a 20 year Comprehensive Plan (December 2002), which provides guidance for potential growth on a regional basis. C. RESOURCES IMPACT SUMMARY Appendix VIII 5 contains the Resources Impact Summary for the City of Kiel proposed Recommended Plan. This document will be made available for public review and comment. W:\WP\Facility Plan\K0015\ \Chapter VIII Enviornmental Site Assessment.docx CHAPTER VIII ENVIRONMENTAL SITE ASSESSMENT Wastewater Treatment System Facilities Plan CITY OF KIEL Calumet & Manitowoc Counties, Wisconsin Chapter VIII 5
241 APPENDIX VIII YEAR FLOODPLAIN MAPPING
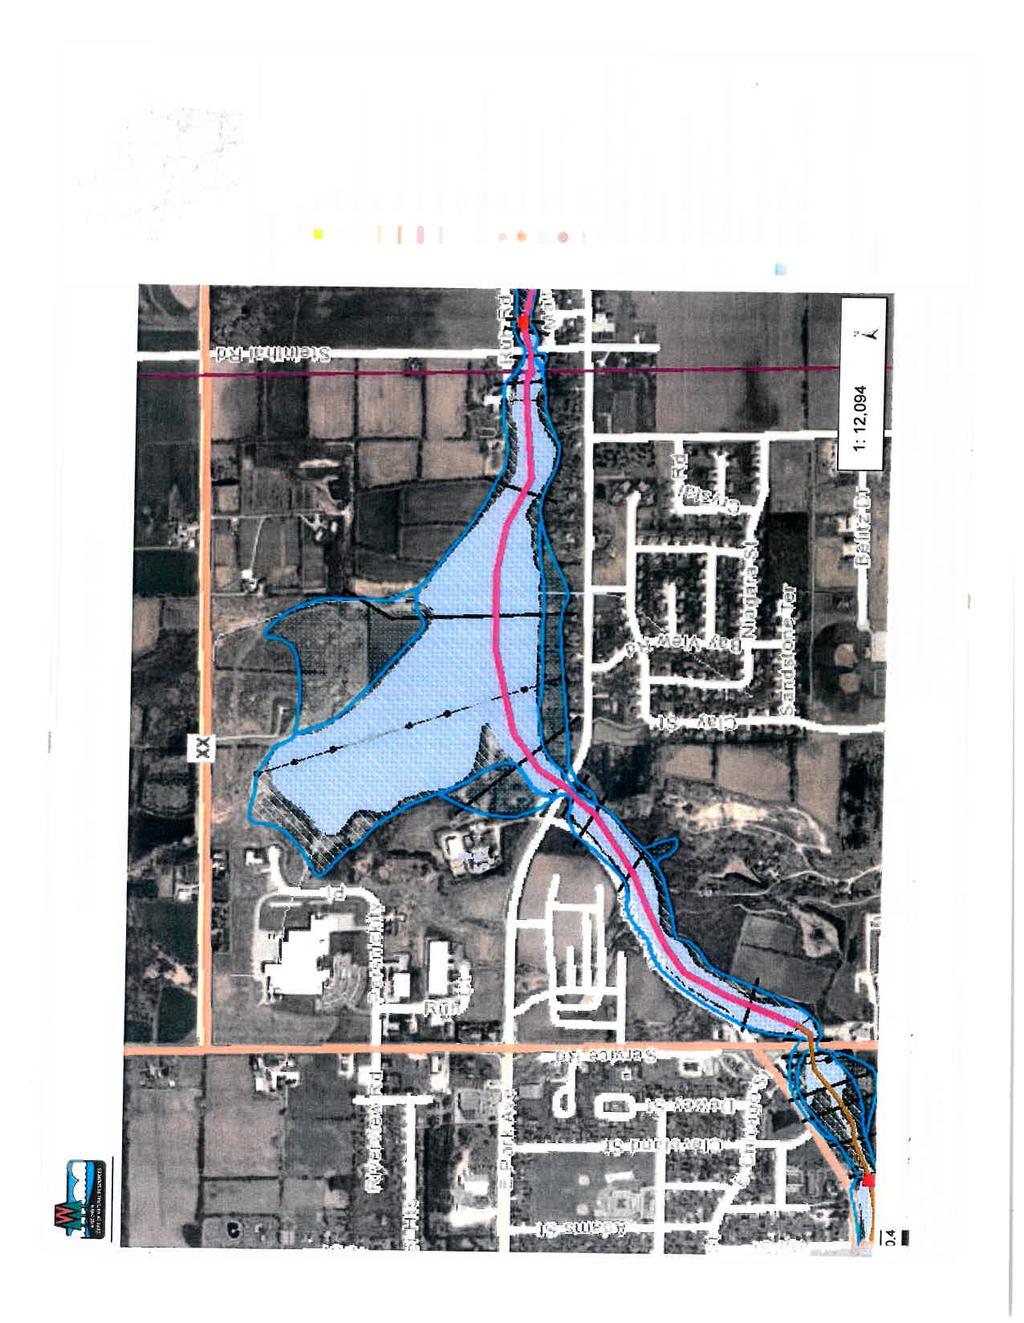
242
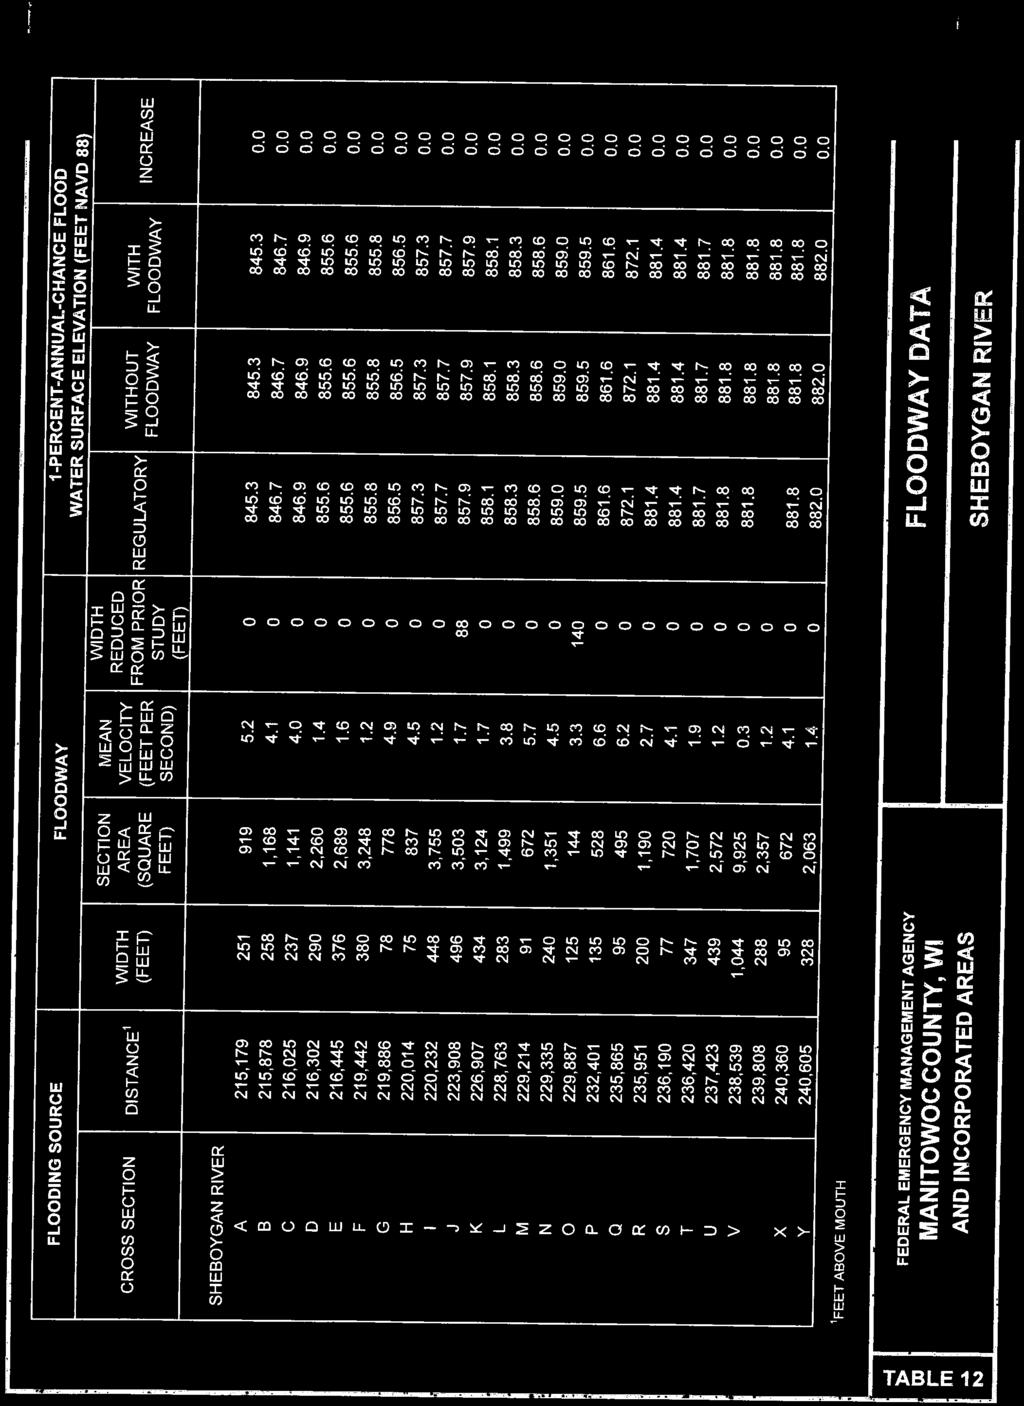

243
244 APPENDIX VIII 2 WETLANDS MAP


245 RIVERVIEW RD PERSNICKETY PL Rockville Flowage WWTP Site RUH C T Mapped Features WDNRWe tla nd s ( 2010) Pa r ce lline K AA " ) RO CK VI L LE RD eb h S o an g y v Ri er S our ce :Ma nitowoccounty, Disc la ime r :The pr ope r tyline s,r ightofwa yline s,a nd othe rpr ope r ty infor ma tion on this d r a wingwe r e dev e lope d orobta ine d a s pa r t of the CountyGe ogr a phici nfor ma tion S yste m orthr ough the County pr ope r tyta xma ppingfunction.mcmahond oe s not gua r a nte e this infor ma tion to be cor r ec t,cur r e nt,orc omple te.the pr ope r tya nd r ightofwa yinfor ma tion a r e onlyinte nd e d foruse a s a ge ne r al r e fe r e nce a nd a r e not inte nd e d orsuita ble forsite spe cificuse s. Anyuse to the contr ar yof the a bov e sta te d use s is the r e sponsibility of the use ra nd such use is a t the use r s own r isk. EW VI Ö? RD VER RI RD Y CL A ST NIAGARA ST SERVICE RD I Y BA W: \ PROJ ECTS \ K0015\ \ 00\ GI S \ Ae r ia lwwe tla nd s_ B. mxd S LH KRISTEL HTS S our ce :Esr i,digita lglobe,ge oeye,icube d,us DA,US GS,AEX,Ge tma pping,ae r ogr id,i GN,I GP,swisstopo,a nd the GI S Use r Community Fe e t AERIAL LOCATION & WETLANDS KI ELWAS TEWATER TREATMENTPLANT CI TYOFKI EL MANI TOWOCCOUNTy,WI S CONS I N
246 APPENDIX VIII 3 WISCONSIN DEPARTMENT OF NATURAL RESOURCES (DNR) Endangered Resources Preliminary Assessment

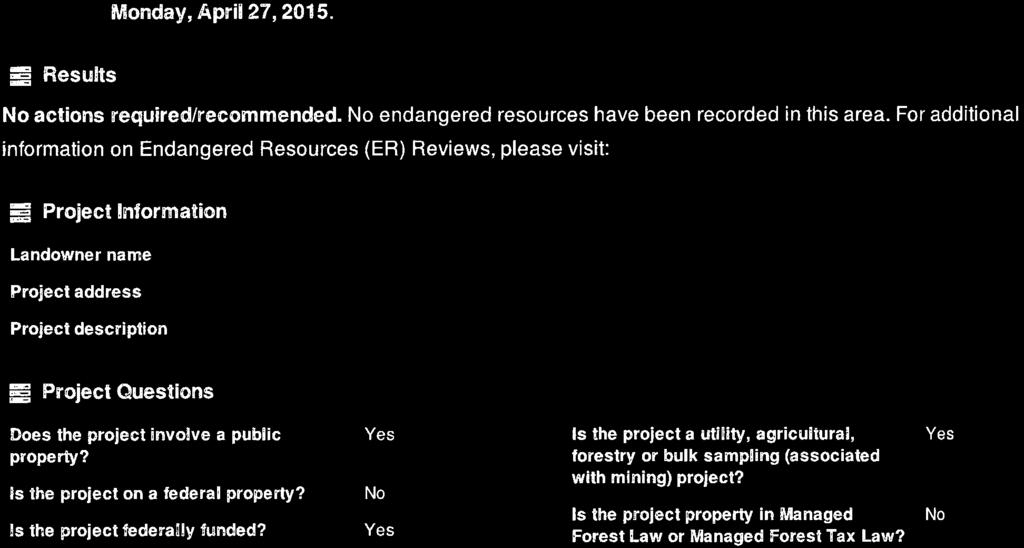

247
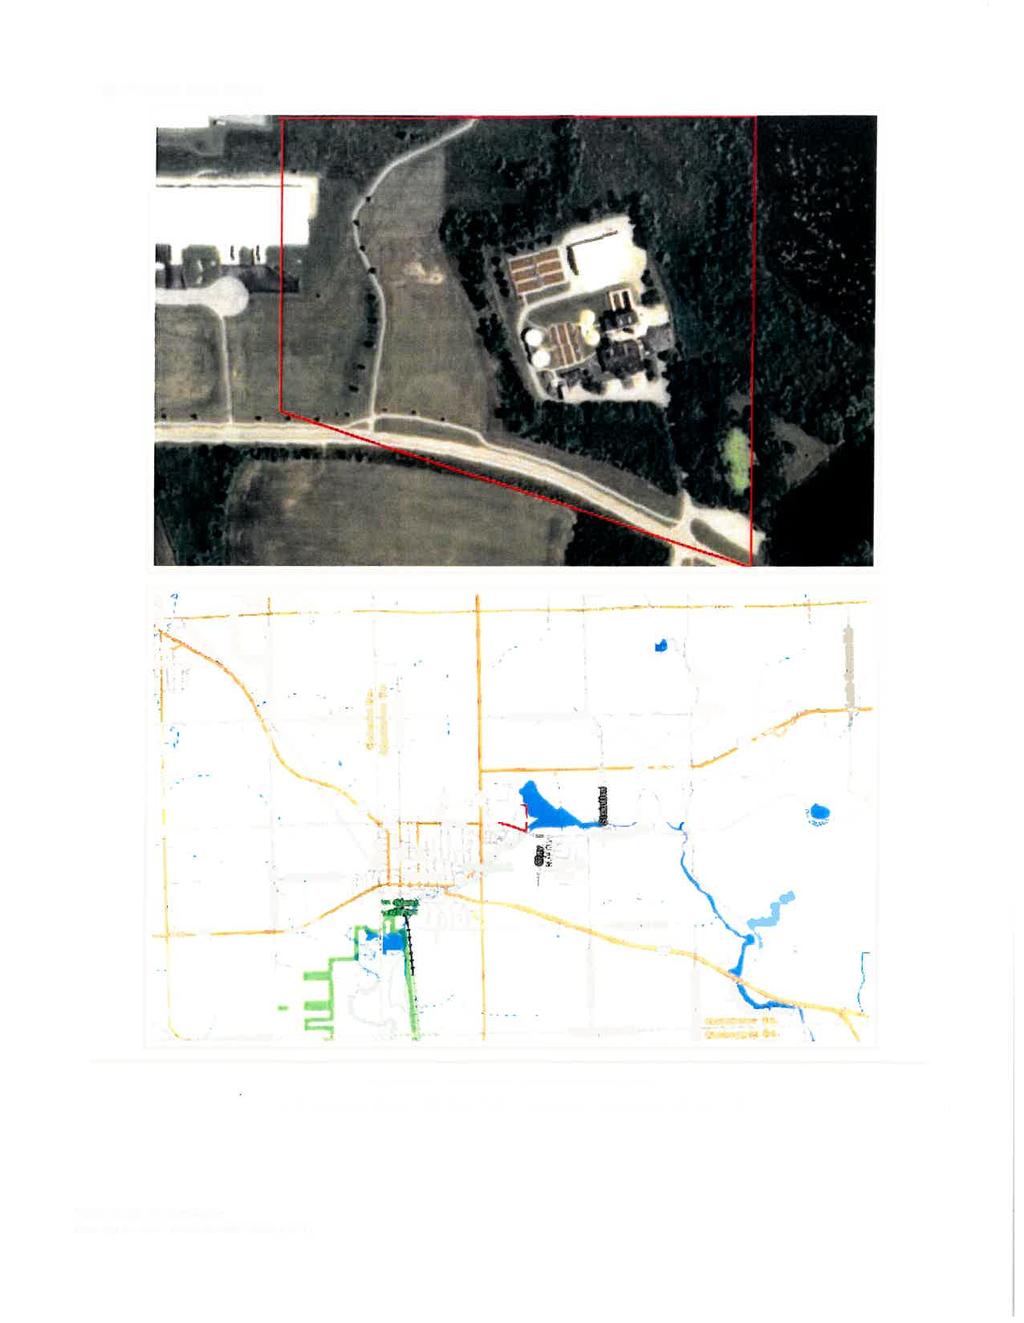
248
249 APPENDIX VIII 4 WISCONSIN DEPARTMENT OF NATURAL RESOURCES (DNR) Archaeological / Historical Significance Response

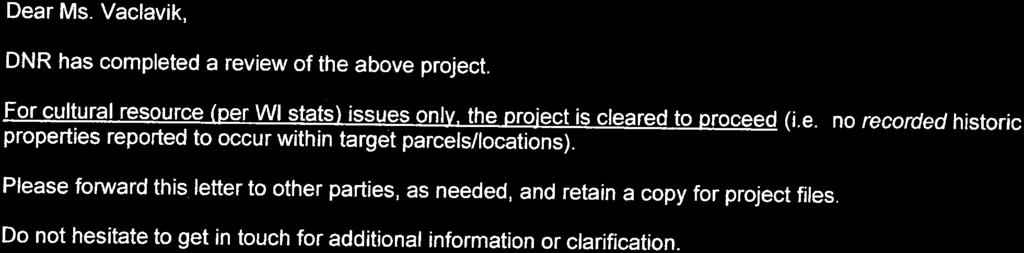


250
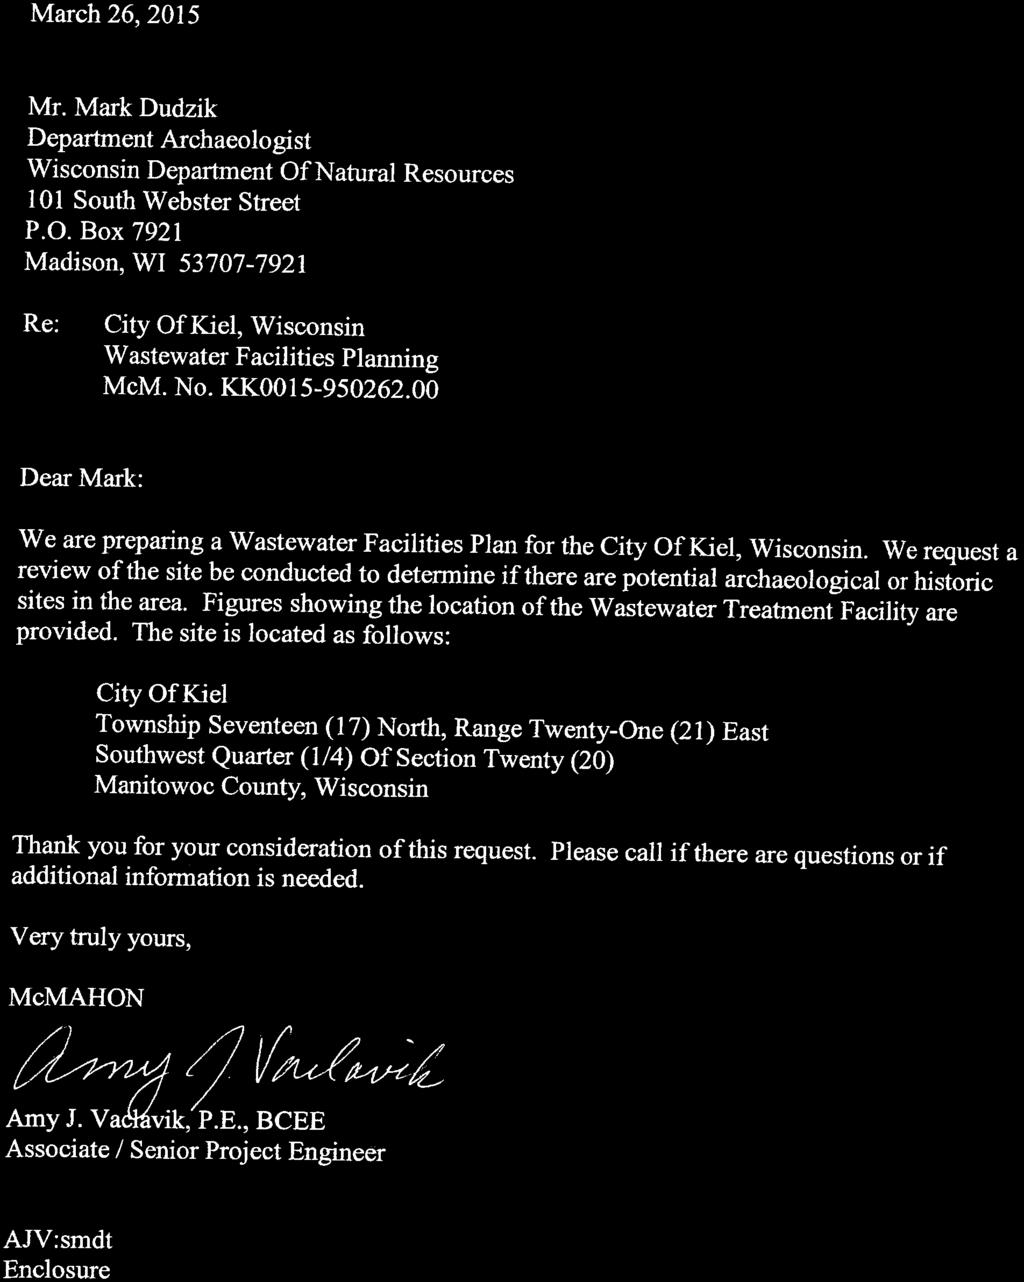

251
252 APPENDIX VIII 5 RESOURCES IMPACT SUMMARY
253 A. PROJECT IDENTIFICATION Appendix VIII 5 RESOURCES IMPACT SUMMARY CITY OF KIEL Wastewater Treatment Facilities 100 East Park Avenue Kiel, WI Manitowoc County Township Seventeen (17) North, Range Twenty One (21) East, Section Twenty (20) B. PROJECT DESCRIPTION 1. Why Is This Project Required? The current Wastewater Treatment Facility receives flows and loadings beyond its design capacity. The Facility is designed to treat an average flow of mgd and 6,000 lbs. Biochemical Oxygen Demand (BOD) and 2,842 lbs. Suspended Solids (SS). Over the past 3 years, the actual average flows and loadings were mgd, 6,569 lbs. BOD and 4,418 lbs. SS. The treatment capacity needs to be increased to accommodate current, as well as future, flows and loadings. Some equipment utilized in the treatment processes has reached the end of its useful life. New technologies are available, which can replace old, worn out systems and improve efficiencies. Changing effluent limits will require changes to the current treatment processes. The existing filters cannot treat the effluent to the necessary degree required by a Phosphorus limit of 0.1 mg/l. 2. Proposed Facility Improvements The proposed improvements are summarized below: a. Plant Wide Improvements: 1) Heating, ventilation and temperature control systems. 2) Flow metering. 3) Supervisory Control & Data Acquisition (SCADA), control system upgrades. 4) Electrical gear upgrades. 5) Lighting system upgrades. 6) Site paving. Appendix VIII 5 RESOURCES IMPACT SUMMARY Wastewater Treatment System Facilities Plan CITY OF KIEL Calumet & Manitowoc Counties, Wisconsin Appendix VIII 5 Page 1
254 7) Primary effluent piping. 8) Final effluent piping. 9) Maintenance structure addition. b. Headworks: 1) Fine screen basket replacement. c. Primary Clarifiers: 1) Structural crack repair. 2) Replace drives. 3) Replace clarifier mechanism. 4) Replace weirs and baffles. 5) Positive Displacement (PD) sludge pumps. d. Activated Sludge System: 1) Structural crack repair. 2) Splitter box gates. 3) Aeration tank modifications. 4) Aeration diffuser modifications. 5) Aeration blowers and piping. 6) Membrane Bio Reactor (MBR) system. 7) MBR Equipment Building. e. Disinfection: 1) Gas Storage Room modifications. f. Digesters: 1) Building expansion. 2) Replace covers. 3) Mixing system. 4) Boiler / heat exchanger. 5) Recirculation pumps. 6) Relocate flare. 7) Coating system. g. High Strength Waste Tank: 1) Separation wall and coating system. 2) Pumps and piping. Appendix VIII 5 RESOURCES IMPACT SUMMARY Wastewater Treatment System Facilities Plan CITY OF KIEL Calumet & Manitowoc Counties, Wisconsin Appendix VIII 5 Page 2
255 h. Dewatering: 1) Dewatering equipment. 2) Biosolids conveyors. 3) Hoisting equipment. i. Class A Process: 1) Dryer system. 3. Sewer Service Area The corporate boundaries of the City of Kiel are the limits of the area to be served by the sewer system. The Wastewater Treatment Facility is able to receive high strength wastes and septage from outside of the Kiel corporate limits via independent haulers. 4. Design Flows & Loadings 5. Effluent Limits PROPOSED WASTEWATER TREATMENT FACILITY DESIGN CRITERIA Design Year 2035 Population 4,260 Flow (mgd) Average Maximum Month Maximum Day Peak Hour Biochemical Oxygen Demand (BOD) (lbs./day) Average Maximum Month Maximum Day Total Suspended Solids (TSS) Average Maximum Month Maximum Day Total Kjehldahl Nitrogen (TKN) Average Maximum Month Maximum Day Phosphorus (P) Average Maximum Month Maximum Day Appendix VIII 5 RESOURCES IMPACT SUMMARY Wastewater Treatment System Facilities Plan CITY OF KIEL Calumet & Manitowoc Counties, Wisconsin Appendix VIII 5 Page ,265 10,745 21,489 6,424 9,636 16, ,427 Treated effluent is discharged to the Sheboygan River (water body identification Code Number 50700) at Rockville Flowage in the Sheboygan River Watershed (SH03) of the
256 Sheboygan River Drainage Basin in Manitowoc County. The discharge is authorized under Wisconsin Pollutant Discharge Elimination System (WPDES) Permit No. WI Key limits include: BOD 10 mg/l May thru October BOD 15 mg/l November thru April TSS 10 mg/l May thru October TSS 15 mg/l November thru April NH 3 N 5.3 mg/l October thru March NH 3 N 2.2 mg/l April thru May NH 3 N 1.7 mg/l June thru September P 1.0 mg/l Other effluent limits for conventional parameters, such as ph, fecal coliform, chlorine residual, copper and chlorides, match up with conventional limits seen throughout the State. In anticipation of reissuance of the WPDES Permit, the DNR has issued a Memorandum regarding Water Quality Based Effluent Limitations (WQBEL) for the City of Kiel Wastewater Treatment Facility, dated September 30, The purpose of the Memorandum is to provide calculated water quality based effluent limits for discharge into the Sheboygan River. Key changes to the Kiel discharge permit being considered by the DNR include: a. Temperature Limits (September April) b. Total Phosphorus Limits 1) 0.1 mg/l (May October) 2) 0.3 mg/l (November April) c. Chlorides, 460 mg/l d. Ammonia, 6.7 mg/l daily maximum e. Dissolved Oxygen (DO), 7.0 mg/l (July September) f. Biochemical Oxygen Demand (BOD) 1) 8.9 mg/l (June) 2) 9.5 mg/l (July) 3) 8.7 mg/l (August) 4) 9.9 mg/l (September) 5) 9.3 mg/l (October) Appendix VIII 5 RESOURCES IMPACT SUMMARY Wastewater Treatment System Facilities Plan CITY OF KIEL Calumet & Manitowoc Counties, Wisconsin Appendix VIII 5 Page 4
257 g. Total Suspended Solids (TSS) 1) 8.9 mg/l (June) 2) 9.5 mg/l (July) 3) 8.7 mg/l (August) 4) 9.9 mg/l (September) 5) 9.3 mg/l (October) 6. Implementation Design of the proposed improvements is scheduled to occur in 2016, with construction commencing in 2017 and continuing through The project is anticipating financing via the Clean Water Fund (CWF) program. C. AFFECTED ENVIRONMENT 1. Physical The proposed Treatment Facility upgrade will occur on the existing Wastewater Treatment Facilities site. The site has been previously disturbed during the mid 1980 s expansion projects, and subsequent improvement projects since. The proposed project will have no anticipated impacts on lakes, streams, shore lands, flood plains, wetlands, groundwater, soils or topography. Erosion control measures shall be required by project specifications. 2. Biological Information provided by the DNR website Endangered Resources Preliminary Assessment indicates no endangered resources have been recorded in the vicinity of the Wastewater Treatment Facility site. 3. Cultural The proposed Wastewater Treatment Facility improvements project will have no impact on zoning, land use, ethnic or cultural groups, or archaeological/historical resources. 4. Other Features The proposed Wastewater Treatment Facility improvements project will have no impact on parks, waterways, natural areas or prime agricultural land. Appendix VIII 5 RESOURCES IMPACT SUMMARY Wastewater Treatment System Facilities Plan CITY OF KIEL Calumet & Manitowoc Counties, Wisconsin Appendix VIII 5 Page 5
258 D. PROJECT ENVIRONMENTAL IMPACTS Environmental impacts are put into categories of primary and secondary impacts. Primary impacts result directly from construction activities and facility operations. Secondary impacts are indirect, and occur because the project causes changes that induce actions that would not occur without the project. A third category is that of unavoidable, adverse impacts. 1. Noise, Odor & Aesthetics Construction of improvements at the City of Kiel Wastewater Treatment Facilities will inevitably generator some dust. Fumes, dust and noise will be a short term impact from truck travel and heavy machinery associated with construction activities. These short term impacts may be a nuisance to residents living near the activities and along truck routes. Mitigation of these impacts are discussed in Paragraph E Mitigation of Impacts. A shortterm aesthetic impact will also be associated with construction of Treatment Facility improvements. 2. Erosion & Sedimentation Soils exposed during construction will be subject to accelerated erosion until the surface is re vegetated. Erosion will be mitigated by Best Management construction practices for erosion control, as appropriate. 3. Surface Water Erosion control will be provided, as necessary, to protect nearby surface water from sedimentation due to runoff during construction. 4. Groundwater There is relatively high groundwater the Wastewater Treatment Facility site (approximately 15 feet below grade). Dewatering may be required when excavating for new below ground structures at the Treatment Facility site. However, no significant long term impacts are expected as a result of construction. 5. Wetlands Construction of improvements at the City of Kiel Wastewater Treatment Facility will be confined to the existing Treatment Facility site. Therefore, there are no impacts on wetland areas. Appendix VIII 5 RESOURCES IMPACT SUMMARY Wastewater Treatment System Facilities Plan CITY OF KIEL Calumet & Manitowoc Counties, Wisconsin Appendix VIII 5 Page 6
259 6. Fish & Wildlife Information provided on the DNR website Endangered Resources Preliminary Assessment indicated no endangered resources have been recorded in the vicinity of the Wastewater Treatment Facility site. 7. Agricultural Lands The Wastewater Treatment Facility improvements will be located at the site of the existing Treatment Facility. As a result, there will be no immediate impact on agricultural lands. There may be secondary impacts associated with potential growth and development, as well as a Class A biosolids disposal as a result of the project. 8. Land Use The project is not expected to induce changes in previously identified land use. Development will continue within the City of Kiel corporate limits. A 20 year Comprehensive Plan, prepared by Bay Lake Regional Planning Commission, was adopted by the City of Kiel on December 10, 2002, which provides guidance for future development. Mitigation of growth related impacts will be discussed in Paragraph E Mitigation Of Impacts. 9. Transportation Short term impacts will include increased truck traffic from construction activities. These activities are not expected to disrupt traffic flow in and around the City or result in the use of short term detours. Long term transportation impacts are not expected. 10. Economics Construction of the Wastewater Treatment Facility improvements will lead to short term increases in employment, and purchased goods and services in the immediate area. 11. Cultural Resources A request was made of the DNR Archeologist to determine if any archeological sites or historic structures/sites are present within the vicinity of the City of Kiel Wastewater Treatment Facility site. The response from the DNR was that there are no recorded historic properties recorded to occur within the project location. There are no expected impacts for work at the existing Wastewater Treatment Facility site. Appendix VIII 5 RESOURCES IMPACT SUMMARY Wastewater Treatment System Facilities Plan CITY OF KIEL Calumet & Manitowoc Counties, Wisconsin Appendix VIII 5 Page 7
260 12. Unavoidable Adverse Impacts Some impacts associated with implementation of the Recommended Plan cannot be avoided. The project may have the following adverse impacts: a. Potential short term construction dust, noise and traffic. b. Potential minor erosion during construction. 13. Irretrievable & Irreversible Resource Commitments The proposed project would include the commitment of the following resources: a. Fossil fuel, electrical energy and human labor for facilities construction and operation. b. Increased user fees to cover construction and operation. c. Some unsalvageable construction material. E. MITIGATION OF IMPACTS As previously discussed, various potential adverse impacts would be associated with the proposed alternative. Many of these potential adverse impacts could be reduced significantly by the application of mitigative measures. These mitigative measures consist of a variety of legal requirements, planning measures and design practices. The extent to which these measures are applied will determine the ultimate impact of the particular actions. Potential measures for alleviating construction, operation and secondary effects are discussed in the following section. 1. Mitigation Of Construction Impacts Construction related impacts are primarily short term effects resulting from construction activities. Mitigation measures for these impacts are the responsibility of the Contractor, and are governed by requirements in the project Drawings and Specifications and appropriate regulations. Erosion and sediment control measures are required by the project Specifications. The Specifications require the Contractor provide an Erosion and Sediment Control Program consisting of a schedule for land clearing and grading for each structure and trench excavation, along with a description of measures to be used during construction for erosion and sediment control. Adherence to the required Plan will minimize adverse impacts from erosion and sedimentation. Appendix VIII 5 RESOURCES IMPACT SUMMARY Wastewater Treatment System Facilities Plan CITY OF KIEL Calumet & Manitowoc Counties, Wisconsin Appendix VIII 5 Page 8
261 If the area disturbed by construction activities is larger than 1 acre, the Contractor will also be required to obtain a DNR Storm Water Discharge Permit. The permit requirements would be implemented and administered by the Contractor throughout the project. The Specifications will require the Contractor to provide dust control measures. These measures generally consist of periodic watering of the construction area. Traffic control during construction activities will adhere to appropriate requirements. 2. Mitigation Of Operation Impacts Proper operation and maintenance of the Wastewater Treatment Facility will improve the reliability of the system, leading to the discharge of high quality effluent. The new facilities will be constructed utilizing temporary equipment and processes, as necessary, to minimize disruption of existing treatment. 3. Mitigation Of Secondary Impacts Secondary impacts are principally associated with induced development associated with the improvements to the wastewater treatment system. Induced growth can be controlled with proper planning and zoning controls. The City of Kiel has zoning controls in place at the present time. Additionally, the City of Kiel has the 20 year Comprehensive Plan for guidance. F. ALTERNATIVES CONSIDERED The following alternatives were considered: 1. No Action Alternative The No Action Alternative consists of maintaining status quo conditions within the Treatment Facility. Under this Alternative, no Wastewater Treatment Facility improvements or modifications would be implemented. The current facilities have reached or exceeded their design capacities. Hydraulic limitations exist, hampering the treatment process as flows increase. Many of the unit processes, control systems and infrastructure have been in service for more than 20 years. Age, environmental conditions and continued use have taken a toll on equipment, processes and controls throughout the Facility. Rather than taking a piecemeal approach to upgrades, and sacrificing cost savings and construction related synergy, the City of Kiel authorized a Wastewater Facilities Plan be undertaken to estimate future flows and loadings to the Year The rationale for a comprehensive approach to addressing the needs at the Treatment Facilities makes the No Action Alternative impractical. Appendix VIII 5 RESOURCES IMPACT SUMMARY Wastewater Treatment System Facilities Plan CITY OF KIEL Calumet & Manitowoc Counties, Wisconsin Appendix VIII 5 Page 9
262 2. Regional Treatment Regional treatment with the closest municipality, New Holstein, was previously considered. High costs for wastewater transmission rendered this alternative impractical. 3. Wastewater Treatment Alternatives Three (3) alternatives were considered for the activated sludge process: Expand Existing System Integrated Film Activated Sludge (IFAS) Membrane Bio Reactor (MBR) a. Expand Existing System: Expansion of the existing aeration system will be required to effectively treat the projected flows and loadings for the next 20 years. Influent / effluent piping to/from the aeration basins will need to have an increase in hydraulic capacity. Flow splitting at the existing splitter box will need to be addressed, as well. An additional aeration tank may be added to each of the three (3) trains. Continued use of aeration tankage will require structural repairs to concrete, as necessary, to extend their service life. The buried air main, which leaks, should be replaced with an overhead, stainless steel air main. The old, 100 HP blowers are recommended to be replaced with more energy efficient units. Continued use of the 150 HP blowers is recommended, as they can provide on line back up to meet firm capacity requirements, while new energy efficient blowers provide duty service. b. Integrated Film Activated Sludge (IFAS): Retrofitting the aeration system with an Integrated Film Activated Sludge (IFAS) system was considered as an alternative to increasing the existing treatment capacity of the conventional activated sludge system. An IFAS system combines both attached biological growth and suspended biological growth treatment in the same tank. Media is added to the aeration tankage, which provides a surface for growth of additional attached biomass. Advantages of IFAS include: 1) Allows capacity expansion with same aerobic volume. 2) Increases Biological Nutrient Removal (BNR). 3) Improves solids settleability. 4) Greater resistance to hydraulic washout. 5) Increased resilience to slug loadings. 6) Reduced solids loading to final clarifiers. Appendix VIII 5 RESOURCES IMPACT SUMMARY Wastewater Treatment System Facilities Plan CITY OF KIEL Calumet & Manitowoc Counties, Wisconsin Appendix VIII 5 Page 10
263 c. Membrane Bio Reactor (MBR): Consideration was also given to Membrane Bio Reactor (MBR) systems. Factoryassembly of submerged units, consisting of air diffusers assemblies, membrane cassettes and common permeate manifolds, provide simpler installation in the field. MBR systems operate at a higher mixed liquor concentration, and require a significantly smaller footprint. Advantages of an MBR system include: 1) Smaller footprint; fits in existing tankage. 2) Multiple barriers; membranes and biofilm. 3) Physical barrier to exclude viruses, bacteria and cysts; reducing need to expand disinfection system or existing filters. 4) No need to rebuild or expand final clarifiers. With the use of an expanded conventional activated sludge system, and with an IFAS system, the existing final clarifiers will be utilized. Replacement of the mechanisms and drives, weirs and baffles is required. In addition, two (2) new 40 foot diameter final clarifiers are required to handle the projected hydraulic capacity and solids loading. Redundant Return Activated Sludge (RAS) and Waste Activated Sludge (WAS) pumps are included. Final clarifiers are not required for the MBR alternative. The capacity of the filter system must be increased, and efficiencies increased to allow removal of Phosphorus. The ability to remove Phosphorus down to 0.1 mg/l at 4.96 mgd in a retrofit of the existing sand filters is highly unlikely and impractical. Options utilizing ballasted high rate sedimentation (Actiflo and Co Mag) do not allow for installation within the existing filter footprint while providing system redundancy, and were dropped from consideration. Instead, installation of disc type filters in the filter footprint were evaluated with the expanded conventional activated sludge and IFAS options. Filters are not required with the MBR option. 4. Biosolids Handling Alternatives Space limitations in the area currently occupied by the 2 meter belt press preclude using the same technology in the future, when redundant units are provided. Screw press technology and centifuges, which have a smaller footprint, will be considered for dewatering. For as long as it is serviceable, continued use of the existing pasteurization process is proposed, as the basic infrastructure is in place, and a readily stackable and disposable biosolids product is produced. Presently, power plant bottom ash is added in excess of that required for stabilization in order to produce a stackable biosolids product. There is no cost to the City to acquire the bottom ash. When combined in the pasteurization process, the volume of cake produced is doubled. This results in a need to expand the Biosolids Storage Appendix VIII 5 RESOURCES IMPACT SUMMARY Wastewater Treatment System Facilities Plan CITY OF KIEL Calumet & Manitowoc Counties, Wisconsin Appendix VIII 5 Page 11
264 Facility in the future should the RDP process be continued. In addition, continued use of systems with lime or fly ash will result in premature equipment failures due to lime /ash dust that becomes airborne. In the event the pasteurization process becomes no longer serviceable, alternative technology, such as dryers, are recommended, as they also can produce a stackable, readily disposable product. Belt dryers, which utilize hot air, fit within the space limitations of the existing Solids Handling Building. The resultant Class A process with a dry solids content in excess of 90% will allow continued use of the existing Storage Facility without the need for expansion. 5. Total Project Costs An Opinion Of Probable Construction Costs (1) and Operation & Maintenance (O&M) Costs (1) is summarized below for each alternative considered. Treatment Option Capital Cost Present Worth Capital Annual O&M Present Worth O&M Total Present Worth Expand Existing System $13,407,849 $13,723,290 $617,916 $7,951,454 $21,674,745 IFAS $15,297,523 $15,634,745 $738,984 $9,509,379 $25,144,124 MBR $13,412,022 $13,627,131 $702,108 $9,034,852 $22,661,983 Biosolids Option Capital Cost Present Worth Capital Annual O&M Present Worth O&M Total Present Worth Centrifuge $1,289,846 $1,283,589 $109,638 $1,410,842 $2,694,431 Screw Press $1,273,635 $1,267,335 $114,275 $1,470,511 $2,737,846 Class A Capital Cost Dryer $5,585, Environmental Impacts Of Non Selected Alternatives a. No Action Alternative: The environmental impacts of the No Action Alternative include a continuation of the aging of equipment and additional stress on the treatment process, which could ultimately lead to violations of the WPDES permit. Equipment failures would be expected to occur, jeopardizing the wastewater treatment process. The ability to hydraulically treat incoming flows is questionable. b. Non Selected Alternatives: The environmental impacts of non selected alternatives are the same as the impacts of the selected alternatives. Impacts would be limited to the existing Wastewater Treatment Facility site, and chiefly consist of short term construction related impacts. Appendix VIII 5 RESOURCES IMPACT SUMMARY Wastewater Treatment System Facilities Plan CITY OF KIEL Calumet & Manitowoc Counties, Wisconsin Appendix VIII 5 Page 12
265 (1) The Opinion Of Probable Cost was prepared for use by the Owner in planning for future costs of the project. In providing Opinions Of Probable Cost, the Owner understands that the Design Professional has no control over costs or the price of labor, equipment or materials, or over Construction Professionals method of pricing, and that the Opinions Of Probable Cost provided herewith are made on the basis of the Design Professional s qualifications and experience. It is not intended to reflect actual costs, and is subject to change with the normal rise and fall of the local area s economy. This Opinion must be revised after every change made to the project or after every 30 day lapse in time from the original submittal by the Design Professional. W:\WP\Facility-Plan\K0015\ \Chapter VIII - Enviornmental Site Assessment.docx Appendix VIII 5 RESOURCES IMPACT SUMMARY Wastewater Treatment System Facilities Plan CITY OF KIEL Calumet & Manitowoc Counties, Wisconsin Appendix VIII 5 Page 13
266 Chapter IX RECOMMENDED PLAN A. INTRODUCTION Based upon the Alternatives Evaluation & Preliminary Screening, Cost Effectiveness Analysis, and Environmental Assessment, the Recommended Plan for the City of Kiel Wastewater Treatment Facility improvements include: Upgrading the activated sludge process with Membrane Bio Reactor (MBR) technology; Upgrading the anaerobic digestion process to utilize two (2) primary digesters; Utilizing primary sludge and high strength wastes in the digestion process, and diverting Waste Activated Sludge (WAS) to dewatering; Upgrading biosolids dewatering to screw press technology; Incorporating a dryer as the Class A biosolids process; and Continuing with on going Infiltration/Inflow (I/I) reduction programs. B. DESCRIPTION Figure IX 1 is a graphic representation of the liquid flow train through the treatment process. Figure IX 2 is a graphic representation of the solids handling and biosolids management train. The biogas management train is depicted in Figure IX 3. The design criteria for the Recommended Plan is summarized in Table IX 1. A detailed description of the Recommended Plan follows. 1. Plant Wide a. Instrumentation & Controls b. Supervisory Control & Data Acquisition (SCADA) System c. Administration Building HVAC d. Laboratory Countertops e. Storage, Maintenance Space, Vehicle Storage f. Tank Cleaning (primaries, aeration, digesters) g. Tank Painting (digesters, HSW tank) h. Grading & Landscaping i. Site Paving j. Primary Effluent Piping k. Final Effluent Piping l. Electrical Gear 2. Headworks a. Replace Fine Screen Baskets With 3 mm. CHAPTER IX RECOMMENDED PLAN Wastewater Treatment System Facilities Plan CITY OF KIEL Calumet & Manitowoc Counties, Wisconsin Chapter IX 1
267 3. Primary Clarifiers a. Repair Structural Cracks. b. Replace Clarifier Mechanisms & Drives. c. Replace Weirs & Baffles. d. Provide Three (3) New Positive Displacement (PD) Sludge Pumps. 4. Activated Sludge System a. Replace Splitter Box Gates. b. Repair Spalled Concrete. c. MBR Equipment & Building. d. Overhead Air Main. e. Additional Aeration System Headers & Diffusers. f. Aeration Blowers. g. Aeration Basin Configuration Modifications. 5. Disinfection System a. Gas Storage Room Modifications. 6. Digesters a. Replace Covers. b. Add Mixing Systems. c. Address Class I, Division 1 Compliance. d. Add Boiler / Heat Exchanger. e. Recirculation Pumps. f. Relocate Flare. g. Relocate condensate Drain In Service Building. h. Clean & Coat Interiors. 7. High Strength Waste Receiving a. Separation Wall Addition & Coating. b. Pumps & Piping To Digesters. 8. Dewatering a. Redundant Screw Presses. b. Biosolids Conveyor. c. Hoisting Equipment. CHAPTER IX RECOMMENDED PLAN Wastewater Treatment System Facilities Plan CITY OF KIEL Calumet & Manitowoc Counties, Wisconsin Chapter IX 2
268 9. Class A Process a. Hot Air Dryer System Day Biosolids Storage a. Continued Use Of Existing Building. Design Year Table IX 1 WASTEWATER TREATMENT FACILITY DESIGN CRITERIA INFLUENT PUMPING (River Road Lift Station) Number Of Pumps Capacity, each pump, gpm Station Firm Capacity, mgd Type Of Pump INFLUENT SCREENING Number Of Units Type Capacity, each unit, mgd Clear Opening, mm GRIT REMOVAL Type Of Unit Number Of Units Capacity, each unit, mgd PRIMARY CLARIFIERS Number Of Units Diameter, each unit, feet Sidewater (SWD) Depth, each unit, feet Surface Overflow Rate, gpd/sq.ft. Average Flow, 1.34 mgd Peak Hour Flow, 5.06 mgd Weir Loading Rate, gpd/ft. Average Flow, 1.34 mgd Detention Time, hours Average Flow, 1.34 mgd Maximum Day Flow, 3.85 mgd Removal Efficiencies BOD, % SS, % TKN Primary Sludge, lbs./day Average Day Maximum 30 Day Proposed Design , Dry Pit Immersible 2 Spiral Aerated @28 2@ @1,089 2@4,114 2@4,542 2@2.0 2@ ,482 5,088 CHAPTER IX RECOMMENDED PLAN Wastewater Treatment System Facilities Plan CITY OF KIEL Calumet & Manitowoc Counties, Wisconsin Chapter IX 3
 Maximum 30 Day (78% VSS) Primary Sludge, gpd @ x% solids Average Day Maximum 30 Day SECONDARY TREATMENT SYSTEM Design Loadings To Secondary, lbs.")
269 Design Year Table IX 1 WASTEWATER TREATMENT FACILITY DESIGN CRITERIA PRIMARY CLARIFIERS (continued) Volatile Sludge, lbs./day Average Day (78% VSS) Maximum 30 Day (78% VSS) Primary Sludge, x% solids Average Day Maximum 30 Day SECONDARY TREATMENT SYSTEM Design Loadings To Secondary, lbs./day Biochemical Oxygen Demand (BOD) Average Day Maximum Day Maximum 30 Day Total Kjeldahl Nitrogen (TKN) (includes sidestreams), lbs./day Average Day Maximum Day Maximum 30 Day Phosphorus (P), lbs./day Average Day Maximum Day Maximum 30 Day Existing Aeration Tanks, size, ft. SWD, ft. Total Tank Volume, cu.ft. Anoxic Zone, size, ft. Anaerobic Zone, size, ft. Aerobic Zone, size, ft. BOD Loading, lbs./1,000 cu.ft. Average Day Maximum 30 Day Design MLSS, mg/l Average Maximum Month Design F:M Average Design Sludge Retention Time (SRT), Days Average Volatile Solids, % Total Sludge Production, lbs. SS/lb. BOD Secondary Sludge, lbs./day Average Maximum 30 Day WAS To Dewatering, 1.4% Average Maximum Month Oxygen Requirements, 1.1 lb. O2/lb. Proposed Design ,716 3, ,917 20,336 6,806 17,253 8, ,783 1, @65x ,720 2@30x32 2@34x32 4@65x ,500 10, % ,084 5,259 34,978 45,041 CHAPTER IX RECOMMENDED PLAN Wastewater Treatment System Facilities Plan CITY OF KIEL Calumet & Manitowoc Counties, Wisconsin Chapter IX 4