Thinlay Asphalt for Pavement Preservation
|
|
|
- Erik McKinney
- 5 years ago
- Views:
Transcription


1 Thinlay Asphalt for Pavement Preservation Jim Huddleston, P.E. Executive Director APAO

2 The Need Pavement Management Professionals are tasked with implementing strategies and treatments that will provide the highest level of service at the least cost over the life cycle

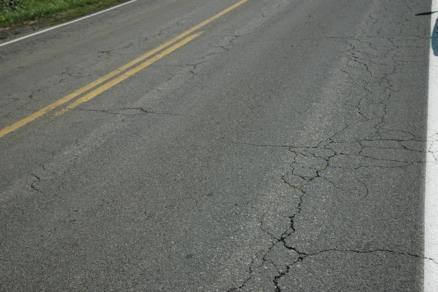
3 Preservation Treatments need to correct minor surface Cracking Rutting Raveling

4 Preservation Treatments Should seal the existing pavement to prevent intrusion of water and air

5 Preservation Treatments should also improve serviceability Smoothness Surface friction Drainage issues
6 Preservation Treatments should last as long as possible Long life = low life cycle cost Long life = minimal user impacts Long life allows the Pavement manager to optimize the performance of the entire network
7 Preservation Strategies Should include an inventory of structural needs/ limitations What is the structural capacity/life of this pavement? What is the impact of a fatigue (structural) failure? How will this treatment impact the fatigue life?
8 Thinlay Asphalt Treatments Are designed to address all of these important Preservation needs Correct Surface distress Seal the existing surface Improve Serviceability Provide long life Extend structural life
9 Thinlay Asphalt Treatments Asphalt mixes engineered specifically for pavement preservation Designed with aggregate gradations allowing placement as thin as ¾ Binders and gradations selected to optimize flexibility, durability and rut resistance
10 Thinlay Asphalt Treatments Can include recycled materials RAP, RAS, GTR to enhance performance, reduce costs, reduce demand for new raw materials (improve sustainability) Can be produced with warm mix technology to further enhance sustainable qualities
11 Thinlay Mix Design Mix design Criteria to optimize Preservation needs Nominal Max =/< 1/3 lift thickness (for ¾ lift use 6.3 mm or smaller mix) binder selected to optimize crack resistance (softest binder that passes rut test), polymers for highest demand areas RAP and RAS combined with softer base binders to provide optimum value
12 Thinlay Mix Design Mix design Criteria to optimize Preservation needs Gyrations levels to match traffic and local practice generally Va, (4 +/- 1%) VMA (15-17), VFA (70-80), avoid low VMA high dust mixes Minimum binder contents normally 6%, typically higher due to fine grading

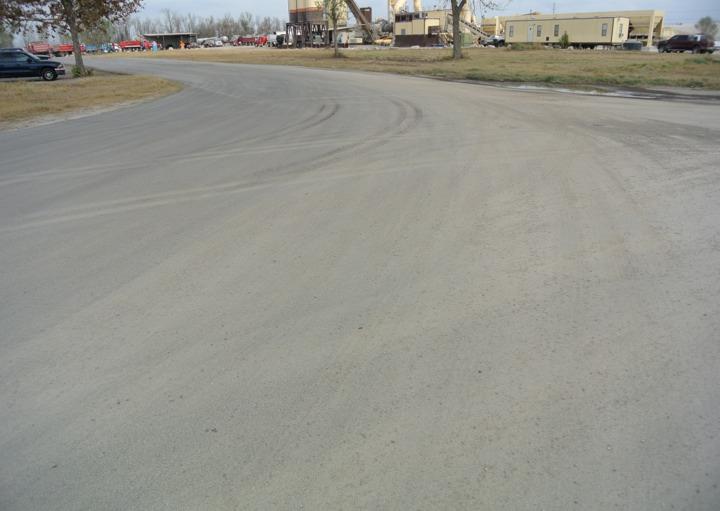
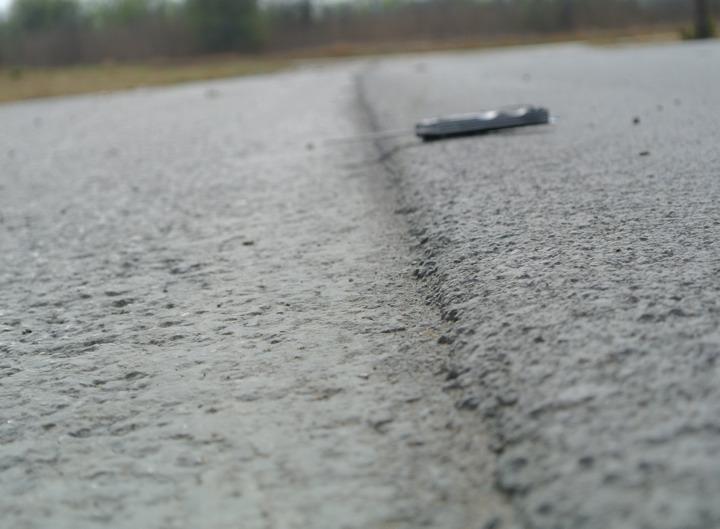
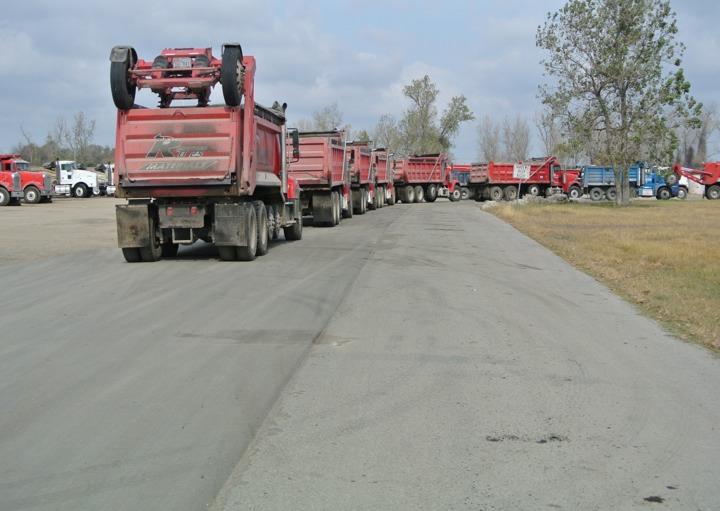
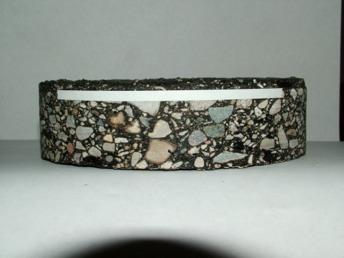
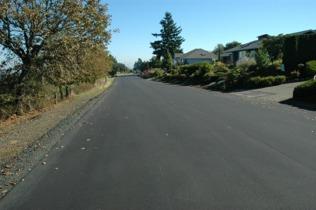
13 Thinlay in Texas 40% RAP mix ¾ thick
14
15
16
17 Thinlay Asphalt Benefits Seal the existing pavement Correct functional (non-structural) pavement deficiencies Provide structure (i.e. strength) True-up the pavement (i.e. restore cross-slope and profile) Reduce cost of pavement maintenance
18 Thinlay Asphalt Benefits PAVEMENT PERMEABILITY 9.5 mm NMAS Source: NCAT Reduced permeability improves pavement longevity by protecting the pavement from the damaging effects of air and moisture intrusion SIMILAR TO A SHINGLE!
19 Thinlay Asphalt Benefits Improve ride and correct cross slope deficiencies MAP21 will require reporting pavement condition Primary condition measure will be IRI (smoothness)
20 SHRP SPS-3 STUDY Thin overlays significantly improved pavement smoothness after treatment Chip seals and slurry seals showed little or no pavement smoothness improvement after treatment


21 Thinlay Asphalt Benefits Reduce cost of pavement maintenance Properly designed thinlay asphalt requires very little maintenance and can last longer than the original surface
22 Thinlay Asphalt Benefits No need to program seals on a thinlay, they are impermeable If reflective cracks form seal the cracks, that is it.
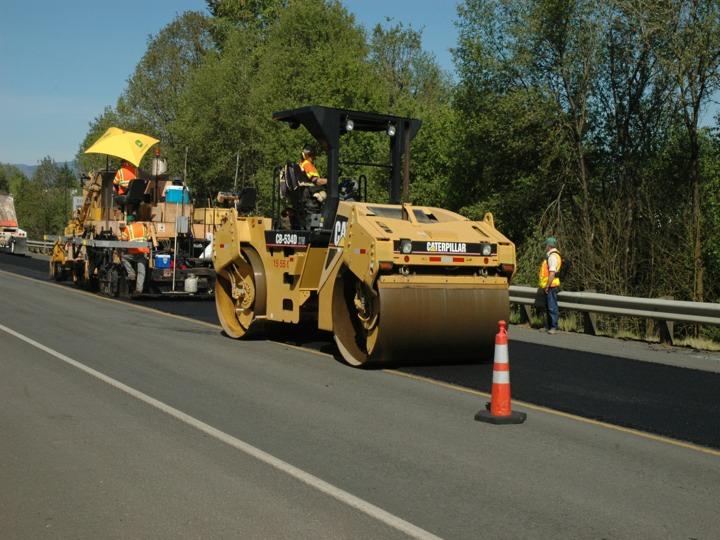
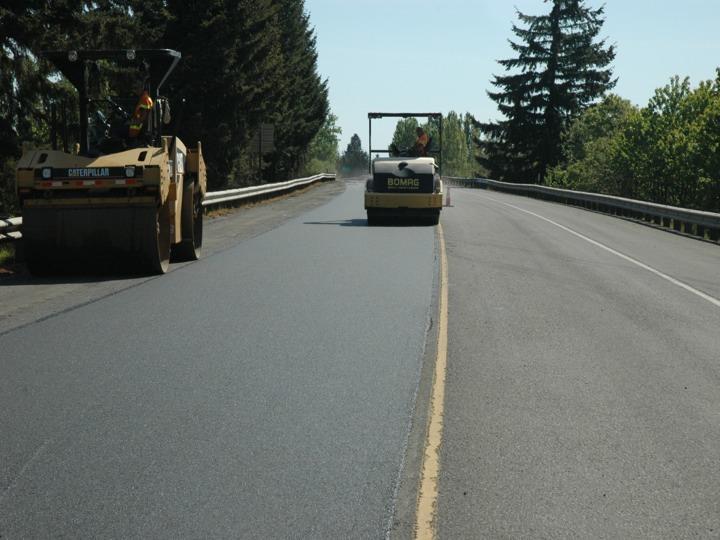
23 Thinlay Asphalt Benefits Rapid construction and immediately open to traffic Public views the road as like new following thinlay paving No cure time or sweeping, or broken windshields Limited performance risk Preferred by cyclists and other non auto traffic
24 Preservation Treatment Effects on Pavement Condition and New Preventive Maintenance 0 Pavement Condition Time or Traffic Critical Condition Corrective Maint, Rehabilitation, or Reconstruction
25 Very Good Pavement Condition Good Fair Poor Failed Life Extension PMS Data Point Time (Years) Source: FHWA Pavement Preservation Compendium, Figure 2. Life-extending benefit of preventive maintenance treatment.
26 (Very Good) 100 Pavement Condition (PCI, PCR) (Very Poor) 0 PMS Data Point Time (Years) The plot of pavement management system (PMS) data indicates the rate of deterioration in pavement condition as determined by measuring severity and extent of pavement distresses.
27 (Very Good) 100 Pavement Condition (PCI, PCR) (Very Poor) 0 PMS Data Point Time (Years) The plot of pavement management system (PMS) data indicates the rate of deterioration in pavement condition as determined by measuring severity and extent of pavement distresses.
28 Pavement Condition Rating System Distress types rated for flexible pavements. Raveling Bleeding Patching Potholes/debonding Crack sealing deficiency Rutting Settlements Corrugations Wheel track cracking Block & Transverse cracking Longitudinal joint cracking Edge cracking Random cracking
29 (Very Good) 100 Pavement Condition (PCI, PCR) (Very Poor) 0 PMS Data Point Time (Years) With the application of a preventive maintenance treatment pavement distresses are corrected and condition is improved. Pavement life is extended.
30 (Very Good) 100 Pavement Condition (PCI, PCR) (Very Poor) 0 PMS Data Point Time (Years) With the application of a preventive maintenance treatment pavement distresses are corrected and condition is improved. Pavement life is extended.
31 (Very Good) 100 Pavement Condition (PCI, PCR) Life Extension PMS Data Point (Very Poor) 0 Time (Years) With the application of a preventive maintenance treatment pavement distresses are corrected and condition is improved. Pavement life is extended.
32 (Very Good) 100 Pavement Condition (PCI, PCR) Life Extension PMS Data Point (Very Poor) 0 Time (Years) Life Extension depends on (1) structural soundness of the pavement upon which the preventive maintenance treatment is to be applied, and (2) robustness of the treatment.
33 (Very Good) 100 Pavement Condition (PCI, PCR) Life Extension PMS Data Point (Very Poor) 0 Time (Years) Generally, less robust treatments provide lesser life extension.
34 (Very Good) 100 Pavement Condition (PCI, PCR) Life Extension Less life PMS Data Point (Very Poor) 0 Time (Years) Generally, less robust treatments provide lesser life extension.
35 (Very Good) 100 Pavement Condition (PCI, PCR) Life Extension PMS Data Point 0 Time (Years) Life extension varies based on robustness of the preventive maintenance treatment. In general, ThinLay asphalt Treatments afford greater Life Extension.
36 (Very Good) Pavement Condition (PCI, PCR) Life Extension PMS Data Point Performance more typical of a Thinlay treatment 0 Time (Years) Life extension varies based on robustness of the preventive maintenance treatment. In general, ThinLay asphalt Treatments afford greater Life Extension.
37 (Very Good) Pavement Condition (PCI, PCR) Life Extension Performance more typical of a surface treatment. PMS Data Point Performance more typical of a Thinlay treatment 0 Time (Years) Life extension varies based on robustness of the preventive maintenance treatment. In general, ThinLay asphalt Treatments afford greater Life Extension.
 75 50 Fatigue Cracking 25 Life")
 0 Raveling Time (Years) Beyond")


38 (Very Good) 100 Pavement Condition (PCI, PCR) Fatigue Cracking 25 Life Extension PMS Data Point Bleeding (Very Poor) 0 Raveling Time (Years) Beyond their role in asset management, pavement condition rating systems are primarily tools for identifying distresses and developing rehabilitation strategies to correct them.
 Life Extension How well does the")

39 (Very Good) 100 Pavement Condition (PCI, PCR) (Very Poor) PMS Data Point Time (Years) Life Extension How well does the treatment meet the satisfaction of the user? Condition ratings provide only part of the answer. Serviceability also needs to be considered.
40 Serviceability is A pavement performance measure developed as part of the AASHO Road Test, and A measure of the pavement s ability to serve the type of traffic which use the facility, and A measurement of the users perceptions regarding the acceptability of a pavement, and Largely impacted by the user s perception of ride quality.
41 (Very Good) 5.0 Present Serviceability Index (PSI) Lowest acceptable level of serviceability (Terminal Serviceability) (Very Poor) 0 Accumulated Traffic Over Life of Pavement Serviceability declines as a pavement deteriorates under the punishment of traffic. The lowest tolerable level of serviceability is called the Terminal Serviceability.
42 (Very Good) Serviceability of initial construction 5.0 Present Serviceability Index (PSI) Lowest acceptable level of serviceability (Terminal Serviceability) (Very Poor) 0 Accumulated Traffic Over Life of Pavement Serviceability declines as a pavement deteriorates under the punishment of traffic. The lowest tolerable level of serviceability is called the Terminal Serviceability.
43 (Very Good) Serviceability of initial construction 5.0 Present Serviceability Index (PSI) Lowest acceptable level of serviceability (Terminal Serviceability) (Very Poor) 0 Accumulated Traffic Over Life of Pavement Serviceability declines as a pavement deteriorates under the punishment of traffic. The lowest tolerable level of serviceability is called the Terminal Serviceability.
44 (Very Good) 5.0 Present Serviceability Index (PSI) Lowest acceptable level of serviceability (Terminal Serviceability) (Very Poor) 0 Accumulated Traffic Over Life of Pavement Preventive maintenance treatments differ widely in their ability to improve serviceability.
45 (Very Good) Present Serviceability Index (PSI) 5.0 Treatments that both repair pavement distresses and improve pavement profile can restore serviceability to new pavement levels. Lowest acceptable level of serviceability (Terminal Serviceability) (Very Poor) 0 Accumulated Traffic Over Life of Pavement Preventive maintenance treatments differ widely in their ability to improve serviceability.
46 (Very Good) 5.0 Present Serviceability Index (PSI) Lowest acceptable level of serviceability (Terminal Serviceability) (Very Poor) 0 Accumulated Traffic Over Life of Pavement Preventive maintenance treatments differ widely in their ability to improve serviceability.
47 (Very Good) Present Serviceability Index (PSI) 5.0 Treatments that primarily repair pavement distresses without improvement to pavement profile have minimal effect on serviceability. Lowest acceptable level of serviceability (Terminal Serviceability) (Very Poor) 0 Accumulated Traffic Over Life of Pavement Preventive maintenance treatments differ widely in their ability to improve serviceability.
48 (Very Good) 5.0 Present Serviceability Index (PSI) Lowest acceptable level of serviceability (Terminal Serviceability) (Very Poor) 0 Accumulated Traffic Over Life of Pavement Preventive maintenance treatments differ widely in their ability to improve serviceability.
49 (Very Good) Present Serviceability Index (PSI) 5.0 Performance more typical of Thinlay asphalt treatments. Lowest acceptable level of serviceability (Terminal Serviceability) (Very Poor) 0 Accumulated Traffic Over Life of Pavement Preventive maintenance treatments differ widely in their ability to improve serviceability.
50 Structural Benefits Preventive Maintenance treatments are typically non-structural Preventive Maintenance treatments should be applied to structurally sound pavements Slurry seals, Chips Seals, micro surfacing add no structure A 1 inch thinlay asphalt treatment does provide structural benefits
51 Structural Benefits Most in-service pavements were designed for 20 years with AASHTO design They have finite bottom up fatigue life, meaning if thickness is not increased the pavement will eventually fail from bottom up cracking TENSILE STRAIN
52 Structural Benefits A seal type treatment applied on those pavements will have no impact on the tensile strain and therefore no impact on the structural life TENSILE STRAIN
53 Structural Benefits Preventive seals on these pavements will only mask the impending structural distresses and eventually lead to full depth failures
54

55 Timely Thinlay treatments can save your structure

56 Thinlay Structure?
57 What s in an inch? Asphalt Thickness VS. Fatigue Life Thickness Micro strain Reps to failure , , , , ,133
58 Perpetual Pavements The goal of a perpetual pavement is to achieve a thickness that will confine future distresses to the surface Full depth failures are prevented The pavement can than be managed at the surface indefinitely


59 Washington State - Top-Down in Asphalt Pavements > 150 mm 50 mm 150 mm
60 Structural contribution of 1 A 1 inch overlay of an existing 4 inch pavement will double the fatigue life A second 1 inch overlay can extend the structural life beyond 50 years Once you achieve a perpetual thickness you can focus on managing at the surface for functional attributes as your structural worries are over
61 Thinlay Experience in Oregon We have over 15 years of good performance history with thin lift paving Oregon DOT recently has added thinlay to their preservation tool chest Several local agencies with on going success
62 Thinlay at ODOT ODOT to date has let 3 contracts One experimental test section with high polymer binder on I-5 near Medford Two larger projects this year, one on the Tillamook highway near Forest Grove and one on highway 101 North of Lincoln City They also have a short section on I-5 North of Eugene that is going on 5 years old

63 Thinlay at ODOT The highway 6 project is micro mill and pave 1 inch

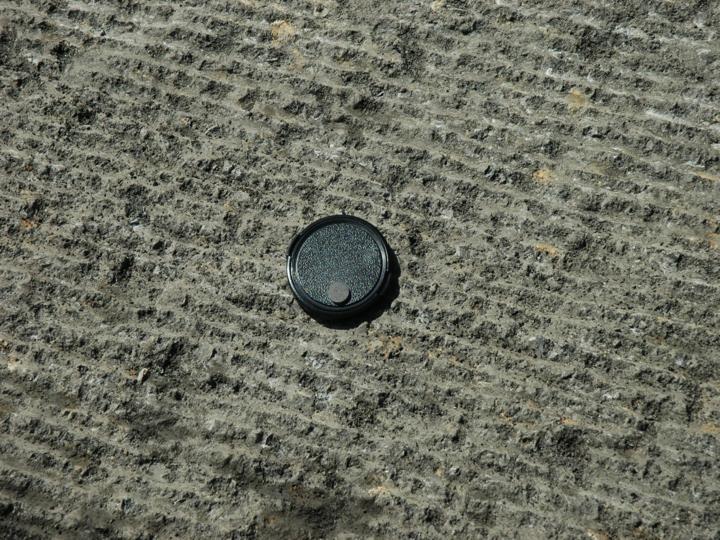
64 Micro Mill Micro milling removed surface distress and provides a very smooth and uniform surface to place a 1 inch lift
65


66 Normal tack shot rates and materials
67
68

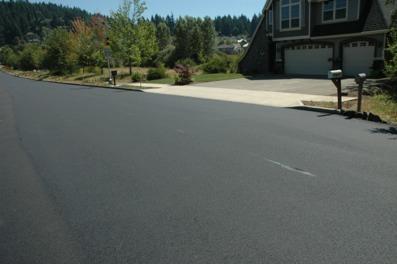
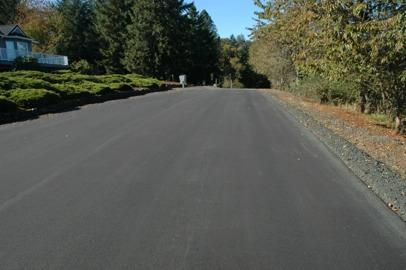
69 Many other Oregon success stories Walnut Blvd. Corvallis

70 Walnut micro mill and thinlay

71 Happy Valley

72 Polk County
73 Washington County

74 Economics of Preventive Maintenance Treatments

75 Thinlay Experience in Oregon Washington County Case Study
76 A Case Study Rehabilitation Using Thinlay Overlays Washington County Summer, 2001

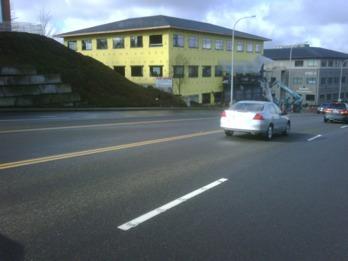
77 Murray Blvd. ADT = 30,000 vehicles per day
78 Why Thinlay Overlays? (1 fine graded mix) Minimize Lane Closures Appearance and Ride Quality Added Structural Life Limited Contractor Availability for Slurry Seals/Micro-Seals Reduced Risk Lower Life-Cycle Cost???
79 Cost Thinlay Treatment = $2.53 per square yard Micro-Surfacing = $1.92 per square yard 32% cost increase
80 Life Cycle Costs Estimated in Years, I=4% Thinlay = $4.24 (based on estimated 10 year life) Micro Surface = $6.74 (based on experience of 5 year life) Thinlay Saves $2.50/yd 2 in 20 Years and Adds 2 of Structure
81
82 Actual Life Cycle Costs 15 Years, I=4%, Thinlay life = 15 year life Average micro surfacing life = 5 years Thinlay = $2.53 Micro Surface = $4.79 Thinlay Saves $2.26/yd 2 in 15 Years, adds structure, and provides high serviceability, far less user impact
83 Cost Comparison on Murray Blvd. (no discount) Thin Lift Overlay = $2.53 per square yard $0.18 per square yard per year of service Micro-Surfacing = $1.92 per square yard $0.38 per square yard per year of service
84 New Developments APAO in conjunction with NCAT and NAPA conducting research to develop high performance high recycle content thinlay mixes for preservation Mixes designed to be placed as thin as ¾ Mixes designed to be flexible and provide excellent crack resistance Mixes that maximize recycle content to provide value
85 Approach Softer base binders are being used to improve crack resistance and to offset the stiffening effects of the RAP/RAS Mix tests for cracking are being used rather than blended binder properties because they better predict mix performance and model actual binder blending
86
87
88 Testing All mixes meet Superpave criteria and ODOT criteria for rutting, TSR and voids All mixes are being tested first in the Overlay Crack Tester

89 Testing The overlay crack test results will be used to screen the mixes for further testing Further testing includes IDT for fatigue and cold temperature properties
90 Mixes and Preliminary Results for Oregon L3 ½ 30% RAP L3 ¼ 30% RAP L3 ¼ 40% RAP L3 ¼ 50% RAP L3 ¼ 20% RAP 3% RAS L3 ¼ 20% RAP 5% RAS Pb Pbr Binder Grade Binder Replaced Overlay test results % 32.3% 44.3% 55.4% 33% 39.3% 160/ / /605 -/65 N/A N/A
91 Preliminary Overlay Crack Test Results L3 1/2" 28.5 L3 1/4" 32.3 L3 1/4" 44.3 L3 1/4" 55.4
92 Additional testing for Eugene Oregon Eugene job with 35% binder replacement ½ L2 mix using overlay test result 260 reps Control L2 ½ 30% RAP result 61 reps Both were plant produced mix, lab compacted at APAO lab
93 Findings from O lay testing Low temperature grade has greatest influence on the overlay crack test results High temp grade has some influence Using softer binders can more than offset the stiffening effects of increased RAP binder up to a point
94 Findings from O lay testing Results appear to be independent of NMAS These results relate to reflective type cracking (strain control) and not necessarily to fatigue
95 Next Testing Phase Phase 2 testing with IDT for fracture energy (fatigue) is underway We chose the L3 ½ control, the L3 ¼ 64-28, the L3 ¼ 40% RAP with both binders for Phase 2 testing We will also test one or both of the RAP/RAS samples
96 Expected outcomes Completed research by mid 2014 Guide specification for material selection and mix design Will include ¼ and 3/8 nmas mixes We also plan to run a polymer modified binder through the test array to evaluate potential benefits

97 Thinlay Asphalt Smooth, Strong, Durable Longest Life of all treatments Lowest life cycle cost Superior Smoothness Preferred by road users Maintains Structural integrity