Cleaning Up a Salt Spill: Predictive Modelling and Monitoring Natural Attenuation to Save Remedial Costs
|
|
|
- Shona Thornton
- 5 years ago
- Views:
Transcription

1

2 Cleaning Up a Salt Spill: Predictive Modelling and Monitoring Natural Attenuation to Save Remedial Costs
3 Outline Introduction Remedial Alternatives Alternate Approach: Site Assessment and Predictive Modelling Importance of Predictive Modelling for Remediation by Natural Attenuation
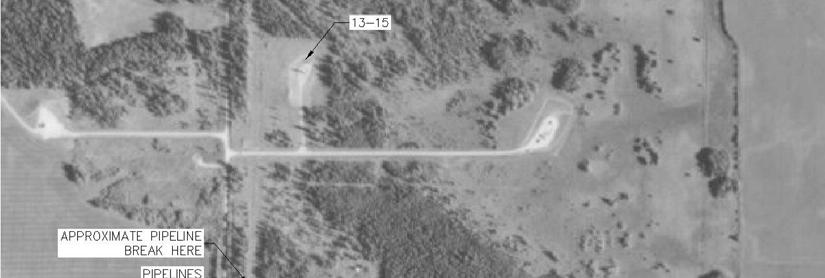
4 Introduction Site located in central Alberta. Pipeline break on September 6, 2002 caused by corroded pipe. Approximately 5,250 m 2 affected area. Initial spill response (by others): standing fluid (produced water and oil) removed by vacuum truck; trenches excavated along and downslope of spill area; limited soil and trench water quality data collected; and geophysics survey (EM 38). Shallow groundwater table present.
5 Site Plan
6 Remedial Alternatives (16,000 m 3 in situ) Traditional dig and dump ($2.1M to $2.5M). Pump and deep well disposal ($1.0M to $1.3M).

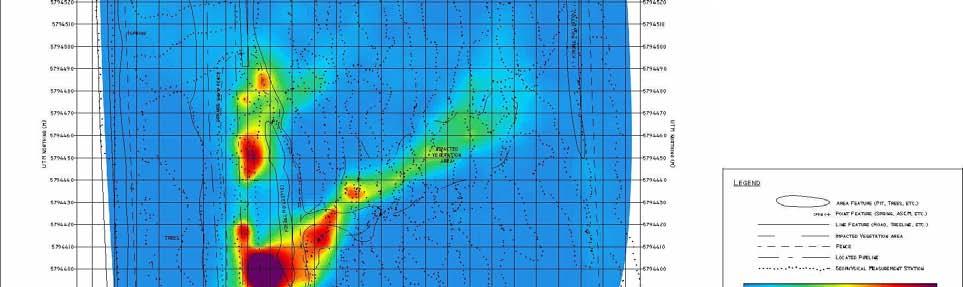

7 EM38 Survey (September 2002) Base: ESSIS 2002 EM38

8 EM38 Survey (September 2002, 2003)
9 Site Assessment Electromagnetic (EM) survey Groundwater flow regime. Soil and groundwater quality data. Vegetation survey. Predictive modelling vs. observed water quality.
10 Site Assessment: EM Survey (2003, 2004)

11 Site Assessment: Groundwater Flow Regime K=1 m/day I = 5%
12 Site Assessment: Groundwater Flow Net
13 Site Assessment: Soil Quality Data Fall 2002 (spill response info in source area): maximum chloride (Cl) concentration of 39,100 mg/kg; and maximum sodium adsorption ratio (SAR) of 49.7 ds/m and electrical conductivity (EC) of 29 ds/m.
 (source area) (high EM38 area)")
14 Site Assessment: Soil Chloride Concentration (Spring 2005) (source area) (high EM38 area)
 (source area) (high EM")
15 Site Assessment: Soil SAR Concentration (Spring 2005) (source area) (high EM area)
16 Site Assessment: Groundwater Quality Data Spring 2005 Spill Area: chloride in shallow well (523 mg/l); and chloride in deep (bedrock) well (27 mg/l). High EM38 Area: chloride in shallow well (747 mg/l); and chloride in deep (bedrock) well (6 mg/l).

17 Site Assessment: Dissolved Chloride Concentration Profile Along Plume 900 Concentration vs Distance MW06 05MW MW MW04 05MW Distance from pipeline break area
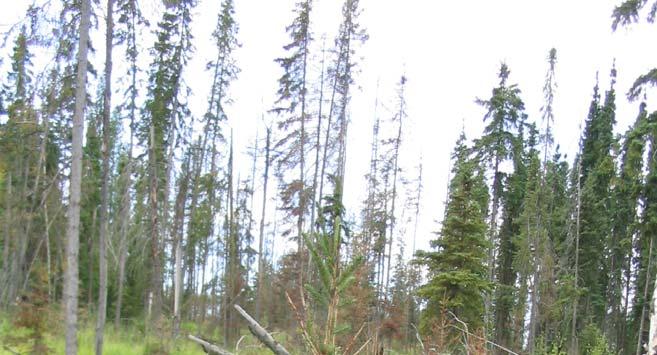
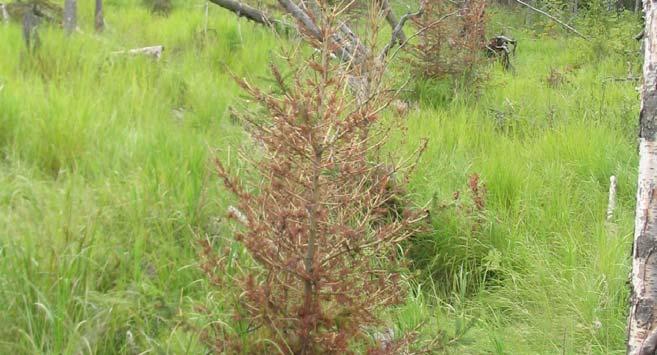
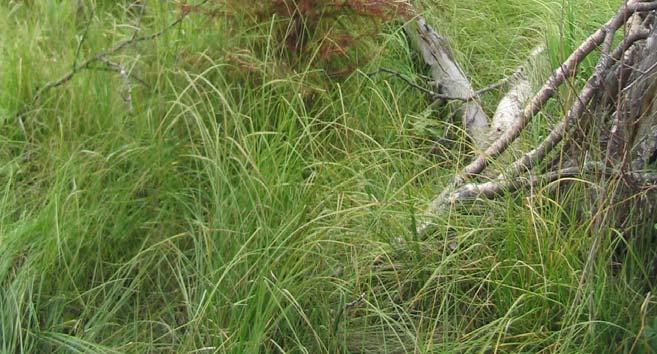
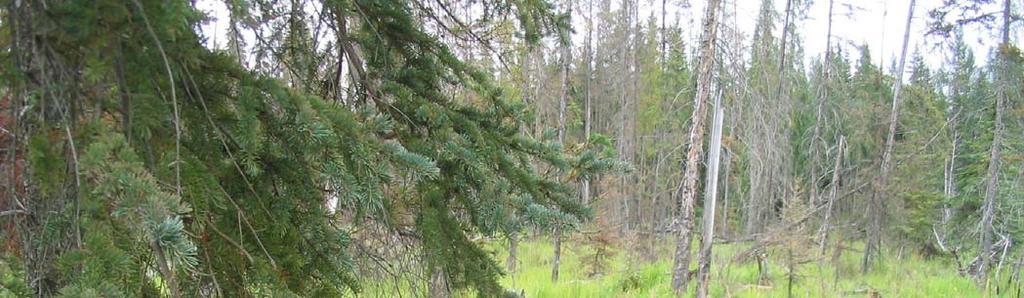
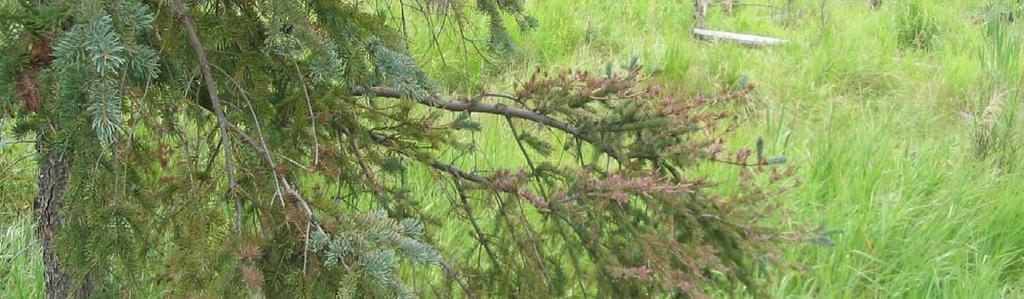
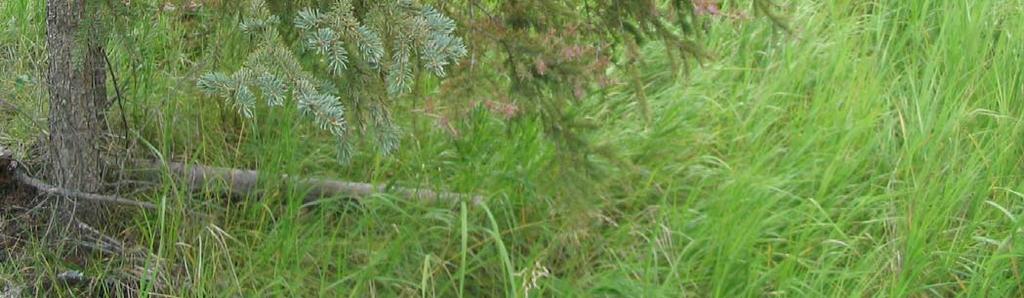
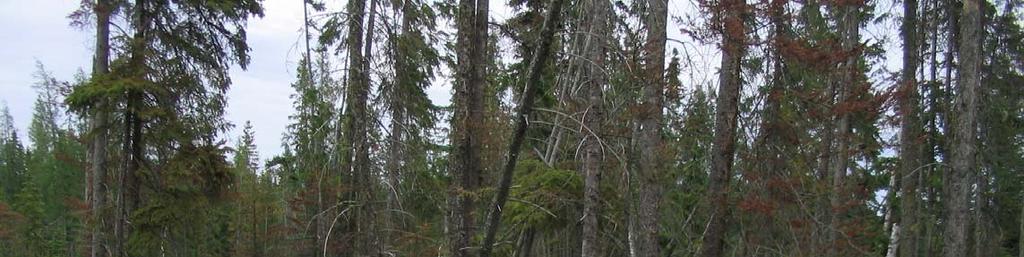
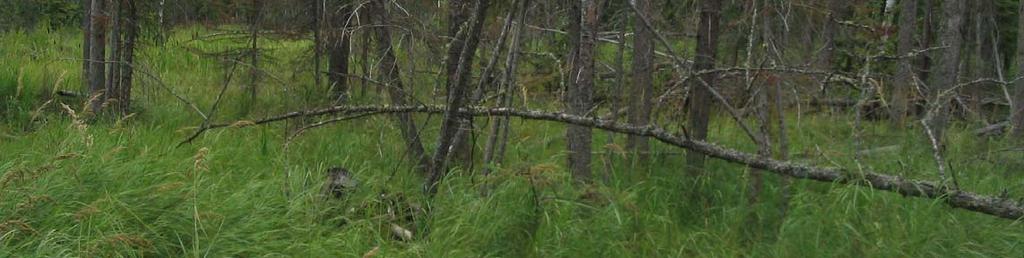
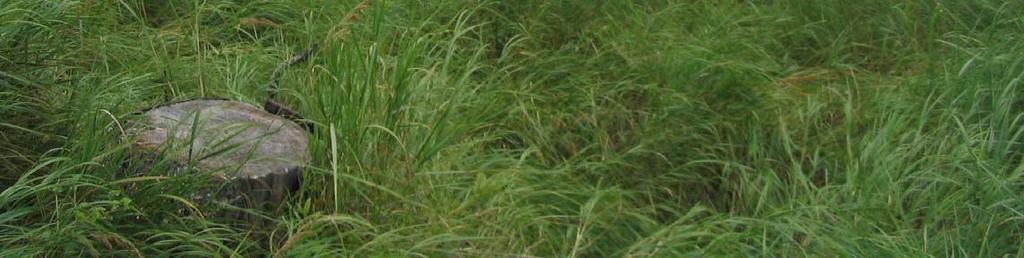
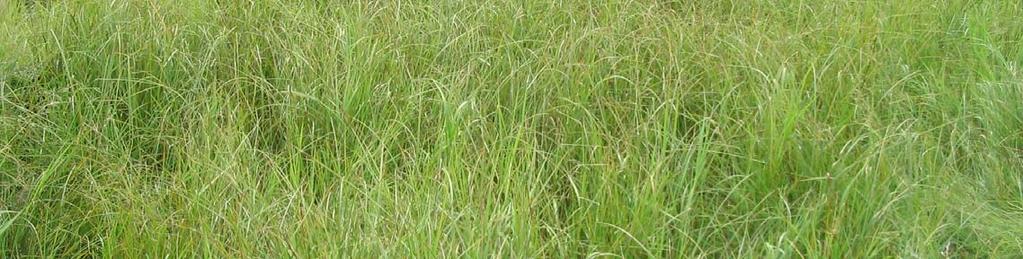
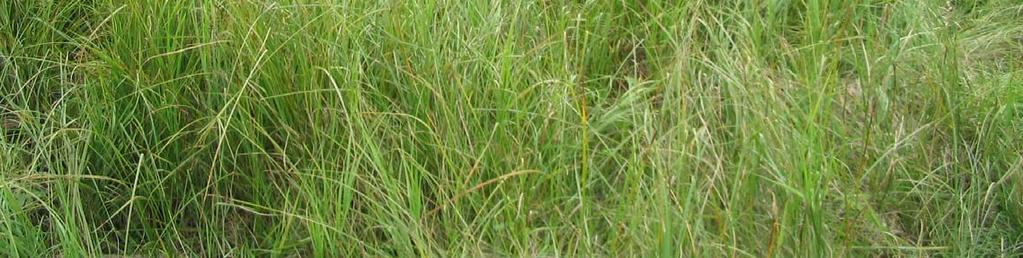
18 Site Assessment: Vegetation Assessment White spruce trees dying because of waterlogged conditions. Waterlogged conditions predate 2002 pipeline spill. Some regeneration occurring, but growth is inhibited because of salt water spill. Restoration plan for site reclamation provided to client.
19
20
21

22

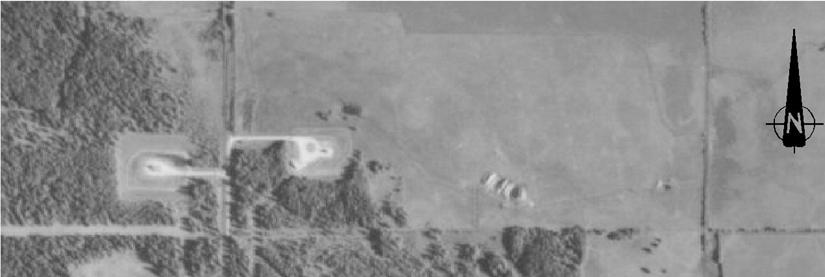
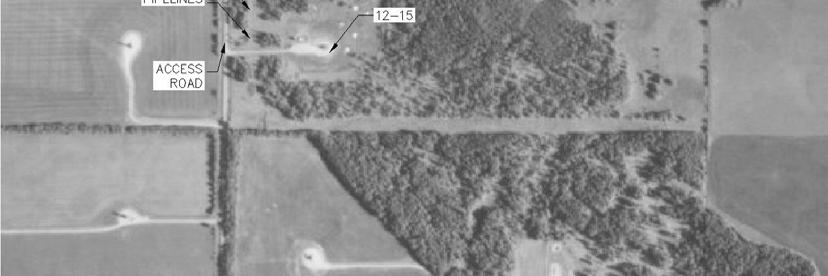
23 Site Assessment: Air Photo Review Drainage direction

24 Site Assessment: Air Photo Review

25 Site Assessment: Air Photo Review

26 Site Assessment: Air Photo Review
27 So How Will We Clean Up This Site? Trees not killed by salt spill. Chloride concentrations not affecting bedrock aquifer. Chloride plume moving, but decreasing over time. What s the process? Can this be sustained and at what rate?
28 Conceptual Salt Leaching Model Q (infiltration rate) Mixing Zone Chloride in in soil soil and and groundwater Chloride Transport rate
29 Conceptual Transport Model Infiltration Through Recharge = Vr Groundwater Flow into Centroid = Vi Final Volume = Vi + Vr +Vu Upward Groundwater Flow = Vu
30 Conceptual Transport Model Vr,1 Vr,2 Vr,3 Mi/Vi C1 C2 C3 Vu,1 Vu,2 Vu,3 Time Step 1 Time Step 2 Time Step 3
31 Model Calculation Results Chloride Concentration (mg/l) Dissolved Chloride Concentration Profile Along Plume Drinking Water Guidelines Fall 2002 (Estimated) Fall 2003 (Predicted) Fall 2004 (Predicted) Fall 2005 (Predicted) Fall 2006 (Predicted) Distance from Pipeline Break Area
32 Groundwater Quality Dissolved Chloride Concentration Profile Along Plume Chloride Concentration (mg/l) Spring 2005 Spring 2006 Fall 2006 Drinkingw ater Guidelines 05MW06 05MW09 05MW11 05MW04 05MW Distance from Pipeline Break Area
 Fall 2005 (Predicted) Fall 2006 (Predicted) 05MW10 0 50 100 150 200 Distance from Pipeline Break")
33 Model Calculation Results (Comparison to Analytical Data) Chloride Concentration (mg/l) Dissolved Chloride Concentration Profile Along Plume 05MW06 05MW09 05MW11 05MW04 Spring 2005 Spring 2006 Fall 2006 Drinkingw ater Guidelines Fall 2004 (Predicted) Fall 2005 (Predicted) Fall 2006 (Predicted) 05MW Distance from Pipeline Break Area
34 Fate and Transport: What processes are occurring? Upward vertical groundwater flow direction (Vu): salts not being transported deeper; and enhances soil flushing. Horizontal flow 45 m/year (Vi): provides natural flushing capacity. Infiltration rate (Vr): provides groundwater recharge; and enhanced by ponding (drainage course disrupted).
35 Fate and Transport: So what does this tell us? Met remedial objectives within four years of the spill. Natural attenuation effective for remediating this salt spill.
36 Revisit to Remediation Options Traditional Dig and Dump ($2.1M to $2.5M). Pump and Treat $1.0M to $1.3M. Natural Attenuation: $50,000 for site assessment; $10,000 for predictive modelling; and $20,000 for ongoing EM survey and groundwater quality monitoring (3 years). Preferred Remediation Option? cost Saving of $900,000 to $2.3M; remediation complete within 4 to 6 year timeframe; and minimal surface disturbance.
37 Important Considerations for Predictive Modeling Site Assessment: EM survey and attenuation with time (mass spreading with time). What s the process? Can this be sustained and at what rate? Impact of Cl off site?
38 Next Steps for the Site Continue monitoring (EM survey, groundwater quality). Evaluate EC/SAR in soils and need for amendments. Engage stakeholders [Alberta Environment (AENV)/landowner]. Implement restoration plan: improve surface drainage after remediation goal achieved; and revegetate area and weed control.
39 Questions??

40