Water Quality in Rice and Pike Lakes. Ryan Haney Water Resource Specialist Center for Watershed Science and Education UW Stevens Point
|
|
|
- Jeffry Elliott
- 5 years ago
- Views:
Transcription

1 Water Quality in Rice and Pike Lakes Ryan Haney Water Resource Specialist Center for Watershed Science and Education UW Stevens Point


2 Tonight s discussion How do we measure water quality? How is the water quality in Pike and Rice Lakes? How does the landscape affect the lakes? What can be done to sustain or improve the water quality for future generations?
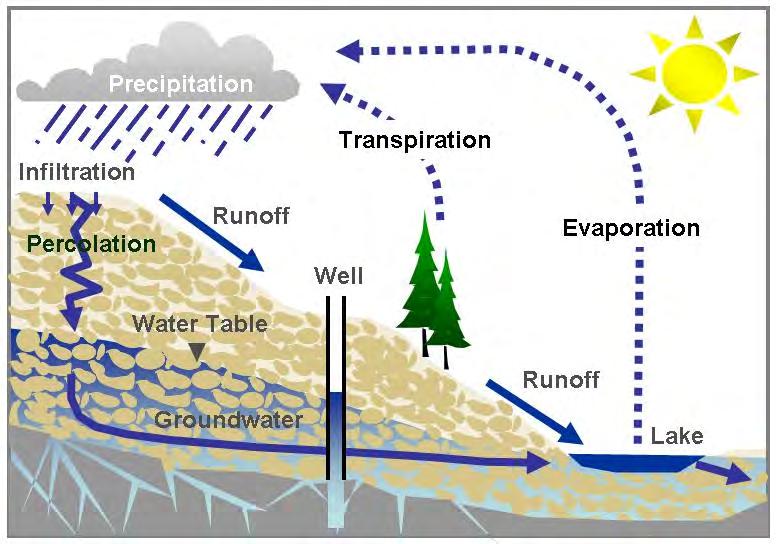
3
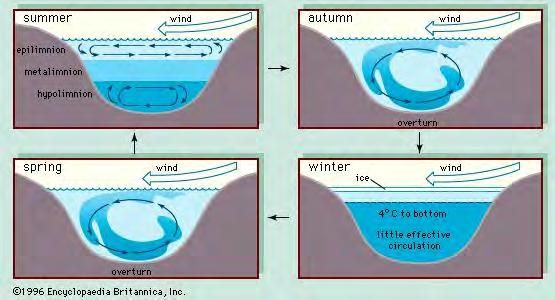
4 Mixing & Stratification

5 Water Quality Dissolved Oxygen Water Clarity Nutrients Minerals and Pollutants Algae Zooplankton


6 Dissolved Oxygen Comes from atmosphere & plants Important to aquatic organisms Changes with depth and season

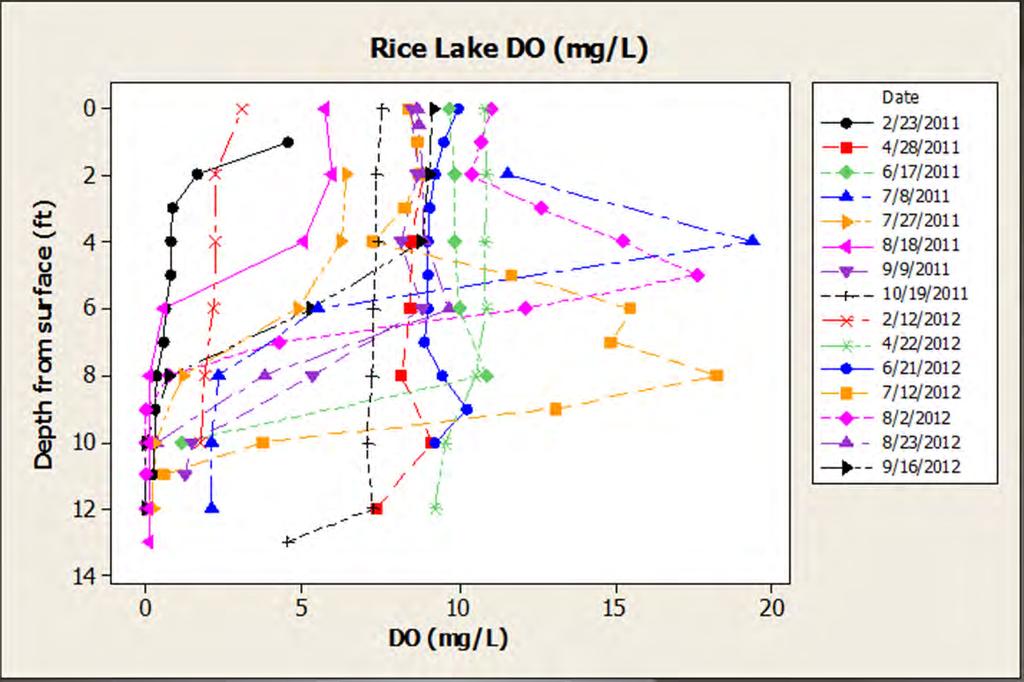
7 Dissolved Oxygen


8 Water Clarity Measure of light penetration in water Effected by Color Sediment Algae Controls depth aquatic plants can grow
9 Water Clarity

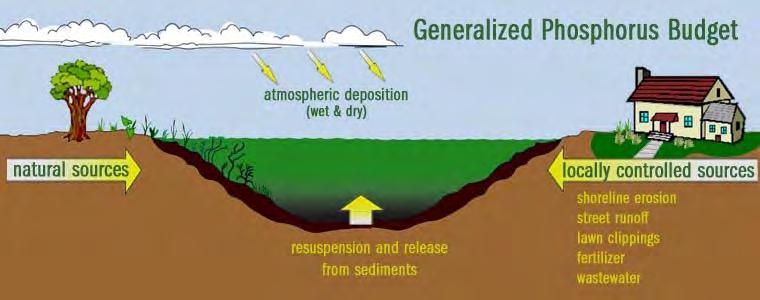
10 Nutrients Phosphorus Nitrogen
11 Rice Lake Nutrient Scorecard GOOD Total P (ppb) FAIR POOR 38.3 (Summer) Inorganic N (ppm) 0.82 (Spring) 33 Chlor a (µg/l) Clarity (feet) 5
12 Pike Lake Nutrient Scorecard GOOD Total P (ppb) (Median summer concentration) FAIR 28.5 Inorganic N (ppm) 0.6 (Spring) Chlor-a (µg/l) 15.8 Clarity (feet) 4.9 (Summer) POOR


13 Rice Lake Wisconsin Phosphorus Standard Shallow Groundwater Drainage Lakes (40 μg/l) Pike Lake Wisconsin Phosphorus Standard Deep Drainage Lakes (30 μg/l)
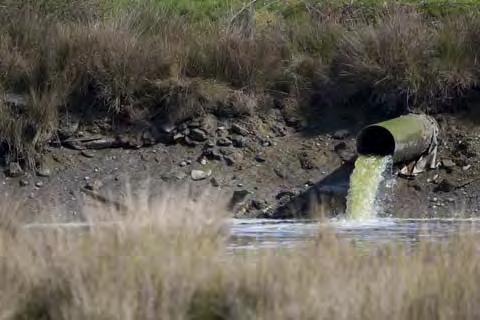
14 Pollutants Sulfate Chloride Potassium Sodium
15 Rice Lake Potential Contaminants (mg/l) LOW MEDIUM HIGH 7.9 Sulfate 10.1 Chloride Potassium 1.6 Sodium 2.7 Atrazine <0.01 µg/l
16 Pike Lake Potential Contaminants (mg/l) LOW MEDIUM Sulfate 6.6 Chloride 8.7 Potassium 1.4 Sodium 2.5 Atrazine <.01µg/L HIGH

17 Algae Blue green dominant Species typical of eutrophic lake
18 Algae Diatoms dominant Species typical of eutrophic lake
19 Zooplankton Rice Lake: Slightly diverse Typical of lakes transitioning to eutrophic Pike Lake: Moderately diverse Typical of lakes transitioning to eutrophic
20 Conclusions Rice Lake Many water quality indicators suggest that Rice Lake is a nutrient rich lake. Indicators included water analyses, physical measures of the lake, and the composition of the algal and zooplankton communities. Dissolved oxygen fell below concentrations needed to support many fish species in winters of 2011 and 2012; however, some fish may move to Pike Lake prior to stress. Summer median total phosphorus concentrations were 53 μg/l and 23.5 μg/l in 2011 and These are close to Wisconsin s phosphorus standard of 40 μg/l for shallow drainage lakes. Inorganic nitrogen concentrations averaged 0.8 mg/l. Concentrations above 0.3 mg/l are sufficient to enhance algal blooms throughout the summer.
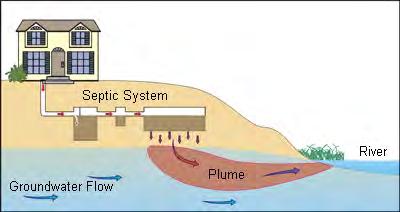
21 Recommendations Rice Lake Owners of private wells should have their well water tested to determine if well water nitrate concentrations are safe for consumption. Monitoring should be conducted for water clarity, phosphorus, chlorophyll a, and inorganic nitrogen to evaluate changes over time. Monitoring strategy should include summer samples and spring/fall overturn samples. Dissolved oxygen should be monitored during periods of ice cover. Efforts should be made to reduce nutrient inputs into Rice Lake. The best way to reduce nutrients in the lake is to look to the landscape where most of the lake s phosphorus originates. Changes in land management practices throughout the watershed could have very positive effects in the lake.
22 Conclusions Pike Lake Many water quality indicators suggest that Pike Lake is a nutrient rich lake. Indicators included water analyses, physical measures of the lake, and the composition of the algal and zooplankton communities. The sediment analysis suggested that the lake was not always this nutrient rich. Dissolved oxygen at the deep hole fell below concentrations needed to support many fish species in winters of 2011 and 2012; however, the aeration system insured that the fishery had sufficient oxygen. Summer median total phosphorus concentrations were 31 μg/l and 26 μg/l in 2011 and These are close to Wisconsin s phosphorus standard of 30 μg/l for deep drainage lakes. Inorganic nitrogen concentrations averaged 0.6 mg/l. Concentrations above 0.3 mg/l are sufficient to enhance algal blooms throughout the summer.
23 Recommendations Pike Lake Owners of private wells should have their well water tested to determine if well water nitrate concentrations are safe for consumption. Monitoring should be conducted for water clarity, phosphorus, chlorophyll a, and inorganic nitrogen to evaluate changes over time. Monitoring strategy should include summer samples and spring/fall overturn samples. Dissolved oxygen should be monitored during periods of ice cover. Efforts should be made to reduce the nutrient concentrations in Pike Lake. Indicators suggested that the lake is currently in a stable state, but may be approaching a potential state of flux. The best way to reduce nutrients in the lake is to look to the landscape where most of the lake s phosphorus originates. Changes in land management practices both near shore and throughout the watershed could have very positive effects in the lake.

24 Acknowledgements Marathon County Citizens and Lake Groups Marathon County Wisconsin Dept. of Natural Resources UWSP Water and Environmental Analysis Lab Algae Dr. Bob Bell Aquatic Plants Jen McNelly Cultural Survey Dr. Kristin Floress Fisheries and Lake Maps Drs. Ron Crunkilton and Justin Sipiorski Christine Koeller Sediment Cores Dr. Samantha Kaplan and Paul Garrison (Wisconsin DNR) Shoreland Assessments and Build Outs Dan McFarlane Water Quality and Watersheds Nancy Turyk, Paul McGinley, Ryan Haney, Danielle Rupp Zooplankton Dr. Chris Hartleb UW Stevens Point Undergraduate Students

25 Questions?