Save Energy Now Energy Savings Assessments
|
|
|
- Meagan McLaughlin
- 5 years ago
- Views:
Transcription
1 Save Energy Now Energy Savings Assessments New Energy Expert Training December 12, 2006 Bob Gemmer, Technology Manager Industrial Technologies Program 1
2 Global Energy Challenges Growth in demand for limited resources have increased prices and market volatility, impacting national energy security, economic security, and environmental quality National energy security: Global oil and gas reserves are in unstable areas and flexible alternatives are not readily available. Economic security: Rising prices hurt America s ability to remain competitive in the global market place. Global Warming: Global concerns regarding carbon emissions and climate change are forcing businesses and governments to rethink their strategies on energy fuels. Natural Gas Prices, Henry Hub Consideration of these challenges has led the US government to reevaluate how it can most effectively respond. $ per Million Btu $ per Barrel Spot Oil Price, West TX Intermediate
3 Projected Energy Use Total U.S. Energy Production vs. Consumption, Quadrillion Btu per year Total U.S. Consumption Total U.S. Production Critical Gap Source: Energy Information Administration projections 3
4 Current U.S. Policy Environment Increased Public Awareness of Energy Issues Immediate Opportunity Implementation of Energy Policy Act 2005 (EPACT) Congress may consider additional measures General U.S. Approach Public/Private Partnerships--Engage business wherever possible Building America Building Energy Codes Program Energy Star Save Energy Now Program Leading by Example Federal Energy Management Program 4

5 5

6 Electric Power Annual with data for 2004 Report Released: November 2005 Next Release Date: November
7 Existing Capacity by Energy Source, 2004 (Megawatts) Net Summer Capacity Net Winter Capacity Energy Source No. of Generators Generator Capacity Coal[1] 1, , , ,364 Petroleum[2] 3,175 37,970 33,702 37,339 Natural Gas 3, , , ,391 Dual Fired 3, , , ,399 Other Gases[3] 119 2,535 2,296 2,259 Nuclear ,560 99, ,377 Hydro (Conventional) 3,995 77,130 77,641 77,227 Other Renewables[4] 1,608 21,113 18,763 19,000 Pumped Storage ,569 20,764 20,676 Other[5] Total 16,770 1,049, , ,749 7
8 Planned Nameplate Capacity Additions from New Generators, by Energy Source, 2005 through 2009 (Megawatts) Energy Source Coal[1] ,064 1,879 8,122 Petroleum[2] Natural Gas 15,216 12,499 16,013 9,895 5,451 Dual Fired 4,916 1,924 5,236 2,649 1,860 Other Gases[3] Nuclear Hydro (Conventional) Other Renewables[4] 2, Pumped Storage Other[5] Total 23,846 15,616 23,967 15,153 15,441 8
 energy saving teams 4.")
9 Easy Ways to Save Energy Campaign In Fall 2005 DOE created four initiatives In response to supply shortages and skyrocketing natural gas prices: 1. Energy Hog campaign Public Service Announcements 2. Energy Savers tips to help homeowners save energy 3. Federal Energy Management Program (FEMP) energy saving teams 4. Industrial Technologies Program (ITP) Save Energy Now 9
10 Industry: Critical to National Energy Policy Uses more energy than any other single sector; >1/3 of U.S. energy consumption Produces approximately 30% of U.S. greenhouse gas emissions Accounts for more than 35% of U.S. natural gas demand 2002 Energy Use Industry 33.4% Transportation 27.2% Accounts for 28% of U.S. electricity demand Energy is key to economic growth in domestic manufacturing Residential 21.5% Commercial 17.9% Many companies have been unable to pass higher energy costs on to their customers, which has sharply reduced their profit margins National Energy Policy, pages
11 Heavy Energy Use in Process Industries* 3.9 Quads Bulk 5.9 Quads Raw Commodity Materials Products Natural Resource Extraction Industries Mining Forestry Farming Oil & Gas Extraction 6.5 Quads Oil & Gas Feedstocks * 1998 estimates based primarily on MECS and AER data Includes electricity generation, transmission, and distribution losses ** Includes 6.5 Q oil & gas feedstocks 25.5 Quads** Process & Materials Industries Chemicals Paper & Wood Metals Non-metals Petroleum Refining Food Processing Fabrication & Assembly Industries Retail Markets Plastics Fabricated Metal Products Transportation Equipment Machinery Computer & Electronic Products Electrical Equipment Printing Construction 11
12 The Context America s businesses, factories, and manufacturing facilities use massive amounts of energy. To help them during this period of tightening supply and rising costs, our Department is sending teams of qualified efficiency experts to 200 of the nation s most energy-intensive factories. Our Energy Saving Teams will work with on-site managers on ways to conserve energy and use it more efficiently. Secretary of Energy Bodman National Press Club October 3,


13 The Industrial Technologies Program (ITP) Delivering technology solutions to make American industry the global leader in high-impact, clean, efficient, energy technologies and practices. Collaborative R&D Energy-intensive Process Technologies Crosscutting Technologies Partnerships Technology Delivery Assessments Training & Tools Technology Demonstrations 13
 Secretary Bodman at the Caterpillar Tractor ESA In-depth experience in conducting plant energy assessments Strong partnerships and")
14 ITP Mobilized Existing Capabilities Suite of respected software tools for assessing plant systems Established training programs Cadre of Qualified Specialists in various assessment tools/systems Network of university-based Industrial Assessment Centers (IACs) Secretary Bodman at the Caterpillar Tractor ESA In-depth experience in conducting plant energy assessments Strong partnerships and high credibility with influential companies in the manufacturing sector 14


15 Assessments Build on Existing Resources Established training programs on software tools Cadre of Qualified Specialists in various assessment tools/systems Network of university-based Industrial Assessment Centers (IACs) In-depth experience in conducting plant energy assessments using DOE tools. Internet Info Resources EERE Information Center at
16 Save Energy Now: The Industrial Component of Easy Ways to Save Energy Conduct energy savings assessments of the most energy-intensive U.S. plants Work with partners to create awareness and find energy savings solutions Disseminate energy savings information & tools to 50,000 plants to help reduce natural gas and electricity use. 16

17 Save Energy Now Goals Encourage industry to voluntarily reduce its energy usage in a period of tight supplies by working with America s largest energyintensive plants Create momentum to significantly improve energy efficiency practices throughout the manufacturing sector 17
18 Energy Savings Assessments Overview 18

 Targeted system assessments (quick focused) Annual savings opportunities identified: > $250 million")
19 Plant Energy Assessments Small/Medium Plant Assessments Large Plant Assessments Plants with energy consumption $100,000 to $2 million Over 500 assessments per year Average plant savings: 4.2 billion Btus (about $21,000) Conducted by industrial assessment centers at 26 universities Over 120 assessments underway or completed Plant wide assessments (comprehensive) Targeted system assessments (quick focused) Annual savings opportunities identified: > $250 million Average identified energy savings per plant: 10-15% Annual savings implemented ~$30 million 19

20 Energy Savings Assessments Assessments of targeted industrial systems by Qualified Specialist using the DOE software tools ESA Report identifies potential energy and cost savings Plants are selected by DOE based on several factors, including: The plant s energy consumption The company s intention to include other similar plants within their company 20
21 Relatively Few Plants Use the Most Energy Number of U.S. Plants 250, , , ,000 50,000 U.S. Manufacturing Plants: By Size 226, , ,636 Percent of Total Industrial Energy Small & Medium 47% Large 53% 6,802 Annual Energy Costs 0 Small Plants <$100K Mid-Size Plants $100K-$2M Large Plants >$2M All U.S. Plants 1998 EIA MECS 21
22 Energy Savings Teams Teams Composed of DOE Qualified Energy Experts and Plant Personnel Teams will focus on one of five DOE efficiency tools Plant personnel and affiliates will be trained on DOE efficiency tools Electro-chemical 2% Other 4% Facilities 8% Process Cooling 1% Motor Systems 12% Process Heating 38% Steam 35% Manufacturing Energy Use by Type of System (%) Note: Does not include off-site losses 22
23 Schedule Oct 06 Nov 06 Dec 06 Jan Launch Energy Savings Teams Select Experts/team leaders Train 64 Experts/team leaders Enlist energy-intensive plants Conduct Assessments 23
24 Energy Savings Assessments Implementation and Results 24

25 Energy Savings Assessment Status 187 Energy Savings Assessments completed (out of 200) With 147 assessments reporting: (11/27/06) Total potential natural gas savings of 41 trillion Btu per year equal to 564,000 U.S. homes Total cost savings potential identified = over $388 million per year While [Dow] has been a leader in energy efficiency, with DOE s help, we found yet more cost-effective opportunities to save precious energy. Completed Assessments Scheduled Assessments John Dearborn, Global Business VP, Energy, Dow 25
26 Many Opportunities Found < 9 months 44% Examples: Improve insulation Implement steam trap program Clean heat transfer surfaces > 4 years Example Install CHP system 35% 6% 15% 9 months-2 years Examples: Heat feedwater with boiler blowdown Lower excesss oxygen Flue gas heat recovery 2 4 years Modify steam turbine operation Use oxygen for combustion Change process steam use After 6 months, energy savings implementation (9/06): 42 plants implementing projects that will save $11 million (including replication at other plants in company) Initial 147 assessments are identifying average of $2.5 Million energy savings per plant 26
27 Total Energy Savings By 2008, the Assessments of 2006 will annually save the energy carried by 10 LNG tankers. 27
28 ESA Results Industry Energy Use (Quads) Chemicals 7.8 Petroleum Refining 7.3 Forest Products Iron & Steel Food Processing Aluminum Non-Mfg / $341 MillionTotal Annual Savings Other Mfg. 6.2 Source: DOE/EIA Monthly Energy Review 2004 (preliminary) and estimates extrapolated from MECS
29 Save Energy Now Assessments in 2007 (200 in 06) On-Line application again More energy system types Add compressed air, pump, and fan systems to existing process heating and steam systems Publicity & Case Studies for replication Recognition program being developed 29
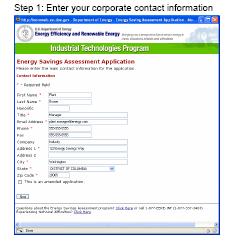
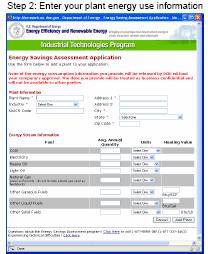
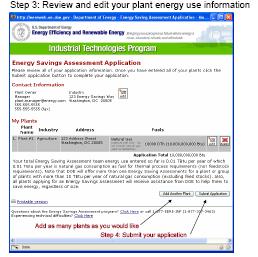
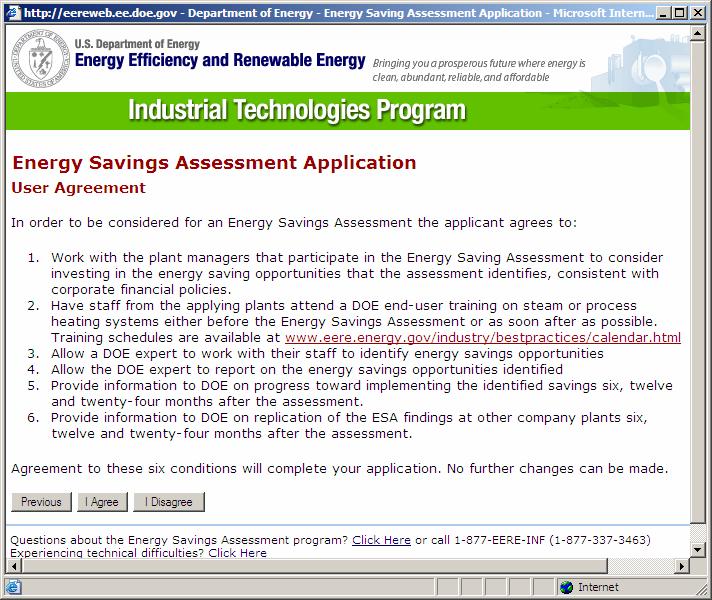
30 Application 30
31 Save Energy Now 2007 Multiple Ways for Plants to Qualify Plants using >1 Trillion Btu annually (not involved in 06) 2006 Assessment Plants can participate again must do different energy system & share the cost ~50% Plants <1TBtu can aggregate with other plants to meet 1T Btu threshold all plants get assessment (10 max) must share the cost ~50% 3 rd Parties can apply on behalf of plants ~50% sharing of cost required utility, state energy office, non-profit consortium, etc. 31
32 Application Status As of 11/27/ Applications received (after elimination of spurious applications) 86 exceeded the 1 Trillion Btu/year threshold 43 exceed 1 Trillion Btu/year natural gas consumption 32
33 All Industrial Plants Get Assistance For plants applying who do not meet the criteria for an Energy Savings Assessment, other assistance will be offered such as: Industrial Assessment Center assessment Personalized phone consultation to address energy efficiency in their plant Self assessment tools Information products, DOE software tools and training 33

34 Energy Savings Assessment Process Gather Preliminary Data Conduct Plant Visit Analyze & Report Results Follow-up Train Plant Staff Teams are DOE Energy Experts and plant personnel Teams focus on fans, pumps compressors, steam or process heating systems. Plant personnel trained on DOE software tools 34
35 Assessment Expert spends 3 days on site Day 1 Safety briefing, tour plant Overview of DOE Tool to plant personnel Agree on potential energy efficiency opportunities to investigate Initiate Data Collection For Potential Opportunities Day 2 Continue data collection Apply DOE tool to quantify potential opportunities Plant lead & expert agree on opportunity results Day 3 Wrap up tool analyses Plant lead & expert ensure they agree on opportunity results Closeout meeting in p.m. to review results 35

36 Give a man a fish and he will eat for a day Teach a man to fish and he will eat for a lifetime 36

37 ESA Goal: Replication Industry Replication Plant Project Impacts Company Replication 37
38 Partnerships and Outreach 38

39 Technology Delivery Industrial Assessment Centers No-cost assessments provided to eligible small & mid-size plants by universitybased teams Technology Demonstrations ITP solicits proposals to install and fieldtest emerging technologies Plant-wide Assessments Up to $100K in EERE funds competitively awarded to large plants through an open solicitation process. Cost-shared funding pays for third-party analysis Technical Assistance Websites, newsletters, case studies, tip sheets, technical briefs, clearinghouse, allied partners, Regional Offices, showcases, energy events, etc. Tools and Training Training in practices and software to improve the energy performance of plant systems 39

40 Robust Partnerships to Reach Plants Allied Partners States Utilities Equipment Suppliers & Service Companies Trade Associations Replication within Industrial Companies 40


41 Save Energy Now Outreach Goal: 50,000 Plants Utilize a wide variety of information materials, web tools and technical assistance Work with our existing partners and develop new partnerships to significantly increase our reach 41

42 Energy Matters BestPractices 8-page quarterly newsletter provides topical feature stories, guest articles by subject matter experts, case studies, efficiency tips, and program information. Topics include System-level efficiency Financing energy projects Selling Projects to Management Serves as a form of push communication to an audience of approximately 27,000 plant engineers, managers, and operators, academia, and government agencies. 42

43 ITP E-Bulletin A monthly update of key program and technology developments of interest to industrial partners, featuring Headlines New ITP Products and Resources Training Project Opportunities Case Studies 43

44 Save Energy Now Website Save Energy Now Website 44


45 Information, Tools and Training Tip sheets, case studies, brochures, technical briefs etc. Energy Matters newsletter Industrial Technologies Monthly E-bulletin Software tools Training workshops and webcasts Web sites New: Packets of Information for Plants Save Energy Now CD 45

46 EERE Information Center Information on EERE products/services Unbiased, customized technical and programmatic assistance to help achieve industrial energy savings Experts help thousands of industries as well as consultants, vendors, government agencies, and others that serve them Voice: Fax:

47 The IAC National Webcast Lecture Series Lectures by distinguished professors who in addition to being internationally recognized experts in their fields, serve as directors of the DOE sponsored Industrial Assessment Center located at their universities. Energy Efficient Building Management Strategies Measuring and Improving Boiler Efficiency Combined Heat and Power Optimizing Combustion Systems Steam System Management Download FREE at 47