Which Data Are Important And Why? Barry Tonning Tetra Tech
|
|
|
- Violet Cobb
- 5 years ago
- Views:
Transcription

1 Which Data Are Important And Why? Barry Tonning Tetra Tech

2 Last week... In-stream monitoring parameters Chemical, physical, biological Including in-stream habitat parameters Bank area assessment Vegetation, bank stability
 background on NPDES discharge permits and Water Quality Standards How data are used in assessments Identifying which data are")
3 Today s Outline Assessing land uses, land cover, and land management practices Brief (!) background on NPDES discharge permits and Water Quality Standards How data are used in assessments Identifying which data are important purdue.edu/~inwater/
4 Measurements and other parameters in the upland regions

5 Measuring aspects of the upland regions Agricultural areas Logging and mining sites Towns and cities Hot spots Commercial strips Industrial facilities

6 Analysis of upland land uses, land management practices, and specific activities/sites can help to identify possible water quality problems

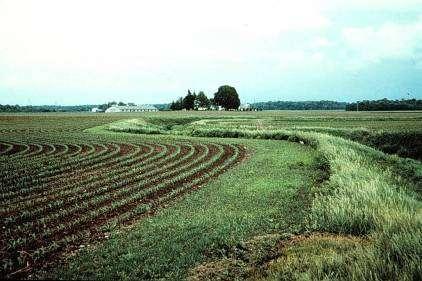
7 Aerial photography good screening and targeting tool Check photo dates!

8 Hancock Creek CSX Railroad Line
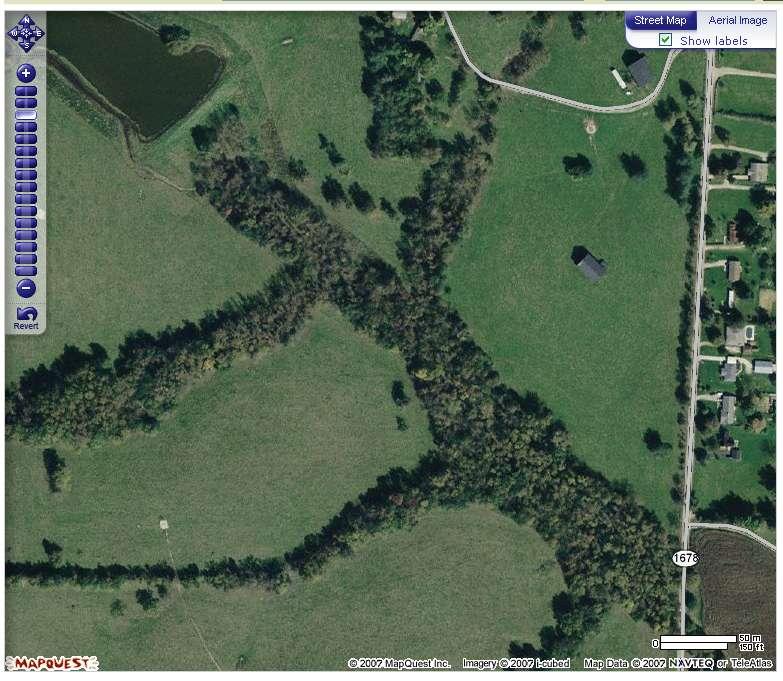
9

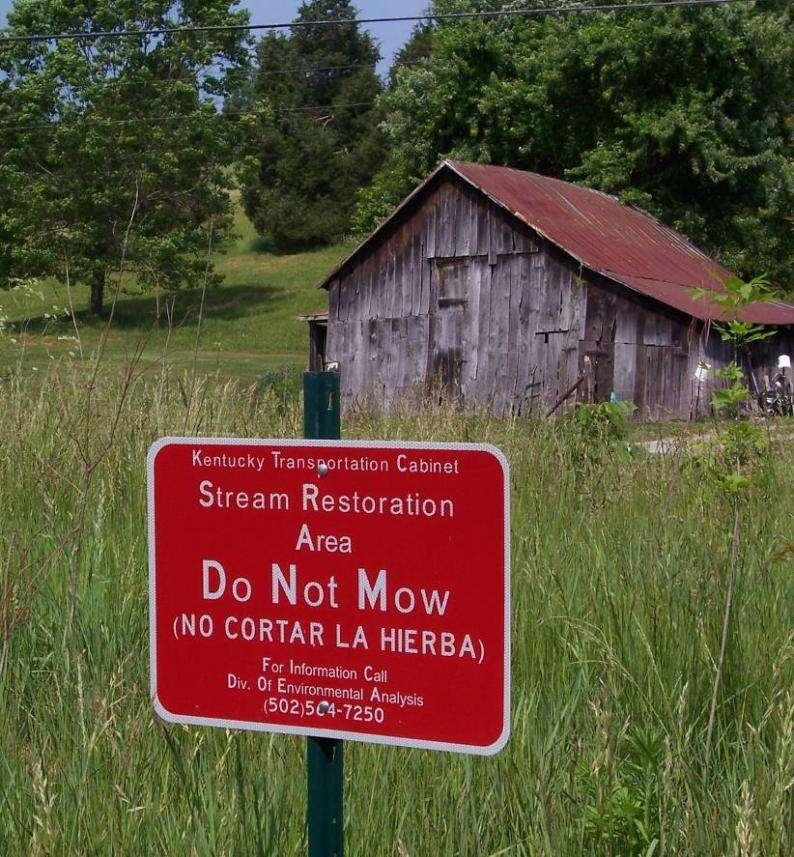
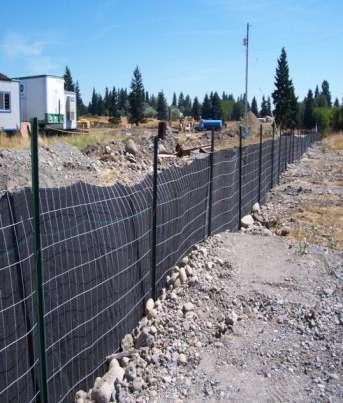
10 Van Meter Road Hancock Creek Riparian Area Fence Line Riparian Area Fence Line

11 Topography: how does it affect rainfall & snowmelt runoff?
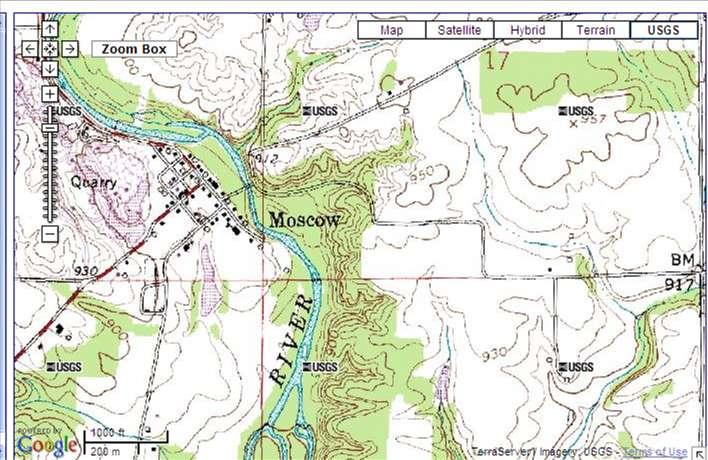
12


13 Soil data type, infiltration, erodibility, slopes
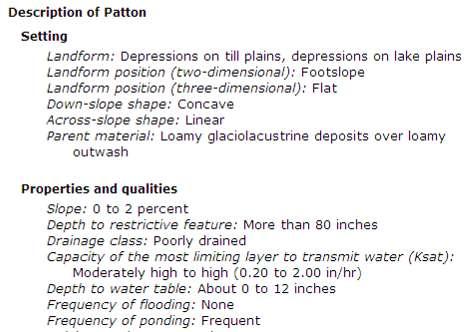
14

15 Land use/cover analysis
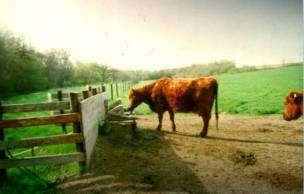
16 What does land use/cover tell you about water quality? Urbanized landscapes Rapid runoff, channel erosion, more metals, higher temperatures, oil & grease Suburban areas Lots of sediment during construction, lawn fertilizer, pet waste Row crop land More sediment, fertilizer, pesticides, herbicides Livestock operations Manure-related nutrients (nitrogen & phosphorus), compacted soils

17 Land management practices can also affect water quality

18 Windshield & detailed surveys of management practices provide info on potential sites for BMPs

19 Timber harvest demand potential

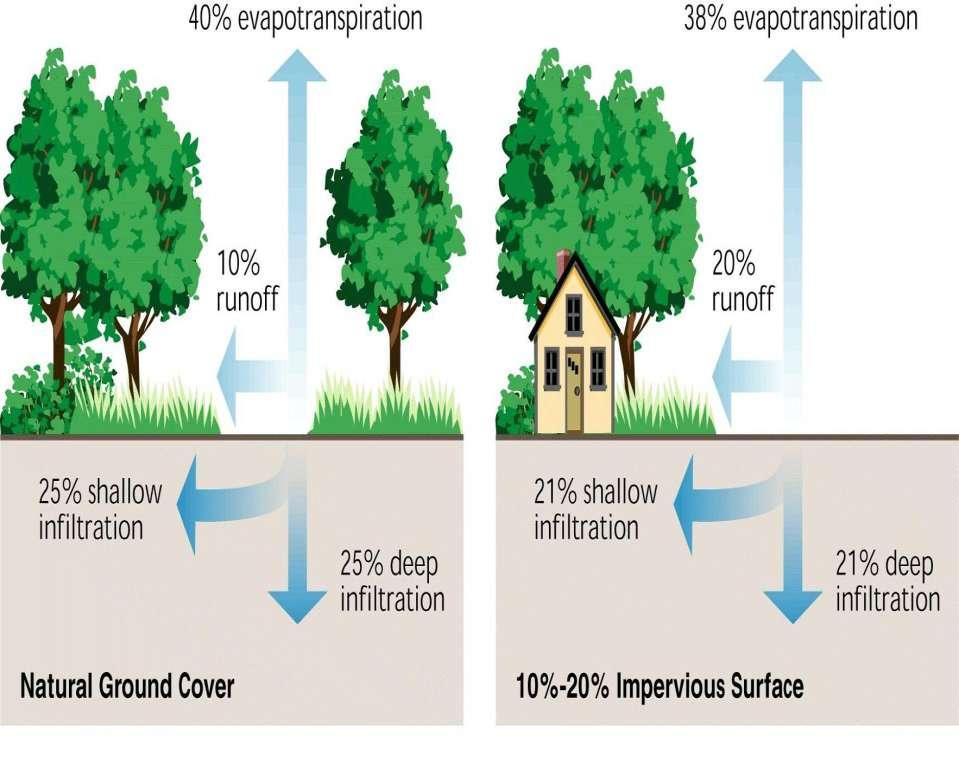
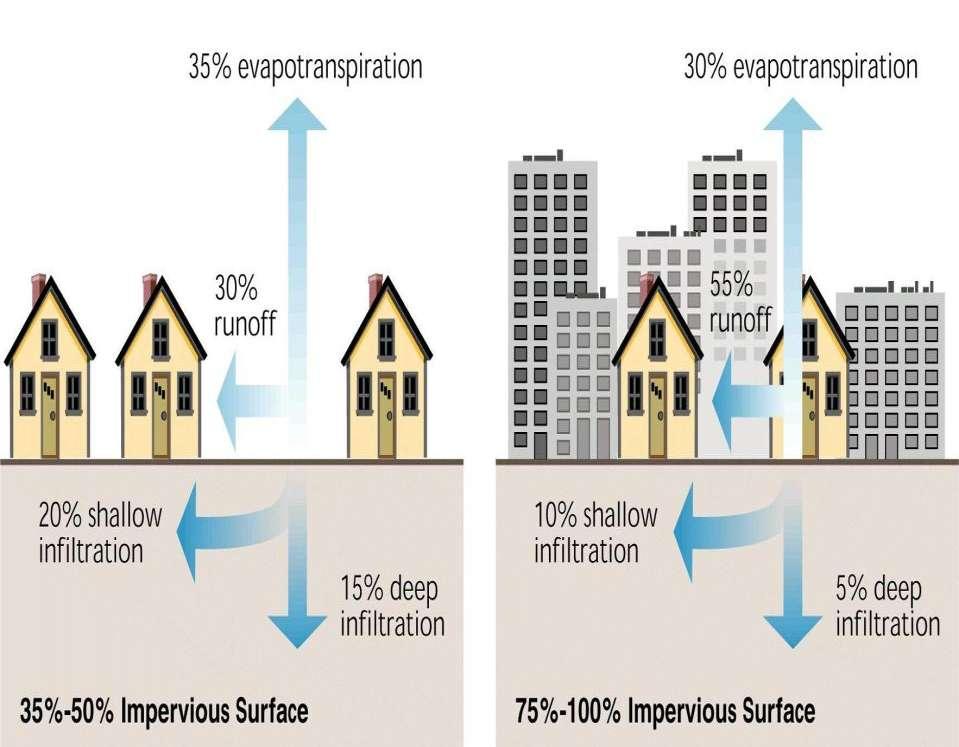
20 Urban impacts: imperviousness, sewage treatment & management
21 Effects of Development on Stormwater Runoff Increases: Impervious surface area Stormwater volume Stormwater velocity Deposition of pollutants Decreases: Stormwater quality Ground water recharge Base flow Natural drainage systems including riparian vegetative cover
22
23


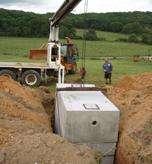
24 Sewage treatment plants and CSOs
25 Municipal separate storm sewer systems (MS4s) (Indiana Rule 13) MS4 Sanitary Sewer

 Storm water samples")

26 Storm water, septic systems, & construction site management (Rule 5) Storm water samples taken by an automatic sampler during a oneinch rain


27 Hot spots: legacy and/or existing contaminant sources T & T Mine Blowout, 1994
28 Questions

29 What makes your monitoring and When it: assessment data important? Indicates if water poses a human health threat Determines if it can support fish & other aquatic life Identifies a significant and likely source of problems Shows trends that water quality is declining... or improving!

30 A point to ponder... If you have one data point on a water body, you have infinitely more information about that water body than if you have zero data points.... because one is infinitely greater than zero Brian Reeder

31 Identifying and characterizing point and nonpoint pollution Some pollutants come from point sources Others come from nonpoint sources Some come from both...

32 How the Clean Water Act implements the public s demand for clean, healthy surface waters: Pollutant discharge controls and limits thru NPDES permits Water quality standards that specify beneficial water body uses, minimum criteria, and prevention of degradation
33 CWA Discharge Permits (Section 402) If you discharge: Pollutants (chemical, physical, biological) From a man-made pipe or conveyance Into a regulated water body ( water of the U.S. ) You must have permit coverage under the National Pollutant Discharge Elimination System (NPDES)


34 NPDES Program: Coverage Industrial and municipal wastewater Industrial, urban, and construction-related storm water runoff Concentrated animal feeding operations (CAFOs) Active, inactive, and some abandoned mines Discharges from RCRA remedial action activity meeting point source definition

35 Water Quality Standards State s yardstick to measure health of waters Three key elements of WQSs: Designated uses Water quality criteria Antidegradation provisions


36 Example Use Designations Aquatic life support warmwater & coldwater aquatic habitat Primary contact recreation swimming Secondary contact recreation boating and fishing Fish consumption eating fish Drinking water domestic water supply

37 Water Quality Criteria Developed to protect designated uses Basic types of criteria Narrative/numeric Water column/ sediment/fish tissue Criteria can relate to: Aquatic life Human health Wildlife

38 Water quality criteria in Indiana code

39 Examples of nonregulatory water quality targets used in Indiana

40 What we re trying to do: Identify problems Water quality impairments, threats, trends downward Characterize problems Use indicators to ID stressors, sources, and relative magnitude Fix problems BMPs selected, sited, sized, and operated to address specific issues Check up on the fix Post implementation monitoring & adjustment
41 Screening for problems & threats What do you know about water quality, land use, land cover, and management? Does the water body meet the numeric and narrative criteria for its designated uses? If not, what are the problems & sources? If so, what are the trends improving, or declining?
 use, i.e., transportation Bike is impaired")
42 roblem: Resource is not supporting its designated (beneficial) use, i.e., transportation Bike is impaired Cause of the impairment: Failure to meet numeric criterion for minimum tire pressure Stressor Source???
43 Summary of the overall process Water meets criteria limits? No No Review WQ data or conduct monitoring Yes Is water quality stable or improving? Yes Are problem parameters known? No Yes Monitor/protect the watershed Install, operate, & maintain BMPs ID & characterize pollutants/stressors ID & characterize sources, magnitude Identify BMP types, size, #s, locations
")
44 We can t monitor for everything We need to focus our efforts Use existing data to get started Biological & visual assessments are good for screening purposes If necessary, follow up with instream (or upland) assessments
45 Data needs overview Biota type & #s OK? Yes Bacteria counts OK? Yes No Monitor for sitespecifics, trends No Water quality info: Dissolved oxygen Temperature ph Turbidity/sediment Conductivity Instream habitat Nutrients (N&P) Metals, organics, etc Land-based info: Land use & cover Land Mgmt Practices Septic systems Ag crop & livestock Bank stability Riparian vegetation Wildlife populations Discharger info: WWTPs Industrial plants Industrial stormwater Construction stormwater sites MS4s Illegal dump sites
 Land use information Clues to pollutant sources Land cover")
46 Which data are most important? Water quality data Defined to support use(s) Land use information Clues to pollutant sources Land cover mapping IDs rapid runoff areas Land management practices Tips on where BMPs needed

47 Water quality data Key monitoring info includes Dissolved oxygen, ph, temperature, nutrients, sediment, bacteria, pesticides, herbicides, metals Biological assessments can help screen out healthy sites Look at your results as compared to the water quality criteria and targets
48 Land quality data... Land use Percentage in row crops, pasture, animal feeding operations, residential, commercial, urban Land cover Matches land use; key info is what s impervious (paved, buildings, etc.), what s well vegetated, what s not Land management Are potential pollutants associated with the land uses managed, to prevent polluted runoff? Includes crop & livestock practices, stormwater management, lawn & garden measures
49 Pollutant Potential Sources Nutrients (N&P) Point Sources WWTPs CSOs & SSOs CAFOs MS4s Nonpoint Sources Cropland and pastures Manure application sites Landscaped/lawn/fertilized areas Pets, wildlife, & other animals Eroded soil & stream banks Malfunctioning septic systems Pathogens WWTPs CSOs & SSOs CAFOs MS4s Pets, wildlife, & other animals Land application of manure Land application septage Malfunctioning septic systems Sediment WWTPs Urban stormwater Row crop land Overgrazed pastures Timber harvest areas Stream bank erosion Unmanaged construction sites Unpaved roads / ditches Stream channel modification

50 Best management practices

51 Scoping and engaging others Somebody probably has data for your watershed Including water quality data, land use/cover info, ag stats, etc. A data search is always a good first step check web sites, e.g., purdue.edu/~inwater/

52 We want a lot from our data! We want it to be: Inclusive: covering key parameters of concern Credible: to accurately reflect water quality conditions Robust: to reflect conditions under a variety of rainfall/flow regimes Useful: helping us identify appropriate solutions Efficient: the least cost for the most benefit! The All-In-One Hammer Flask