BLACK STURGEON LAKES WATER QUALITY MONITORING
|
|
|
- Sharlene Sharp
- 5 years ago
- Views:
Transcription

1 BLACK STURGEON LAKES WATER QUALITY MONITORING 2015 REPORT

2 Prepared by: Ryan Haines, B.Sc. Biologist and Project Management Kenora Resource Consultants Inc. Site 155, Compartment 14, RR #1 Kenora, ON P9N 3W7 Phone: Satellite images, aerial photographs, and/or the figures produced from them in this report are intended for illustration purposes only and shall not be considered as official plans or drawings. ii
3 Contents 1.0 BACKGROUND METHODOLOGY RESULTS Sampling Session Dates and Locations Total Phosphorous Secchi Depths Chemical Analysis Water Quality Characteristics DISCUSSION Total Phosphorous Secchi Depths Chemical Analysis Water Quality Characteristics SUMMARY AND RECOMMENDATIONS REFERENCES... 8 APPENDIX 1 Laboratory Results for Water Quality Characteristics (2010 and 2015)... 9 APPENDIX 2 Site Dissolved Oxygen/Temperature Profiles Site Site May June July July August August September September October October Site May i
4 June July July August August September September October October Site X (4) May June July July August August September September October October APPENDIX 3 Lab Results May June July July August August September September October October ii
5 LIST OF FIGURES Page Figure 1 Map of Sampling Sites on Lower Black Sturgeon Lake 2 Figure 2 Photo Lowering of Secchi disk 3 Figure 3 Photo Transferring water sample into lab sample bottle 3 Figure 4 Photo Horizontal Beta Sampler prior to deployment 4 Figure 5 Turnover Concentrations From Site 2 in 2009, 2010, and Figure 6 Secchi Depths for Site 2 Sampling Sessions in 2009, 2010, and iii
6 1.0 BACKGROUND In the fall of 2007, the City of Kenora was presented with the results of the Lake Capacity and Management Study for Black Sturgeon Lake. One of the recommendations of this study was to conduct a water quality assessment on Lower Black Sturgeon Lake for two consecutive years to establish baseline data and then once every five years to monitor changes to the water quality in the lake. In 2009 and 2010, the City of Kenora awarded the contract to conduct the baseline data work for the first two years of water quality monitoring on Black Sturgeon Lakes to Ryan Haines Consulting. In 2015, the water quality assessment contract was awarded to Kenora Resource Consultants Inc. (note Ryan Haines Consulting was incorporated into Kenora Resource Consultants Inc. in 2012). 2.0 METHODOLOGY Ten sampling sessions were conducted during the 2015 season between May and October with one sampling session in the months of May and June and two sampling sessions in the months of July, August, September, and October. Water samples were taken at two locations on Lower Black Sturgeon Lake and one location at Upper Black Sturgeon during each sampling session. Sample locations on Lower Black Sturgeon correspond to sites identified in the Lake Capacity and Management Study for Black Sturgeon Lake. The site on Upper Black Sturgeon was added during the 2010 sampling season to help to better understand potential sources of the higher nutrient levels found at the upstream site on Lower Black Sturgeon during the 2009 sampling season. The selection of the site locations has been designed to determine the impacts of development on the water quality of Black Sturgeon Lakes. Site 2 is located at the outlet of Black Sturgeon Lakes into the Winnipeg River, Site 3 is located at inlet of Black Sturgeon Creek into Lower Black Sturgeon Lake, and Site 4 is located at the outlet of Upper Black Sturgeon Lake (Site 4) into Black Sturgeon Creek. Site 2 is the main sampling location used to assess the impacts of development on water quality because the new and proposed developments on Lower Black Sturgeon Lake are occurring upstream of this site. All field work was conducted from a small motorboat with a sonar unit mounted to the stern. At each sampling site, an anchor was used to keep the boat in one location. Temperature/oxygen profiles were obtained at Sites #2, #3, and #4 (Figure 1) during each sampling session using an YSI 55 Dissolved Oxygen Meter. One mid summer profile at Site 1 was added to determine the distribution of oxygen and temperature throughout the water column at one of the deepest sections in the center portion of the lake. 1
 over the shady side of the boat (Figure 2).")
7 Figure 1 Sampling Sites for Water Quality Monitoring on Black Sturgeon Lakes for 2015 sampling season Secchi depth was determined at each site by lowering a Secchi disk (20 cm disk with alternating black and white quadrants) over the shady side of the boat (Figure 2). The disk was lowered until the observer could no longer distinguish between the white and black quadrants and then raised until the disk came back into view. This was repeated three times and then the depths at which the disk disappeared and then reappeared were averaged to give the Secchi depth. 2
.")

8 Figure 2 Lowering of Secchi disk Lake productivity samples were collected both as a euphotic zone composite and at a depth of 1 m from the bottom. The euphotic zone is the section of the water column where enough light penetrates to facilitate algae growth (measured as 2X the Secchi depth). In order to obtain a water sample containing water from the euphotic zone, a weighted, 500 ml, small neck bottle (Figure 3) was lowered with a rope in the water column to a depth of 2X Secchi depth then quickly brought to the surface before the bottle became completely filled. Figure 3 Transferring water sample from euphotic zone composite into lab sample bottle 3
 to the desired water depth.")
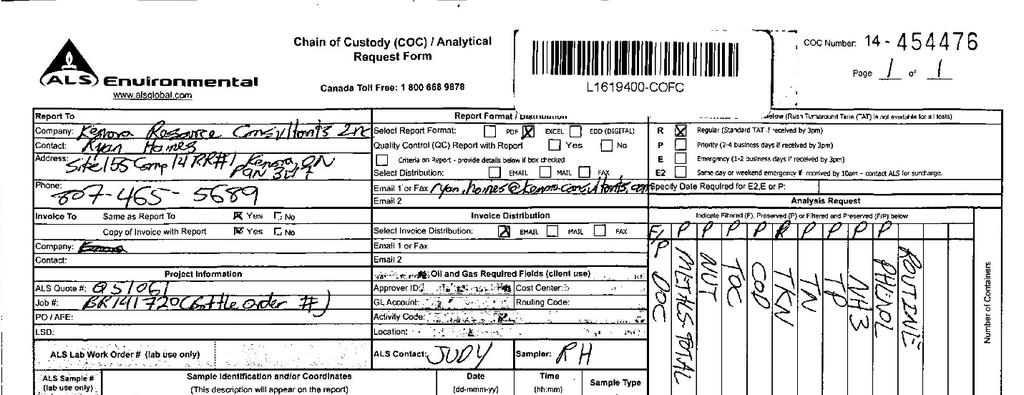
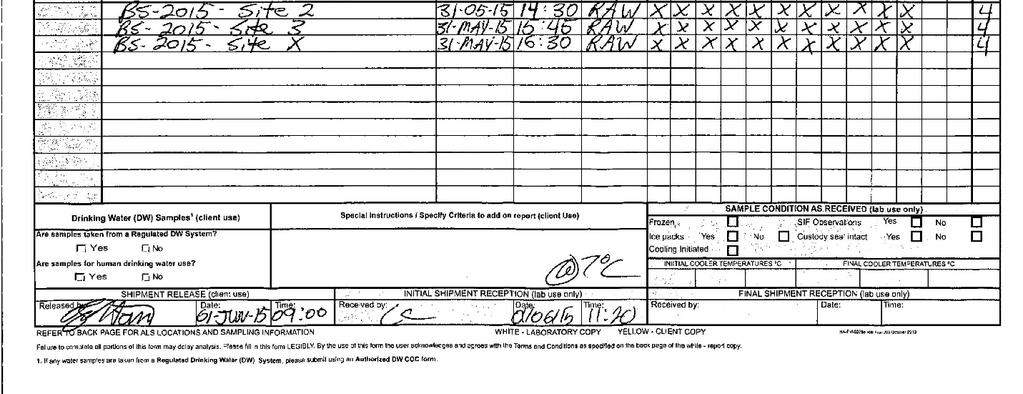
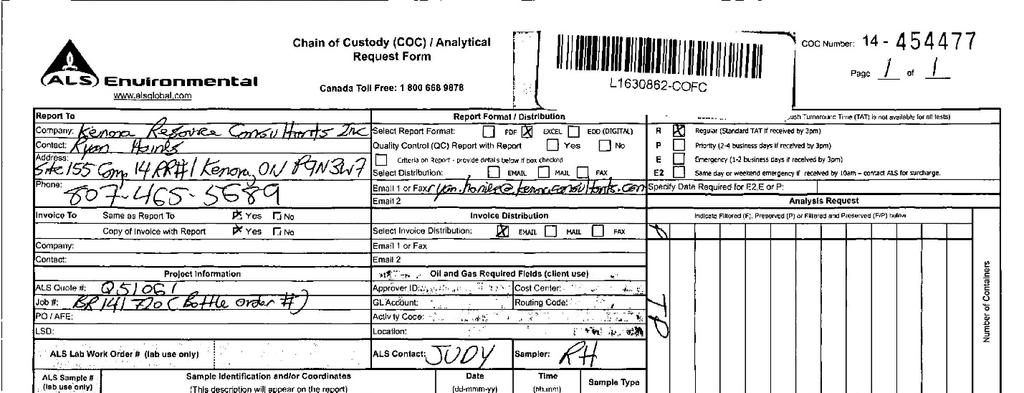
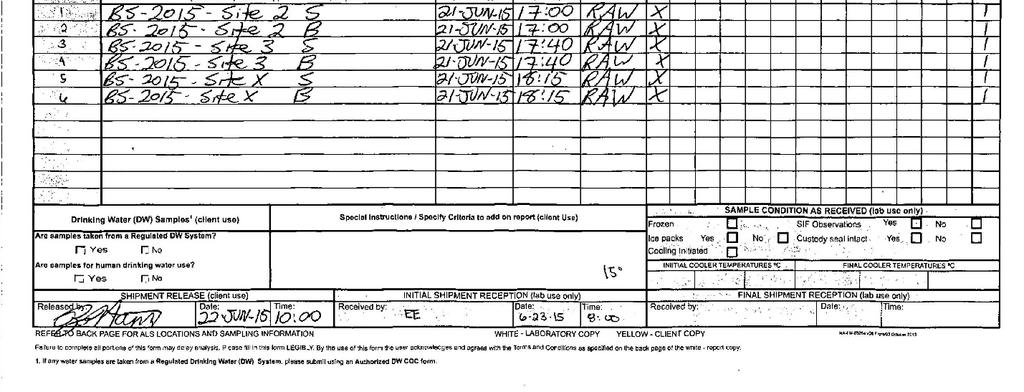
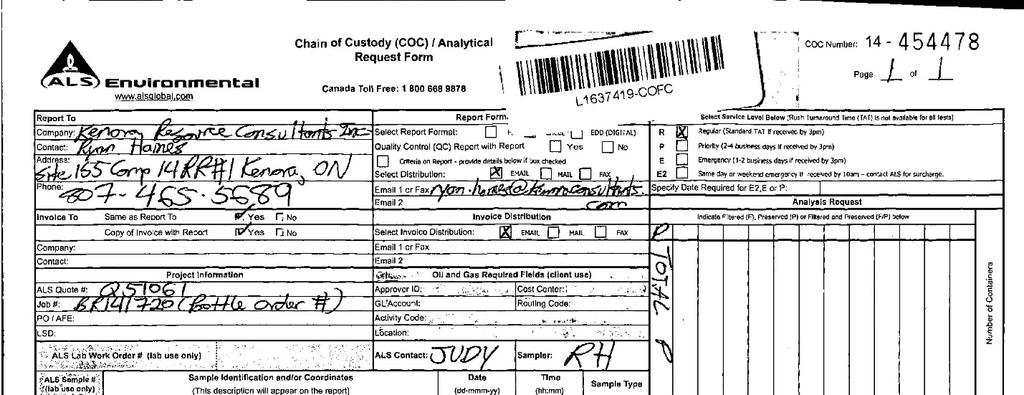
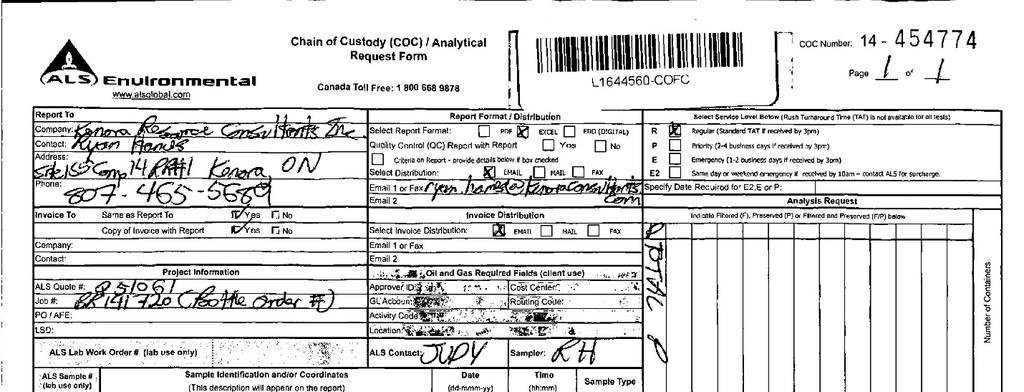
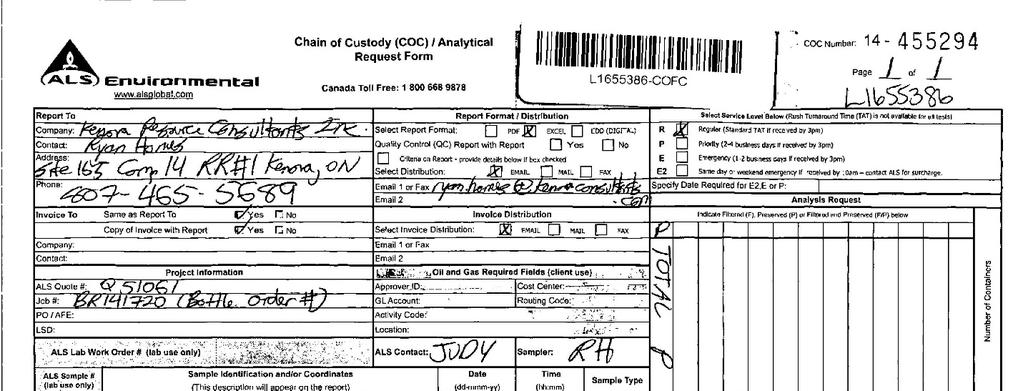
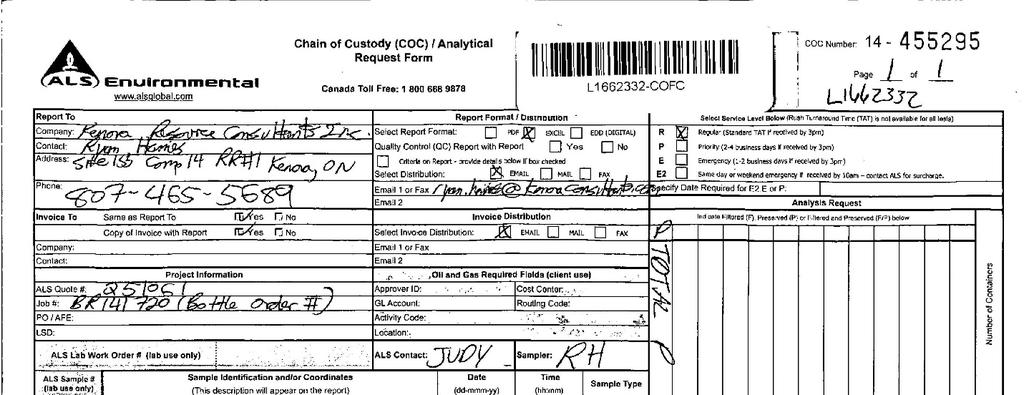
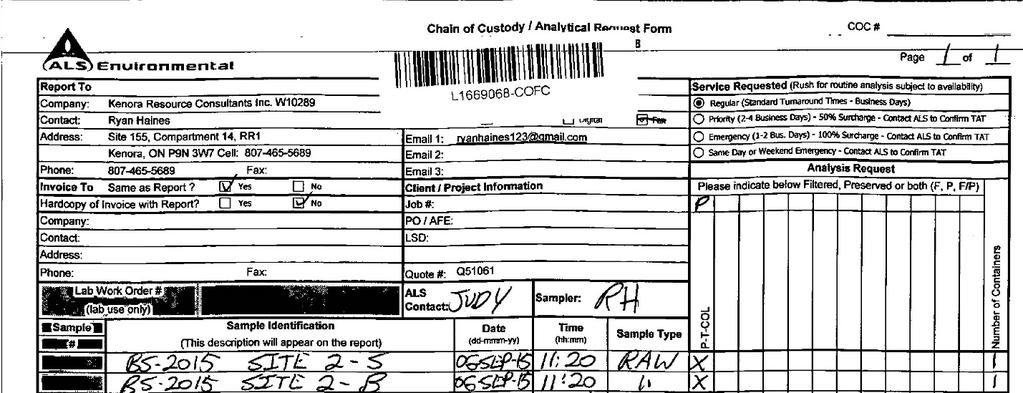
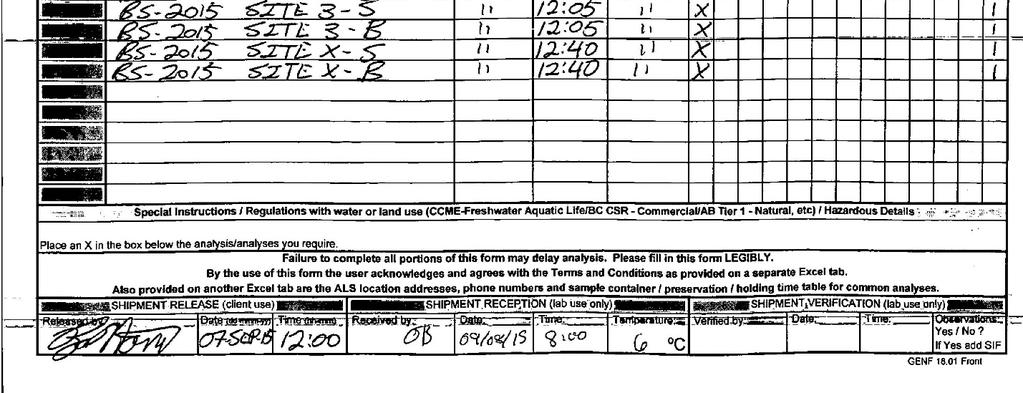
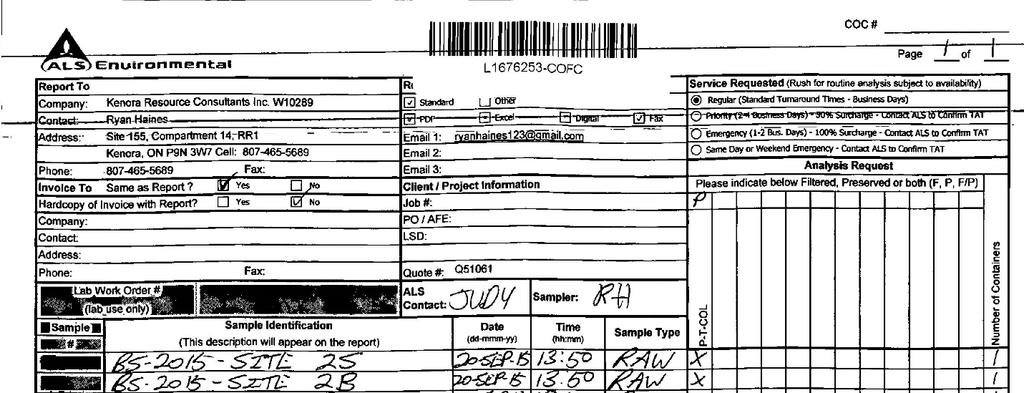
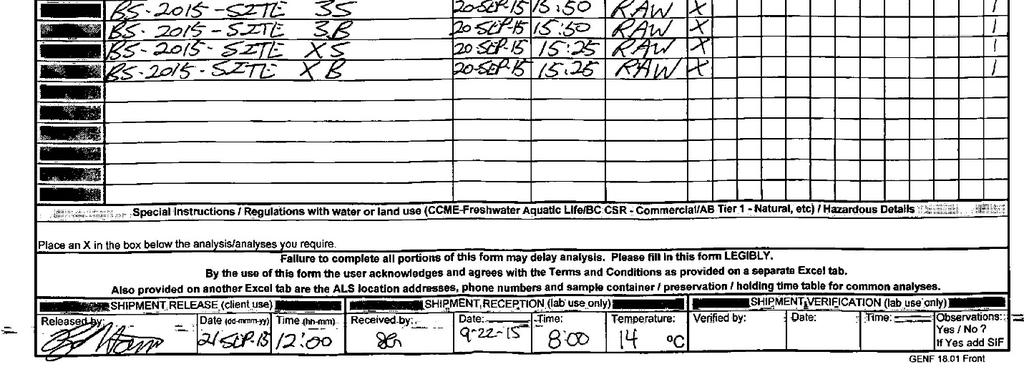
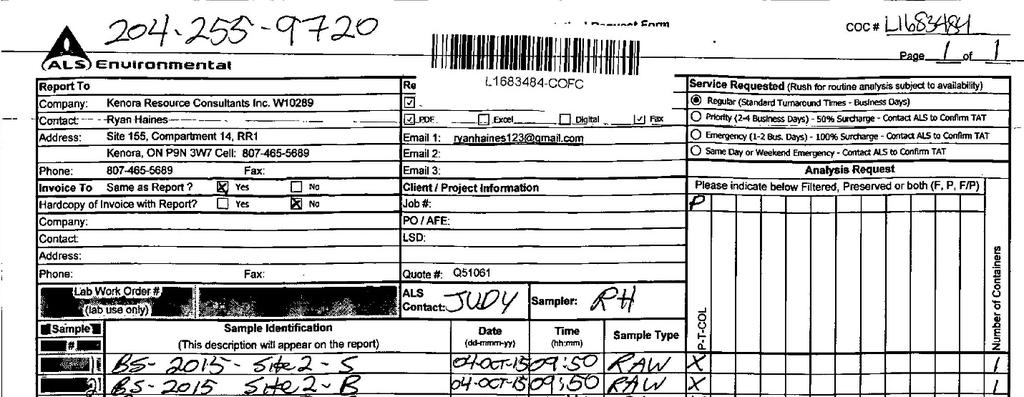
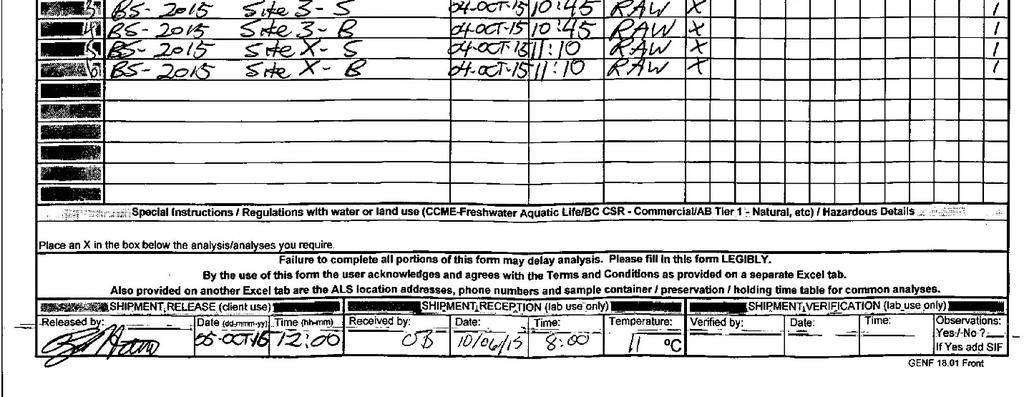
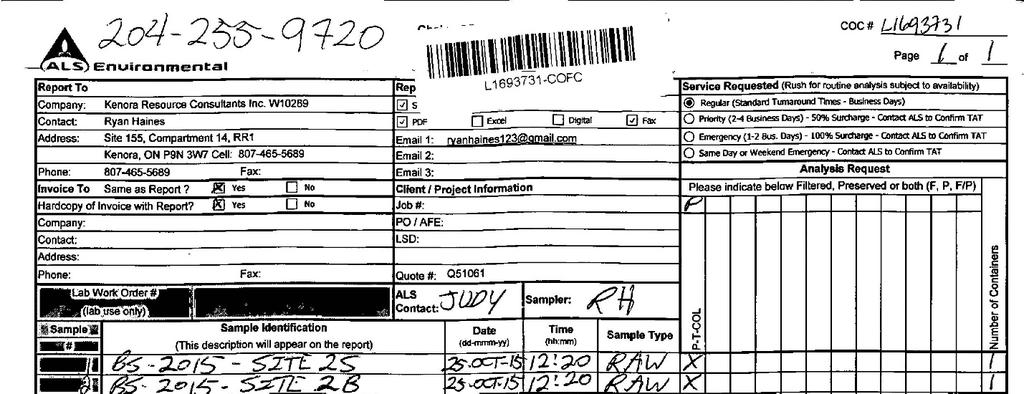
9 At each site, an additional water sample was taken approximately one meter from the bottom of the lake using a Beta horizontal water sampler (Figure 4). Both ends of the water sampler were opened prior to lowering it (using a rope) to the desired water depth. At the desired depth, a small weight was sent down through the water column along the length of the rope triggering a release mechanism on the sampler and causing the sampler caps to close. Figure 4 Horizontal Beta Sampler prior to deployment All euphotic zone samples and samples taken one meter from the bottom of the lake were transferred immediately upon collection to sample bottles for analysis at a laboratory. One euphotic zone sample and one bottom sample were taken at each site and analyzed for total phosphorous. All water samples were shipped via Greyhound bus to ALS Laboratory Group in Winnipeg, MB, for analysis. 3.0 RESULTS During the 2015 field season, there was information collected from all three sites (Site 2, Site 3, Site 4) for a number of different factors (phosphorous, Secchi depth, dissolved oxygen/temperature profiles, dissolved organic carbon, colour, ph, alkalinity, turbidity and scans for cations/anions and trace metals) as well as a mid summer dissolved oxygen/temperature profile taken at Site 1. All of this information is important to ensure that data is collected to help determine the spatial and/or temporal attributes of any changes to water quality in Black Sturgeon Lakes. However, it is felt that the data collected at Site 1, Site 3, and Site 4 are most important to assist in determining potential sources of any impacts to water quality that may be found at Site 2. In addition, it is felt that the dissolved oxygen/temperature profiles and bottom samples for phosphorous at all three sites are important for assisting in determining potential sources and/or causes of any water quality impairment that may be found at Site 2. For the reasons listed above, the following results and discussion sections will focus on the phosphorous results and Secchi depth measurements that were collected at Site 2 in 2009, 2010, and 2015 as well as the spring water quality characteristics analyses from Site 2 collected in 2010 and All of the additional data collected during the 2015 field season will be provided to the City of Kenora in digital 4
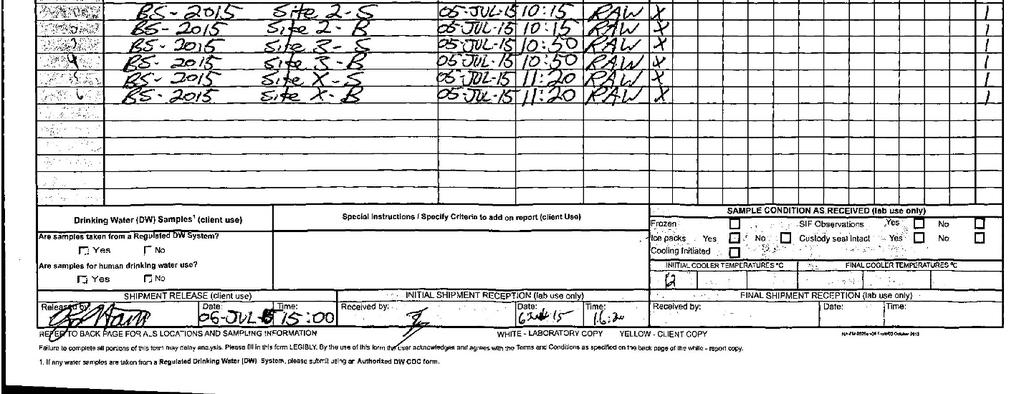
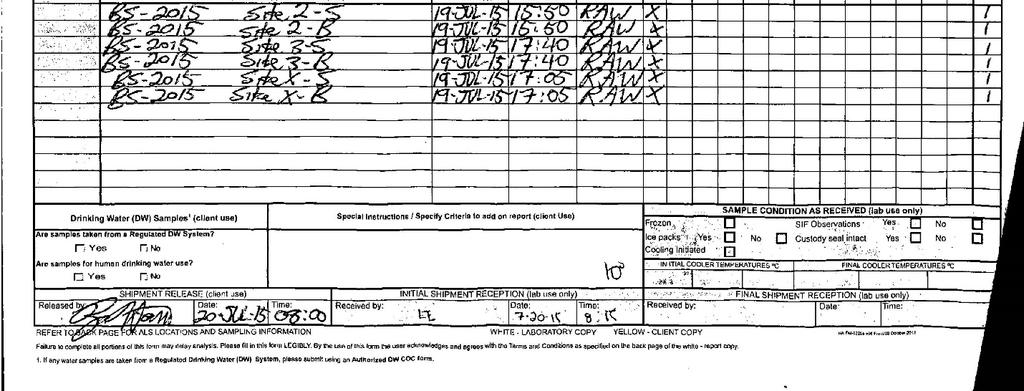
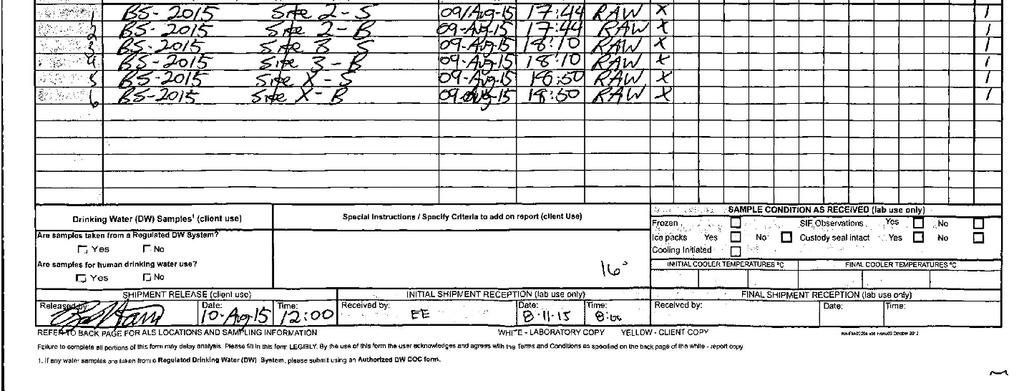
10 format to ensure that the information is stored for future analysis should there be evidence of decline in water quality at Site 2 during sampling seasons in the future. 3.1 Sampling Session Dates and Locations The 2015 sampling sessions were conducted on May 31 st, June 21 st, July 5 th, July 19 th, August 9 th, August 23 rd, September 6 th, September 20 th, October 4 th, and October 25 th, The depth of the sampling sites varied due to fluctuating water levels and the anchoring location for each site. The deepest portion of Site 2 was fairly isolated and difficult to locate, sampling depths at this site varied from 14.9 to 17.0 m. The sampling depths at Site 3 varied from 9.5 to 10.0 m. Site 4 was the shallowest site with sampling depths ranging from 6.5 to 7.1 m. 3.2 Total Phosphorous The2009, 2010, and 2015 euphotic zone spring and fall turnover results for the total phosphorous concentrations for Site 2 were all below the provincial water quality objective of mg/l. During 2015, the turnover euphotic zone phosphorous concentrations taken at Site 2 (spring mg/l and fall mg/l) were found to be in between the concentrations found during the baseline years of 2009 (spring mg/l and fall mg/l ) and 2010 (spring mg/l and fall ) (Figure 5) Figure 5 Turnover Concentrations From Site 2 in 2009, 2010, and 2015 Phosphorous (mg/l) Spring Turnover Fall Turnover 3.3 Secchi Depths During the 2015 sampling season, the Secchi depths collected at Site 2 varied from 2.5 to 4.0 m with an average of 3.1 m. The 2010 Secchi depths for Site 2 ranged from 2.5 to 3.5 m with an average of 2.9 m and in 2009 the Secchi depths for Site 2 ranged from 2.5 m to 3.3 m with an average of 3.0 m (Figure 6). Secchi depths during all three field seasons were occasionally taken in the early morning or in the 5
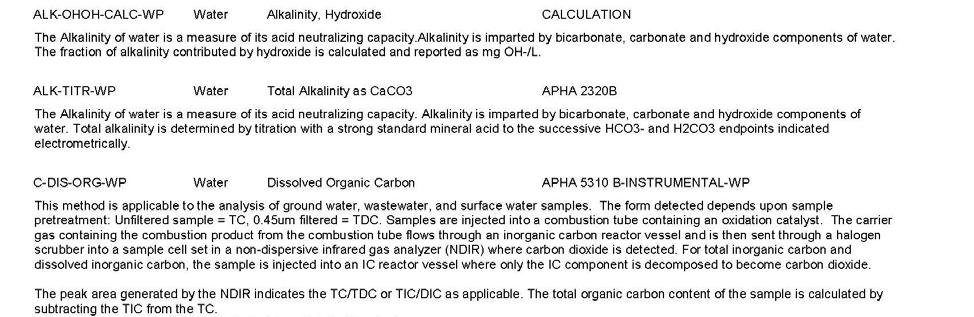
11 evening on overcast days, which would result in a reduction in visibility (and thus, Secchi depth) when compared to mid day measurements on sunny days. Figure 6 Secchi Depths for Site 2 Sampling Sessions in 2009, 2010, and 2015 Secchi Depth (m) Spring Sampling Session Fall Note: During the 2010 sampling season, eight sampling sessions were conducted this is why the sixth and eighth sessions are missing 3.3 Chemical Analysis Water Quality Characteristics The spring turnover water samples were analyzed for 54 parameters encompassing dissolved organic carbon, colour, ph, alkalinity, turbidity and scans for cations/anions and trace metals. The 2015 results were comparable to the results for the 2010 analyses and were all within the provincial water quality objectives for the parameters where an objective is provided. The full results, with the 2010 results included for comparison, can be found in Appendix DISCUSSION 4.1 Total Phosphorous The total phosphorous readings that are of the most interest for water quality analysis are the ones taken during spring and fall turnover. The reason for this is that turnover is when the phosphorous is mixed throughout the water column and it is also when past phosphorous concentrations (i.e. Lake Partner Program) have been measured to enable analysis of trends over time. The Ontario provincial water quality objective for total phosphorous concentrations is less than 20 µg/l (0.02 mg/l) to avoid nuisance concentrations of algae in lakes (MOE 1994). The spring and fall turnover phosphorous concentrations collected during the 2015 sample season were all below Ontario s provincial water quality objective for Sites 2, 3, and 4. 6
12 The spring total phosphorous concentration of mg/l from Site 2 was a significantly less than the result from 2010 ( mg/l) and more than the concentration of phosphorous found in the 2009 spring sample ( mg/l) This value was also within the Lake Partner Program range of total phosphorous samples analyzed between 2004 and 2014 on lower Black Sturgeon Lake (0.012 to mg/l) and is below the mean of mg/l over this same time period (Ministry of Environment 2015a). This indicates that the phosphorous concentrations on Lower Black Sturgeon Lake appear to have been relatively stable (and below the water quality objective) for the past decade. These values indicate that the productivity of lower Black Sturgeon Lake has remained relatively stable since In addition, the phosphorous values found during the three years of this study have all been below the water quality objectives for nuisance algae. 4.2 Secchi Depths The mean Secchi depth for Site 2 during the 2015 sampling season (3.1 m) was greater than that found during both the 2009 (3.0 m) and the 2010 (2.9 m) sampling seasons. The mean Secchi depths for 2015 is also within the range of 2.2 m to 4.0 m and greater than the average of 3.0 m for lower Black Sturgeon Lake determined as part of the lake partner program from 1999 to 2014 (Ministry of the Environment 2015b). This data would support the findings of the phosphorous data analysis and give indication that the water quality on lower Black Sturgeon Lake has been relatively stable over the past decade. 4.3 Chemical Analysis Water Quality Characteristics The 2015 results were comparable to the results for the 2010 analyses and were all within the provincial water quality objectives for the parameters where an objective is provided. Once again, this data supports the findings of the phosphorous results and Secchi depth readings indicating that the water quality health of Black Sturgeon Lakes has remained relatively consistent over the past several years. 5.0 SUMMARY AND RECOMMENDATIONS Lower Black Sturgeon Lake is within the provincial water quality objectives for a healthy lake for all of the parameters measured and analyzed in this study. All results indicate that Black Sturgeon Lakes have all of the characteristics to be expected in a dystrophic lake (i.e. heavily coloured due to presence of humic compounds of plant origin) located in northwestern Ontario. In addition, the 2015 water quality results are consistent with results of previous studies conducted on Lower Black Sturgeon Lake. This indicates that the health of the water body has remained consistent and is not deteriorating over time. The variation shown during the 2009, 2010, and 2015 sampling seasons demonstrates the importance of collecting multiple years of data to establish robust data sets. The summer of 2009 was characterized by relatively cool conditions and therefore the information collected during this season provides a detailed synopsis of Lower Black Sturgeon Lake water quality during a cool summer. The 2010 open water season was exceptionally long and wet which produced a data set that reflects these climatic conditions. However, the results of these varying summer patterns was that despite the fact there were no major changes to land use, the 2009 and 2010 sampling seasons produced different water quality sampling 7
13 results. The 2015 sampling season produced results from a more average or typical open water season with results that were often in between the two baseline sampling seasons. The increase in nutrient levels during the 2010 sampling season highlights the challenges faced when conducting a sampling protocol that only revisits the water body every 5 years. Fortunately, the 2015 sampling season happened to be a relatively average or normal summer. If future quinquennial sampling seasons were to fall on exceptionally dry or wet seasons, the information gained from them may provide a skewed picture of the impacts of development on the watershed. For this reason, it is recommended that the City of Kenora explore the potential of conducting a focussed annual water quality sampling program to monitor the impacts of development on water quality on lower Black Sturgeon Lake. There is the possibility that, for similar costs, an annual sampling protocol may provide a more accurate picture of any potential changes to water quality on Black Sturgeon Lakes over time. 6.0 REFERENCES Gartner Lee Ltd. and Kelli Saunders Environmental Management. October Lake Capacity and Management Study for Black Sturgeon Lake, City of Kenora. Ministry of the Environment. 2015a. Lake Partner Total Phosphorous Data. Found on website at: Ministry of the Environment. 2015b. Lake Partner Secchi Depth Data. Found on website at: Ministry of Environment and Energy. July Water Management: Policies; Guidelines; Provincial Water Quality Objectives of the Ministry of Environment and Energy. Found on website at: management policies guidelines provincial water qualityobjectives 8
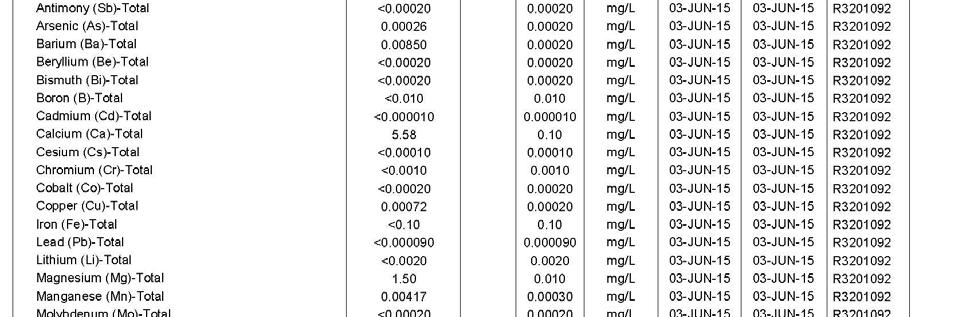
14 APPENDIX 1 Laboratory Results for Water Quality Characteristics (2010 and 2015) Parameter Unit PWQO Alkalinity, Bicarbonate (HCO3) mg/l natural Alkalinity, Carbonate (CO3) < < mg/l natural Alkalinity, Hydroxide (OH) < < mg/l natural Total Alkalinity (CaCO3) mg/l natural Chloride (Cl) < 3.76 mg/l 210 Fluoride (F) mg/l n/a Sulphate (SO4) < 1.93 mg/l n/a Colour, True CU n/a Dissolved Organic Carbon mg/l n/a Turbidity NTU n/a ph ph units Aluminum (Al) Total mg/l Antimony (Sb) Total < < mg/l 0.02 Arsenic (As) Total < mg/l Barium (Ba) Total mg/l n/a Beryllium (Be) Total < < mg/l Bismuth (Bi) Total < < mg/l n/a Boron (B) Total < < mg/l 0.2 Cadmium (Cd) Total < < mg/l Calcium (Ca) Total mg/l n/a Cesium (Cs) Total < < mg/l n/a Chromium (Cr) Total < < mg/l Cobalt (Co) Total < < mg/l Copper (Cu) Total mg/l Iron (Fe) Total < mg/l 0.3 Lead (Pb) Total < mg/l Lithium (Li) Total n/a < mg/l n/a Magnesium (Mg) Total mg/l n/a Manganese (Mn) Total mg/l n/a Molybdenum (Mo) Total < < mg/l 0.04 Nickel (Ni) Total < mg/l Phosphorus (P) Total < < mg/l 0.02 Potassium (K) Total mg/l n/a Rubidium (Rb) Total mg/l n/a Selenium (Se) Total < < mg/l 0.1 Silicon (Si) Total mg/l n/a Silver (Ag) Total < < mg/l
15 Parameter Unit PWQO Sodium (Na) Total mg/l n/a Strontium (Sr) Total mg/l n/a Tellurium (Te) Total < < mg/l n/a Thallium (Tl) Total < < mg/l Thorium (Th) Total n/a < mg/l n/a Tin (Sn) Total < < mg/l n/a Titanium (Ti) Total mg/l n/a Tungsten (W) Total < < mg/l 0.03 Uranium (U) Total < < mg/l Vanadium (V) Total < mg/l Zinc (Zn) Total < < mg/l 0.03 Zirconium (Zr) Total < < mg/l Nitrate n/a < mg/l n/a Nitrate + Nitrite < mg/l n/a Nitrite n/a < mg/l n/a Total Kjeldahl Nitrogen n/a 0.37 mg/l n/a Total Nitrogen Calculated n/a 0.37 mg/l n/a PWQO Ontario Provincial Water Quality Objective n/a results were not provided for this parameter < measurement was less than the error found in the laboratory analysis procedure and equipment number is shown for the 2015 results due to a decrease in the reporting limits for the laboratory analysis accuracy, not necessarily due to any increase in the parameter/concentration 10
16 APPENDIX 2 Site Dissolved Oxygen/Temperature Profiles Site 1 Site 1 DO (Dissolved Oxygen) Temperature Profiles Depth Temp DO (%) DO (mg/l) Secchi Depth (m) B.P. (mmhg) Time Depth (m) n/a :
17 Site 2 May 31 Site 2 Dissolved Oxygen/Temperature Profiles May 31 Depth Temp DO (%) DO (mg/l) Secchi Depth (m) B.P. (mmhg) Time Depth (m) : June 21 Site 2 Dissolved Oxygen/Temperature Profiles June 21 Depth Temp DO (%) DO (mg/l)
18 Secchi Depth (m) B.P. (mmhg) Time Depth (m) : July 5 Site 2 Dissolved Oxygen/Temperature Profiles July 5 Depth Temp DO (%) DO (mg/l) Secchi Depth (m) B.P. (mmhg) Time Depth (m) : July 19 Site 2 Dissolved Oxygen/Temperature Profiles July 19 Depth Temp DO (%) DO (mg/l)
19 Secchi Depth (m) B.P. (mmhg) Time Depth (m) : August 9 Site 2 Dissolved Oxygen/Temperature Profiles August 9 Depth Temp DO (%) DO (mg/l) Secchi Depth (m) B.P. (mmhg) Time Depth (m) :44 17 August 23 Site 2 Dissolved Oxygen/Temperature Profiles August 23 Depth Temp DO (%) DO (mg/l)
20 Secchi Depth (m) B.P. (mmhg) Time Depth (m) :45 17 September 6 Site 2 Dissolved Oxygen/Temperature Profiles September 6 Depth Temp DO (%) DO (mg/l) Secchi Depth (m) B.P. (mmhg) Time Depth (m) :
21 September 20 Site 2 Dissolved Oxygen/Temperature Profiles September 20 Depth Temp DO (%) DO (mg/l) Secchi Depth (m) B.P. (mmhg) Time Depth (m) :50 16 October 4 Site 2 Dissolved Oxygen/Temperature Profiles October 4 Depth Temp DO (%) DO (mg/l)
22 Secchi Depth (m) B.P. (mmhg) Time Depth (m) : October 25 Site 2 DO (Dissolved Oxygen) Temperature Profiles October 25 Depth Temp DO (%) DO (mg/l) Secchi Depth (m) B.P. (mmhg) Time Depth (m) : Site 3 May 31 Site 3 DO (Dissolved Oxygen) Temperature Profiles May 31 DO Depth Temp (%) DO (mg/l)
23 Secchi Depth (m) B.P. (mmhg) Time Depth (m) : June 21 Site 3 DO (Dissolved Oxygen) Temperature Profiles June 21 Depth Temp DO (%) DO (mg/l) Secchi Depth (m) B.P. (mmhg) Time Depth (m) : July 5 Site 3 DO (Dissolved Oxygen) Temperature Profiles July 5 Depth Temp DO (%) DO (mg/l)
24 Secchi Depth (m) B.P. (mmhg) Time Depth (m) : July 19 Site 3 DO (Dissolved Oxygen) Temperature Profiles July 19 Depth Temp DO (%) DO (mg/l) Secchi Depth (m) B.P. (mmhg) Time Depth (m) : August 9 Site 3 DO (Dissolved Oxygen) Temperature Profiles August 9 Depth Temp DO (%) DO (mg/l) Secchi Depth (m) B.P. (mmhg) Time Depth (m) : August 23 Site 3 DO (Dissolved Oxygen) Temperature Profiles August 23 Depth Temp DO (%) DO (mg/l)
25 Secchi Depth (m) B.P. (mmhg) Time Depth (m) : September 6 Site 3 DO (Dissolved Oxygen) Temperature Profiles September 6 Depth Temp DO (%) DO (mg/l) Secchi Depth (m) B.P. (mmhg) Time Depth (m) :05 10 September 20 Site 3 DO (Dissolved Oxygen) Temperature Profiles September 20 Depth Temp DO (%) DO (mg/l)
26 Secchi Depth (m) B.P. (mmhg) Time Depth (m) : October 4 Site 3 DO (Dissolved Oxygen) Temperature Profiles October 4 Depth Temp DO (%) DO (mg/l) Secchi Depth (m) B.P. (mmhg) Time Depth (m) : October 25 Site 3 DO (Dissolved Oxygen) Temperature Profiles October 25 Depth Temp DO (%) DO (mg/l) Secchi Depth (m) B.P. (mmhg) Time Depth (m) :
27 Site X (4) May 31 Site X (4) DO (Dissolved Oxygen) Temperature Profiles May 31 Depth Temp DO (%) DO (mg/l) Secchi Depth (m) B.P. (mmhg) Time Depth (m) : June 21 Site X (4) DO (Dissolved Oxygen) Temperature Profiles Depth Temp DO (%) DO (mg/l) Secchi Depth (m) B.P. (mmhg) Time Depth (m) : July 5 Site X (4) DO (Dissolved Oxygen) Temperature Profiles July 5 Depth Temp DO (%) DO (mg/l)
28 Secchi Depth (m) B.P. (mmhg) Time Depth (m) : July 19 Site X (4) DO (Dissolved Oxygen) Temperature Profiles July 19 Depth Temp DO (%) DO (mg/l) Secchi Depth (m) B.P. (mmhg) Time Depth (m) : August 9 Site X (4) DO (Dissolved Oxygen) Temperature Profiles August 9 Depth Temp DO (%) DO (mg/l) Secchi Depth (m) B.P. (mmhg) Time Depth (m) : August 23 Site X (4) DO (Dissolved Oxygen) Temperature Profiles August 23 Depth Temp DO (%) DO (mg/l)
29 Secchi Depth (m) B.P. (mmhg) Time Depth (m) : September 6 Site X (4) DO (Dissolved Oxygen) Temperature Profiles September 6 Depth Temp DO (%) DO (mg/l) Secchi Depth (m) B.P. (mmhg) Time Depth (m) : September 20 Site X (4) DO (Dissolved Oxygen) Temperature Profiles September 20 Depth Temp DO (%) DO (mg/l) Secchi Depth (m) B.P. (mmhg) Time Depth (m) : October 4 Site X (4) DO (Dissolved Oxygen) Temperature Profiles October 4 Depth Temp DO (%) DO (mg/l)
30 Secchi Depth (m) B.P. (mmhg) Time Depth (m) : October 25 Site X (4) DO (Dissolved Oxygen) Temperature Profiles October 25 Depth Temp DO (%) DO (mg/l) Secchi Depth (m) B.P. (mmhg) Time Depth (m) :
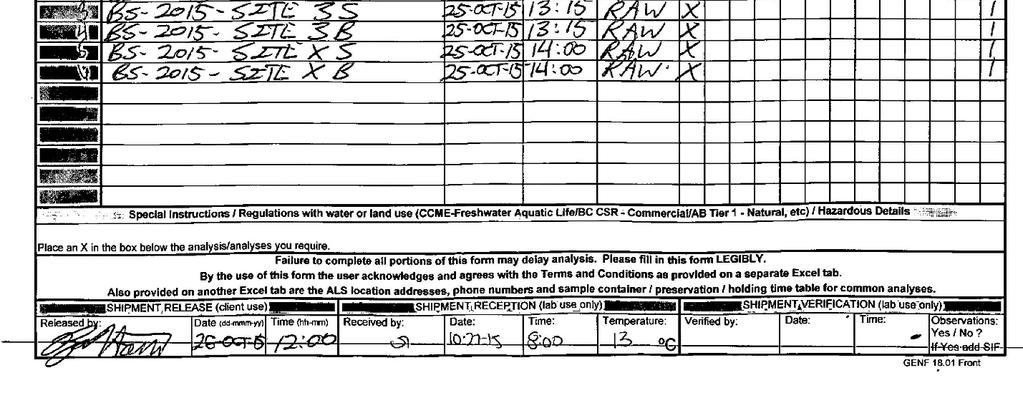
31 APPENDIX 3 Lab Results May 31 26
32 27
33 28
34 29
35 30
36 31
37 32
38 33
39 34
40 June 21 35
41 36
42 37
43 38
44 July 5 39
45 40
46 41
47 42
48 July 19 43
49 44
50 45
51 46

52 August 9 47
53 48
54 49
55 50
56 August 23 51
57 52
58 53
59 54
60 September 6 55
61 56
62 57
63 58
64 September 20 59
65 60
66 61
67 62
68 October 4 63
69 64
70 65
71 66
72 October 25 67
73 68
74 69
75 70