Global and China Dissolving Pulp. September 2018
|
|
|
- Ross Long
- 5 years ago
- Views:
Transcription
1 Global and China Dissolving Pulp Industry Report, September 2018
2 STUDY GOAL AND OBJECTIVES This report provides the industry executives with strategically significant competitor information, analysis, insight and projection on the competitive pattern and key companies in the industry, crucial to the development and implementation of effective business, marketing and R&D programs. METHODOLOGY Both primary and secondary research methodologies were used in preparing this study. Initially, a comprehensive and exhaustive search of the literature on this industry was conducted. These sources included related books and journals, trade literature, marketing literature, other product/promotional literature, annual reports, security analyst reports, and other publications. REPORT OBJECTIVES Subsequently, telephone interviews or correspondence To establish a comprehensive, factual, annually updated d and cost- was conducted with marketing executives etc. Other sources effective information base on market size, competition patterns, market segments, goals and strategies of the leading players in the market, reviews and forecasts. To assist potential market entrants in evaluating prospective acquisition and joint venture candidates. To complement the organizations internal competitor information gathering efforts with strategic analysis, data interpretation and insight. To suggest for concerned investors in line with the current development of this industry as well as the development tendency. included related magazines, academics, and consulting companies. INFORMATION SOURCES The primary information sources include Company Reports, and National Bureau of Statistics of China etc. To help company to succeed in a competitive market, and understand the size and growth rate of any opportunity. Copyright 2012 ResearchInChina
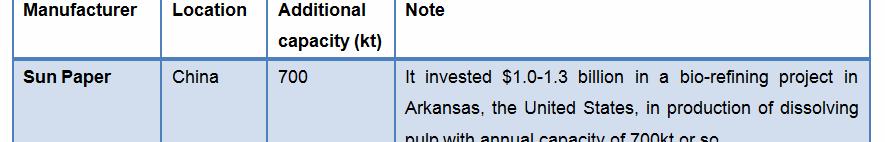
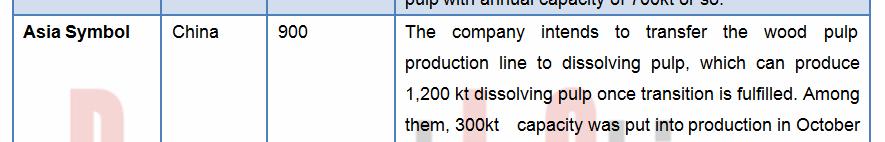
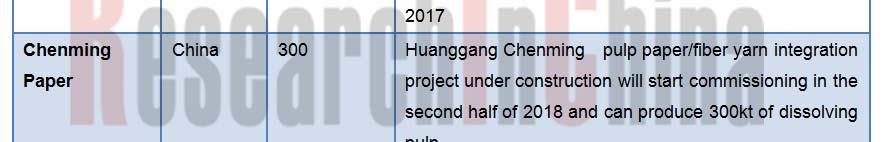
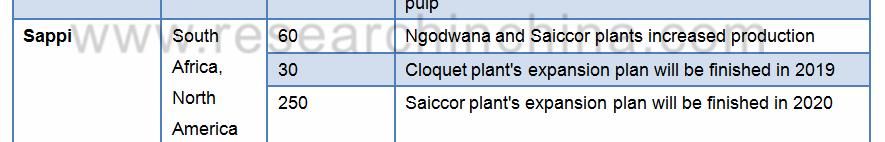
3 Abstract With the commissioning of new dissolving pulp projects, the global dissolving pulp capacity had been up to about 8,000 kt by the end of It is worth noticing that the top six producers including Sappi, Aditya Birla, Lenzing, Sun Paper, Bracell and Rayonier boast the combined capacity of approximately 4, kt as a percentage of 55.5% in global total. So far, foreign giants like Sappi, Birla and Lenzing, as well as Chinese peers such as Sun Paper, Asia Symbol and Chenming Paper, have been ramping up production of dissolving pulp aggressively, from which it can be seen that the world s production of dissolving pulp is on the rise and will lead to overcapacity in future, and that small and medium-sized manufacturers will be forced to retreat from the market, contributing to higher concentration of the dissolving pulp industry. As a major global consumer of dissolving pulp, the apparent consumption of dissolving pulp in China has risen steadily in recent years, and reached 4,420 kt in 2017, up 4.2% year-on-year. year. However, China's dissolving pulp capacity utilization rate is not high, with the actual output of 1,800 kt and the import dependence rate of 59.3%. There are now about a dozen Chinese dissolving pulp manufacturers, among which Sun Paper, Hunan Juntai and Asia Symbol possess higher productivity reaching 500kt, 300kt and 200kt respectively, together occupying 56.7% of the total capacity. In 2013, China initiated anti-dumping investigation against imported dissolving pulp products, because the imports flooded at low prices and took a lion s share in the Chinese dissolving pulp market and caused serious excess of dissolving pulp capacity in China. Moreover, Chinese government also decided in August 2018 to impose 5% tariff on dissolving pulp originating in the United States. These measures favor the development of local enterprises, and it is expected that China's dissolving pulp production will rise steadily in the next few years, and its import dependence will go down. Global and China Dissolving Pulp Industry Report, by ResearchInChina focuses on the followings: Global dissolving pulp industry (development status, competitive landscape, prices, etc.); China s dissolving pulp industry (development status, anti-dumping investigation, supply/demand competitive landscape, imports, etc. Downstream viscose fiber industry (status quo, capacity, output, imports/exports, prices, etc.); 5 global and 8 Chinese dissolving pulp producers (operation, R&D investment, dissolving pulp business, etc.); Conclusion and forecast. Copyright 2012ResearchInChina
4 Copyright 2012ResearchInChina
5 Copyright 2012ResearchInChina
6 Table of contents 1. Overview of Dissolving Pulp Industry 1.1 Definition & Classification 1.2 Industrial Chain 2. Global Dissolving Pulp Industry 2.1 Status Quo 2.22 Competition 2.3 Prices 3. China Dissolving Pulp Industry 3.1 Status Quo 32A 3.2 Anti-dumping tid i Investigation 3.3 Supply 3.4 Demand 3.5 Prices 3.6 Import 3.7 Competition 4. Downstream Viscose Fiber Market 4.1 Overview 4.2 Capacity 4.3 Output 4.4 Import & Export 4.5 Prices Profile Operation 513Di Dissolving i Pulp Business Business in China 5.2 Sappi Profile Operation Revenue Structure Dissolving Pulp Business Business in China 5.3 Aditya Birla Group 531Profile Operation of Grasim Revenue Structure of Grasim Dissolving Pulp Business of Grasim Business in China 54L 5.4 Lenzing Profile Operation Revenue Structure Operation of Fiber Segment Dissolving Pulp Business Business in China 5.5 Rayonier AM 6. Major Chinese Dissolving Pulp Manufacturers 5. Major Dissolving i Pulp Companies Worldwide 6.1 Shandong Sun Paper Industry Joint Stock Co., Ltd. 5.1 Bracell Profile Operation Revenue Structure 614G Gross Margin R&D Investment Dissolving Pulp Business Forecast and Outlook 6.2 Fujian Qingshan Paper Industry Co., Ltd Profile Operation Revenue Structure Gross Margin R&D Investment Dissolving Pulp Business Forecast and Outlook 6.3 Yueyang Forest & Paper Co., Ltd. 6.4 Shandong Chenming Paper Holdings Ltd. 65Sh 6.5 Shandong Huatai Paper Co., Ltd. 6.6 Yanbian Shixian Double-deer Industrial Co., Ltd Profile Dissolving Pulp Business 6.7 Yibin Grace Group Co., Ltd. 6.8 Sichuan Tianzhu Bamboo Resource Development 6.9 Asia Symbol (Shandong) Pulp & Paper Co., Ltd. 7. Conclusion & Prediction 7.1 Conclusion 7.2 Prediction
7 Classification of Dissolving Pulp (by Raw Materials) Industrial Chain of Dissolving Pulp Other Downstream Products and Applications of Dissolving Pulp Major Global Dissolving Pulp Manufacturers and Their Capacity, 2017 Capacity Structure of Major Global Dissolving Pulp Manufacturers, 2017 Key Dissolving Pulp Projects Planned/Under Construction Worldwide, 2018 Dissolving Pulp Prices Worldwide (Unit: USD/ton), China's Anti-dumping Investigation on Pulp from USA, Canada and Brazil Dissolving Pulp Capacity in China, Dissolving Pulp Output in China (by Product), Output Structure of Dissolving Pulp in China (by Product), Apparent Consumption of Dissolving Pulp in China, Market Prices of Dissolving Pulp in China (Unit: RMB/ton), Price Trend of Viscose Staple Fiber and Dissolving Pulp in China, Price Trend of Dissolving Pulp in China, Jan.-Aug Dissolving Pulp Import and YoY Change in China, Average Import Price of Dissolving Pulp in China, Major Dissolving Pulp Manufacturers in China and Their Capacity, 2017 Capacity Structure of Dissolving Pulp Manufacturers in China, 2017 Major Varieties of Fiber Worldwide Fiber Consumption Structure Worldwide, 2015 Fiber Consumption Structure Worldwide, 2017 Major Viscose Staple Fiber Manufacturers in China and Their Capacity, 2017 Distribution of Viscose Staple Fiber Capacity in China, 2017 Distribution of Viscose Staple Fiber Capacity in China by Region, 2017 Selected Charts
8 Viscose Fiber Output and YoY Growth in China, Viscose Staple Fiber Imports/Exports in China, Average Import/Export Prices of Viscose Staple Fiber in China, Destinations of Exported Viscose Staple Fiber from China by Export Volume, 2015 Sources of Imported Viscose Staple Fiber in China by Import Volume, 2015 Major Viscose Staple Fiber Export Cities and Their Export Volume in China (%), 2015 Major Viscose Staple Fiber Import Cities and Their Import Volume in China (%), 2015 Market Prices of Viscose Staple Fiber and Viscose Filament Yarn in China (Unit: RMB/ton), Market Prices of Viscose Staple Fiber in China (RMB /ton), Price Trend of Viscose Staple Fiber in China (RMB /ton), 2018 Product Line and Applications of Bracell Revenue and Net Income of Bracell, Dissolving Wood Pulp Revenue Breakdown (by Region) of Bracell, Dissolving Wood Pulp Revenue Structure (by Region) of Bracell, Dissolving Wood Pulp Production, Sales Volume and Revenue of Bracell, Viscose Pulp Sales as a Percentage of Bracell s Dissolving Pulp Sales, Specialty Pulp Sales as a Percentage of Bracell s Dissolving Wood Pulp Sales, Capacity of Sappi's Major Products Sappi s Three Production Bases and Capacity of Major Products, by end-2017 Revenue and EBITDA of Sappi, Revenue Breakdown (by Branches) of Sappi, Revenue Structure (by Branches) of Sappi, Sales Volume of Sappi by Product, Dissolving Pulp Manufacturing Plants and Capacity of Sappi, 2017 Sales Volume of Dissolving Wood Pulp of Sappi, Selected Charts
9 Revenue and EBITDA of Grasim, FY 2014-FY2018 Revenue Breakdown (by Product) of Grasim, FY2014-FY2018 FY2018 Revenue Structure (by Product) of Grasim, FY2018 Production and Sales of Grasim, FY2014-FY2018 Grasim's Capacity of Viscose Staple Fiber and Dissolving Pulp, FY2018 Staff Structure of Lenzing by Country, 2017 Revenue and EBITDA of Lenzing, Revenue Structure (by Product) of Lenzing, Revenue Structure (by Region) of Lenzing, Revenue and EBITDA of Lenzing s Fiber Division, Revenue Breakdown (by Product) of Lenzing s Fiber Division, Revenue Structure (by Product) of Lenzing s Fiber Division, Major Production Bases of Dissolving Pulp and Their Capacities of Lenzing, by end-2017 Revenue and Net Income of Lenzing (Nanjing) Fiber, Major Products of Rayonier AM Revenue and Net Income of Rayonier AM, Revenue Breakdown of Rayonier AM (by Product), Revenue from High Purity Cellulose of Rayonier AM, Revenue and Net Income of Shandong Sun Paper, Revenue Breakdown (by Product) of Shandong Sun Paper, Revenue Structure (by Product) of Shandong Sun Paper, Revenue Breakdown (by Region) of Shandong Sun Paper, Revenue Structure (by Region) of Shandong Sun Paper, Gross Margin (by Product) of Shandong Sun Paper, R&D Investment and % of Total Revenue of Shandong Sun Paper, Selected Charts
10 Revenue from Dissolving Pulp and its Share of Total Revenue of Shandong Sun Paper, Revenue and Net Income of Shandong Sun Paper, E 2022E Revenue and Net Income of Fujian Qingshan Paper Industry, Revenue Breakdown (by Product) of Fujian Qingshan Paper Industry, Revenue Structure (by Product) of Fujian Qingshan Paper Industry, Gross Margin of Fujian Qingshan Paper Industry, Gross Margin (by Product) of Fujian Qingshan Paper Industry, R&D Investment and % of Total Revenue of Fujian Qingshan Paper Industry, Progress of Major Investment Projects of Fujian Qingshan Paper Industry, as of 2018H1 Paper Pulp Output and Sales of Fujian Qingshan Paper Industry, Revenue and Net Income of Fujian Qingshan Paper Industry, E Revenue and Net Income of Yueyang Forest & Paper, Revenue Breakdown (by Product) of Yueyang Forest & Paper, Revenue Structure (by Product) of Yueyang Forest & Paper, Gross Margin (by Product) of Yueyang Forest & Paper, R&D Investment and % of Total Revenue of Yueyang Forest & Paper, Revenue and Net Income of Yueyang Forest & Paper, E Revenue and Net Income of Shandong Chenming Paper, Revenue Breakdown (by Product) of Shandong Chenming Paper, Revenue Structure (by Product) of Shandong Chenming Paper, Revenue Breakdown (by Region) of Shandong Chenming Paper, Revenue Structure (by Region) of Shandong Chenming Paper, Gross Margin (by Product) of Shandong Chenming Paper, R&D Investment and % of Total Revenue of Shandong Chenming Paper, Progress of Dissolving Pulp Projects under Construction of Shandong Chenming Paper, as of 2018H1 Selected Charts
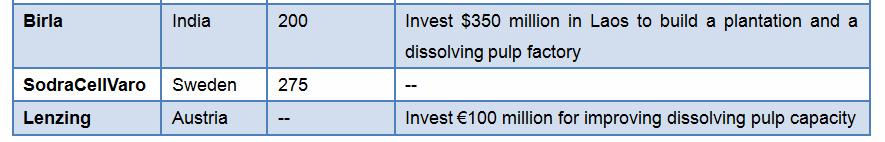
11 Selected Charts Revenue and Net Income of Shandong Chenming Paper, E Revenue and Net Income of Shandong Huatai Paper, Revenue Breakdown (by Product) of Shandong Huatai Paper, Revenue Structure (by Product) of Shandong Huatai Paper, Gross Margin (by Product) of Shandong Huatai Paper, R&D Investment and % of Total Revenue of Shandong Huatai Paper, Revenue and Net Income of Anhui Huatai, Revenue and Net Income of Shandong Huatai Paper, E Specifications of Major Wood Pulp Products of Yanbian Shixian Comparison between Global and Chinese Dissolving Pulp Manufacturers in Operation, Global Major Dissolving Pulp Projects Planned/Under Construction, 2018 Output and Apparent Consumption of Dissolving Pulp in China, E Dissolving Pulp Import Dependence in China, E Viscose Fiber Projects under Construction in China, by end-2017 Output and YoY Growth of Viscose Fiber in China, E 2022E
12 How to Buy You can place your order in the following alternative ways: 1.Order online at 2.Fax order sheet to us at fax number: your order to: 4. Phone us at Choose type of format PDF (Single user license)..2,800 USD Hard copy.. 3,000 USD PDF (Enterprisewide license)... 4,200 USD Party A: Name: Address: Contact Person: Tel Fax Party B: Name: Beijing Waterwood Technologies Co., Ltd (ResearchInChina) Address: Room 801, B1, Changyuan Tiandi Building, No. 18, Suzhou Street, Haidian District, Beijing, China Contact Liao Yan Phone: Person: Fax: Bank details: Beneficial Name: Beijing Waterwood Technologies Co., Ltd Bank Name: Bank of Communications, Beijing Branch Bank Address: NO.1 jinxiyuan shijicheng,landianchang,haidian District,Beijing Bank Account No #: Routing No # : Bank SWIFT Code: COMMCNSHBJG Reports will be dispatched immediately once full payment has been received. Payment may be made by wire transfer or credit card via PayPal. Title Format Cost Total Room 801, B1, Changyuan Tiandi Building, No. 18, Suzhou Street,, Haidian District, Beijing, China
13 About ResearchInChina RICDB service ResearchInChina ( is a leading independent provider of China business intelligence. Our research is designed to meet the diverse planning and information needs of businesses, institutions, and professional investors worldwide. Our services are used in a variety of ways, including strategic planning, product and sales forecasting, risk and sensitivity management, and as investment research. Our Major Activities Multi-users market reports Database-RICDB Custom Research Company Search RICDB ( com/data/database html ), is a visible financial data base presented by map and graph covering global and China macroeconomic data, industry data, and company data. It has included nearly 500,000 indices (based on time series), and is continuing to update and increase. The most significant feature of this base is that the vast majority of indices (about 400,000) can be displayed in map. After purchase of our report, you will be automatically granted to enjoy 2 weeks trial service of RICDB for free. After trial, you can decide to become our formal member or not. We will try our best to meet your demand. For more information, please find at For any problems, please contact our service team at: