Surface Water Management Plan
|
|
|
- Harold Page
- 5 years ago
- Views:
Transcription

1 Boggabri Coal Pty Ltd Surface Water Management Plan February 2014 BCPL Page i
2 Revision Control Chart Rev No Original Revision Date 27/04/12 15/01/13 07/08/13 09/10/13 18/11/13 12/02/14 Prepared by N Harcombe D Evans N Harcombe D Evans N Harcombe D Evans N Harcombe D Evans N Harcombe K Agllias Reviewed by T Swanson E Lam / B Bird S Trott/ V O Keefe S Trott/ V O Keefe S Trott S Trott Approved by J Rennick J Green J Green J Green J Green J Green Signed Distribution Control Controlled copies will be distributed to and retained by relevant personnel including key Boggabri Coal Pty Limited (BCPL) agency and contractor representatives. Company BCPL Department of Trade and Investment, Regional Infrastructure and Services Division of Resources and Energy Department of Planning and Infrastructure Downer EDI Mining LCR Coal Position Environment Superintendent Regional Environmental Officer Senior Planner Project Manager Project Manager Uncontrolled Copies Uncontrolled copies may be issued on the authority of the BCPL Environment Superintendent. Such copies will neither be numbered nor kept up to date.
3 Contents Page Number 1. Introduction Site contacts Purpose of this SWMP Elements covered by the SWMP Related water management documents Responsibilities Agency consultation Revision status 5 2. Planning and statutory requirements Federal and State legislation Water Sharing Plans Regulated river WSP Unregulated river WSP Surface water guidelines ANZECC (2000) guidelines NSW water quality and river flow objectives Local policies and plans Project approval conditions Surface water and environmental setting Regional hydrology Local catchment hydrology Unnamed waterway - Nagero Creek Bollol Creek Hydrologic data and records Local catchment soils Catchment environmental values Sensitive aquatic species/habitat Native vegetation Baseline surface water data Surface water quality Surface water quantity Surface water management system Objectives Surface water management system - general Clean water management system 28 BCPL Page i
4 4.2.2 Dirty water management system Contaminated water management system Surface water management system mine plan stages Surface water management system Year Surface water management system Year Surface water management system Year Surface water management system Year Surface water management system Year Surface water management system Year Soil and sediment erosion control Construction and operational phase measures Closure and rehabilitation phase measures Post mining surface water management Rehabilitated areas Final void Haul road and Boggabri rail spur line Assessment outline Impacts to Nagero Creek Impacts to Bollol Creek Surface water program EPL compliance criteria Water quality Event based and ambient based Frequency based Sampling and analytical methods Water quantity Geomorphology Stream and riparian vegetation health Riparian vegetation health Aquatic macroinvertebrate Tree root depth analysis and GDE Proposed additional sites Surface water modelling Trigger levels and management responses Trigger levels Nagero Creek ambient Nagero Creek event Flooding impacts along haul road and rail spur Stream and riparian health Management responses Nagero Creek ambient 62 BCPL Page ii
5 7.2.2 Nagero Creek event Flooding impacts Stream and riparian vegetation health Incident management Complaint management Response plan Reporting and plan revision Reporting Annual surface water appendix Revision and development Annual review Planning related changes Changes to mine operations Feedback loop Agency consultation Submission of incident report Independent environmental auditing Future work Corrective and preventative actions Non-compliances and corrective actions Preventive actions Training and awareness Visitors induction Site induction Toolbox talks Task specific training Implementation Summary of actions References 76 BCPL Page iii
6 List of tables Table 1-1 Site contacts 2 Table 1-2 Related water management documents 3 Table 1-3 Surface water management roles and responsibilities 4 Table 1-4 Revision status 6 Table 2-1 BCPL water access licences for Lower Namoi Regulated River Water Source 8 Table 2-2 Reliability of supply for Namoi regulated river licences 8 Table 2-3 Project conditions of approval Planning and Assessment Commission of NSW 11 Table 2-4 Project conditions of approval SEWPAC 12 Table 3-1 Stream flow gauges along Namoi River 15 Table 3-2 Summary of flood flow rates derived for the Namoi River 16 Table 3-3 Summary of ambient water quality data Nagero Creek at SW2 upstream of mine site 21 Table 3-4 Summary of ambient water quality data Namoi River 24 Table 3-5 Measurements of water quality analytes recorded in Namoi River (adapted from Parsons Brinckerhoff, 2010b) 25 Table 4-1 Mine stage summary 30 Table 4-2 Rehabilitation design objectives 42 Table 6-1 EPL concentration limits for discharge to surface water 46 Table 6-2 Event based and ambient based summary Year 1 48 Table 6-3 Frequency based summary Year 1 50 Table 6-4 Water quality testing suites 50 Table 7-1 Receiving environment interim trigger levels 59 Table 7-2 Response plan 65 Table 11-1 Summary of actions 74 List of figures Figure 1.1 Document hierarchy 4 Figure 6.1 Example riparian sample site layout (Jansen et al. 2005) 54 Figure 7.1 Criteria for defining site performance criteria 57 List of appendices Appendix A Water management system layout plans, and discharge locations, and schematics. Appendix B Water quality data extracts sediment dam and SW2 daily Appendix C Summary of storages Appendix D Proposed points for Years 1, 2, 5, 10, 21 Appendix E Sediment and Erosion Control maintenance and inspection Appendix F Sampling methods Appendix G Proforma sheets for sampling and geomorphology surveys Appendix H Water quality and quantity data collection Appendix I Flooding response and communication protocol Appendix J Simple spill response BCPL Page iv
7 Glossary Glossary AEMR ANZECC ARMCANZ AUSRIVAS BCEP BCPL BMP BTM Complex CCC DP&I EA EC EMPs EMS Annual Environmental Management Report Australian and New Zealand Environment Conservation Council Agriculture and Resources Management Council of Australia and New Zealand Australian Rivers Assessment System Boggabri Coal Expansion Project Boggabri Coal Pty Limited Biodiversity Management Plan Boggabri-Tarrawonga-Maules Creek Complex Community Consultative Committee NSW Department of Planning and Infrastructure Environmental Assessment Electrical Conductivity Environmental Management Plans Environmental Management System EP&A Act Environmental Planning and Assessment Act, 1979 EPA Environment Protection Authority EPBC Act Environment Protection and Biodiversity Conservation Act, 1999 EPL EV GDE GMP IAR MCC MIA MOP Mtpa MWD PAC RL RMP ROM SD SIGNAL SMP SWMP TCM WAL WMP WQO Environment Protection Licence Environmental Value Groundwater Dependent Ecosystem Groundwater Management Plan Idemitsu Australia Resources Pty Limited Maules Creek Coal Project Mine Infrastructure Area Mining Operations Plan Million Tonnes Per Annum Mine Water Dam NSW Planning Assessment Commission Reduced Level Rehabilitation Management Plan Run of Mine Sediment Dam Scoring System used for Marco-Invertebrates Soil Management Protocol Surface Water Management Plan Tarrawonga Coal Mine Water Access Licence Water Management Plan Water Quality Objective BCPL Page v
8 1. Introduction Boggabri Coal Mine is located 15 km north-east of the township of Boggabri in north-western New South Wales. The Project is an open cut coal mine that has been operating since Truck and shovel operations produce a crushed and screened run-of-mine (ROM) coal product. Coal is transported on a sealed private haul road to a rail loading facility, for dispatch via the port of Newcastle for overseas consumption. The mine is managed by Boggabri Coal Pty Limited (BCPL), who engages contractors to undertake construction, mining, coal crushing and transportation activities. All contractors working at the Boggabri Coal Mine are required to operate in compliance with this Surface Water Management Plan (SWMP). In 2009, BCPL lodged a major project application (the Project) under the now-repealed Part 3A of the Environmental Planning and Assessment Act, 1979 (EP&A Act). In the project application, BCPL sought to extend its mining operations for a further 21 years, and increase its production rate to 7 Million tonnes per annum (Mtpa) of ROM coal from a total resource of 145 Mt. The Project includes operation of existing ancillary equipment; construction of a new coal handling and preparation plant; a 17 km rail spur line; bridges over the Namoi River and Kamilaroi Highway; a rail load-out facility located at the mine; upgrade of the overburden and coal extraction haulage fleet (with an option for a drag-line); upgrade of electricity transmission lines; and other ancillary infrastructure. The project application was determined by the NSW Planning Assessment Commission (PAC), under delegation by the Minister for Planning and Infrastructure. Project Approval 09_0182 (the Project Approval) was received in July Schedule 3, Condition 38 (b) of the Project Approval requires the preparation of a SWMP. This plan has been prepared in fulfilment of the requirements. The specific requirements of the SWMP are listed in Table 2-3. Conditions of approval were released by the Commonwealth Department of Sustainability, Environment, Water, Population and Communities (SEWPAC) on 11 February Conditions 15 to 19 apply to the SWMP. The specific federal requirements are listed in Table 2.4 To ensure clarity throughout the SWMP, reference is made to two distinct mine plans for which water demand, usage and storage characteristics are based, specifically the: 1. Revised Draft Mining Operations Plan (MOP): lodged with the NSW Division of Resources and Energy (DRE) in November The MOP spans a 5-year period between 2013 and Mine plan snapshots and water management systems relevant to mine years 0, 1, 2 and 5 are aligned with the MOP. 2. Environmental Assessment (EA) Mine Plan: lodged in 2009 and conditionally approved by the NSW Minister for Planning and Infrastructure in July 2012, the EA mine plan spans a 21 year period between 2013 and Mine plan snapshots and water management systems relevant to mine years beyond year 5 reflect the EA mine plan. BCPL Page 1
9 1.1 Site contacts The names and contact details of relevant BCPL employees and contractors are shown in Table 1-1. Table 1-1 Site contacts Title Company Name Contact No General Manager Operations BCPL Ken McLaren Manager Mining BCPL Lloyd Hardy Environment Superintendent BCPL Chase Dingle Mining Contractor Downer EDI Mining Mike Williams Coal Haulage Contractor LCR Mick Schultz Hour Community Response Line BCPL Boggabri 1.2 Purpose of this SWMP The purpose of this SWMP is to provide a framework which describes how BCPL will assess, manage, monitor and mitigate impacts to the surface water system. The objectives of this SWMP are to provide: Detailed baseline data on surface water flows and quality in the water-bodies that could potentially be affected by the development Detailed baseline data on hydrology across the downstream drainage system of the Namoi River floodplain from the mine site to the Namoi River A detailed description of the water management system on site, including design objectives and performance criteria for the water management system, discharge limits in accordance with the Environment Protection Licence (EPL) requirements, water storages, haul road and Boggabri Rail Spur Line Detailed plans, including design objectives and performance criteria for final voids, emplacement of reject material. Construction and operation of the Boggabri Rail Spur Line and bridge crossing the Namoi River, drainage line lines on rehabilitated areas and control of potential water pollution from rehabilitated areas Performance criteria for water management, downstream surface water quality, downstream flooding impacts, stream and riparian vegetation health including trigger levels for investigating any potentially adverse impacts associated with the development A program to monitor the effectiveness of the water management system and surface water flows and quality in affected watercourses and downstream flooding impacts Reporting procedures for the results of the program A plan to respond to any exceedances of the performance criteria, and mitigate and/or offset any adverse surface water impacts of the Project. BCPL Page 2
10 The SWMP is a component of the overarching Water Management Plan (WMP) and provides more detailed technical information and responses to surface water management on site. This SWMP is intended to be a live document. As such, it will be updated and amended as further information is obtained from environmental, environmental investigations or subsequent approvals, and in response to planning related changes (outlined in Section 8.2.2). 1.3 Elements covered by the SWMP This SWMP applies to all employees and contractors at the Boggabri Coal Mine and covers all areas within the Project Boundary as defined in the Project Approval. The SWMP refers to some areas outside of the Project Boundary in order to align surface water management with natural hydrological boundaries. The areas covered by the SWMP are described in Section Related water management documents This SWMP report has been prepared as an integral part of, and should be read in conjunction with, the documents listed in Table 1-2. The WMP document hierarchy is shown in Figure 1.1. Table 1-2 Related water management documents Document BTM Complex Water Management Strategy (WMS) Water Management Plan (WMP) Groundwater Management Plan (GMP) Site Water Balance (SWB) report Construction Environmental Management Plan (CEMP) Description Regional strategy prepared in consultation with Tarrawonga Coal Pty Ltd (TCPL) and Maules Creek Coal Project (MCC) Overarching document setting out water management framework, statutory requirements and procedural requirements Groundwater baseline data, performance criteria, program, response plan, groundwater model validation program Mine water balance modelling methodology, assumptions and results, mine water management system operating philosophy Potential impacts and mitigation measures relating to water management during construction of the expansion works including the MIA area and rail spur line. BCPL Page 3
11 BTM Complex Water Management Strategy BCPL Water Management Plan BCPL Surface Water Management Plan BCPL Groundwater Management Plan BCPL Site Water Balance Report BCPL Construction Environmental Management Plan Figure 1.1 Document hierarchy 1.5 Responsibilities BCPL is responsible for compliance with this SWMP. Surface water is undertaken by BCPL in accordance with the Environmental Protection Licence No (the EPL), Mining Operations Plan (MOP) and associated Environmental Management Plans (EMPs). BCPL is responsible for any remedial action that may be required as a result of an exceedance of the water quality performance criteria or results that are considered unacceptable. A summary of the key responsibilities are provided in Table 1-3 and full details on individual roles and responsibilities are provided in the WMP. A full description of the water quality process is provided in Section 6. Table 1-3 Surface water management roles and responsibilities Role Responsibility Frequency Surface water elements Water quality BCPL Discharge event As required Wet weather discharge As required Ambient ( Nagero Creek ) During/after a rainfall event Surface water elements Quarterly Water quantity BCPL Ambient ( Nagero Creek ) Creek) water level readings recorded with an automatic datalogger (after installation of a stage board) at SW1 and SW2 and utilised to estimate flows. Downloaded every 6 months/during ambient water quality Stream and riparian vegetation health and geomorphology BCPL Baseline survey, then repeated annually BCPL Page 4
12 Compliance matters Response triggers and actions Audits and actions regarding compliance BCPL BCPL to undertake independent audit and implement actions resulting; DP&I has compliance role regarding independent audit As required As required 1.6 Agency consultation Previous versions of this SWMP were prepared in consultation with representatives from the NSW Office of Environment and Heritage (OEH), NSW Office of Water (NOW), Namoi Catchment Management Authority (NCMA) and the Community Consultative Committee (CCC). The SWMP was prepared by suitably qualified persons, whose appointment to prepare this plan has been approved by the DP&I. The draft version of this SWMP has been reviewed by DP&I and comments have been addressed. This plan has been submitted to regulators (EPA and NOW), NCMA and the CCC. The final SWMP has been updated to incorporate feedback from regulators and the CCC. Evidence of consultation is presented in Appendix A of the WMP. 1.7 Revision status This SWMP described herein considers the entire life of mine and reflects the mine plans described in both the: 1. Revised Mining Operations Plan (MOP): lodged with the NSW Division of Resources and Energy (DRE) in November Environmental Assessment (EA) Mine Plan: lodged in 2009 and conditionally approved by the NSW Minister for Planning and Infrastructure in July The SWMP is to be reviewed and updated on an annual basis, or when any significant changes are made to mining operations or to the water management system described in this report. Revisions and updates are also needed as necessary as per Schedule 5 condition 5 - independent audit and incident report. Section 8 outlines the revision and development requirements of the SWMP. Previous revisions and updates made to this SWMP are summarised in Table 1-4. BCPL Page 5
13 Table 1-4 Revision status Rev No. Mine plans 0 Years 1 to 2 (i.e. calendar years 2012 to 2013) 1 2 Years 1 to 21 (i.e. calendar years 2012 to 2033) Years 1 to 21 (i.e. calendar years 2013 to 2033) 3 Years 1 to 21 (i.e. calendar years 2013 to 2033) 4 Years 1 to 21 (i.e. calendar years 2013 to 2033) 5 Years 1 to 21 (i.e. calendar years 2014 to 2034) Approval reference Boggabri Modification - DA 36/88 as modified on 19 October 2011 Boggabri Coal Project as approved on 18 July 2012 Boggabri Coal Mine as per Draft MOP lodged June 2013 and Boggabri Coal Mine Extension (EPBC 2009/5256) as approved 11 February 2013 Boggabri Coal Mine as per Revised Draft MOP lodged November 2013 and Boggabri Coal Mine Extension (EPBC 2009/5256) as approved 11 February 2013 Boggabri Coal Mine as per Revised Draft MOP lodged November 2013 and Boggabri Coal Mine Extension (EPBC 2009/5256) as approved 11 February 2013 Boggabri Coal Mine as per Revised Draft MOP lodged November 2013 and Boggabri Coal Mine Extension (EPBC 2009/5256) as approved 11 February 2013 Author Approval Date Comment N Harcombe D Evans N Harcombe D Evans N Harcombe D Evans N Harcombe D Evans N Harcombe S Trott K Agllias S Trott J Rennick 27 April 2012 J Green 16 January 2013 J Green J Green 29 July October 2013 J Green 18 November 2013 J Green 12 February 2014 Issue to DP&I, OEH, NOW, DRE, NCMA Issue to DP&I, OEH, NOW, NCMA, CCC DP&I comments addressed on draft WMPs. BCPL comments addressed. Issue to DP&I DP&I and BCPL comments addressed. Issue to EPA and DoE Relevant agencies comments addressed. Issue to DP&I BCPL Page 6
14 2. Planning and statutory requirements 2.1 Federal and State legislation Details on relevant federal and state legislation are provided within the WMP. 2.2 Water Sharing Plans Surface water sharing in the Namoi Water Management Area is regulated by the Water Sharing Plan (WSP) for the Upper and Lower Namoi Regulated River Water Sources 2003 and Water Sharing Plan for the Namoi Unregulated and Alluvial Water Sources 2012, made under the NSW Water Management Act Both WSPs contain various rules applying to the water sources such as access licence dealing rules, water supply works approval rules, water allocation account rules and access rules for rivers and creeks including cease to pump. BCPL are required to follow these rules when accessing water from these systems. BCPL also currently holds groundwater licences. Groundwater licences held by BCPL and their regulation under statutory plans are outlined in the Groundwater Management Plan (GMP) Regulated river WSP The objectives of the regulated river WSPs are to: Protect, preserve, maintain or enhance the important river flow dependent environmental features and Aboriginal, cultural and heritage values of these water sources Manage these water sources to ensure equitable sharing between all users Protect basic landholder rights of owners of land Provide opportunities for market based trading of regulated water entitlement within sustainability and system constraints Provide sufficient flexibility in water account management to encourage responsible use of available water Contribute to the maintenance of water quality The three categories of water access licences (WAL) under the WSP are: Regulated river high security Regulated river general security Supplementary water BCPL currently holds general security and supplementary water access licences for the Lower Namoi Regulated River Water Source. Details of these water access licences are BCPL Page 7
15 provided in Table 2-2. The total share component under these licences is 294 unit shares of general security water and 31.7 unit shares of supplementary water. The actual volume of river water available to BCPL from the general security licences would depend on the Available Water Determinations (AWD) made from time to time in accordance with the Water Sharing Plan for the Upper Namoi and Lower Namoi Regulated River Water Sources Supplementary access is also announced from time to time, and is dependent on the presence of unregulated flows in the regulated river, and on the operation of the WSP rules. Table 2-1 BCPL water access licences for Lower Namoi Regulated River Water Source Source Water Access Licence category Water Access Licence number Share component Lower Namoi River General Security WAL unit shares Lower Namoi River General Security WAL unit shares Lower Namoi River Supplementary Water WAL unit shares Lower Namoi River Supplementary Water WAL unit shares The Namoi Regulated River water sharing plan estimates that there are in total 256,400 unit shares of general security access licences and 115,000 unit shares of supplementary water access licences. Access to entitlement will vary from year to year depending on climatic conditions and water availability (see Table 2-2). A continuous accounting system is used in the Namoi Valley for general security [licence holders]. The maximum that may be held in an account is 2.0 ML per unit share. The amount carried over from year to the next is unlimited (maximum account balance effectively limits carryover volumes). The maximum usage (including trade) in any season is 1.25 ML per unit share. The maximum water use over any 3 consecutive years is 3.0 ML per unit share (Ribbons, 2009). Table 2-2 Reliability of supply for Namoi regulated river licences Reliability measure High security General security Supplementary Plan Limit Scenario Percentage of time full entitlement is available at start of water year (1July) Percentage of time full entitlement is available at end of water year (30 June) Average effective available water on 1 July Average cumulative AWD for water year Average annual percentage of the entitlement used (rounded to 5%) Ultimate Development Scenario 100% 50% - 100% 84% - 100% 95% - 100% 76% % 30% Long term extraction factor (Source: Ribbons, 2009) BCPL Page 8
16 2.2.2 Unregulated river WSP The Project Area is in the Maules Creek Tributaries Management Zone within the Water Sharing Plan for the Namoi Unregulated and Alluvial and Water Sources, At the commencement of the Plan there were no aquifer access licences in this Zone. The objectives of the unregulated river WSP are to: protect, preserve, maintain and enhance the important river flow dependent and high priority groundwater dependent ecosystems of the water sources, protect, preserve, maintain and enhance the Aboriginal, cultural and heritage values of the water sources, protect basic landholder rights, manage these water sources to ensure equitable sharing between users, provide opportunities for enhanced market based trading of access licences and water allocations within environmental and system constraints, provide water allocation account management rules which allow sufficient flexibility in water use, contribute to the maintenance of water quality, provide recognition of the connectivity between surface water and groundwater, adaptively manage the water sources, and contribute to the environmental and other public benefit outcomes identified under the Water Access Entitlements and Planning Framework in the Intergovernmental Agreement on a National Water Initiative (2004). There are 55.4 ML/year of stock and domestic basic rights, 7ML/yr of stock and domestic access licences, and 1,406 unit shares of unregulated river access licences in the Maules Creek Water Source. BCPL does not hold any licences in this water source. Licences trading opportunities are constrained to within the Maules Creek Tributaries Management Zone of the Maules Creek Water Source. As these tributaries are generally ephemeral, the reliability of licences is probably quite low, and direct rivers access would be intermittent at best. 2.3 Surface water guidelines Several guidelines apply to the development and management of surface water systems within the local and regional catchment contexts, as outlined in the following sections. The following guidelines have been utilised in the development of water quality triggers for the Project, along with baseline data and EPL conditions. These triggers are discussed in Section BCPL Page 9
17 2.3.1 ANZECC (2000) guidelines The Australian and New Zealand Environment Conservation Council (ANZECC) Australian and New Zealand Guidelines for Fresh and Marine Water Quality (ANZECC, 2000) provide a national benchmark for assessing water quality in systems throughout Australia and New Zealand. The ANZECC (2000) guidelines provide regional trigger values based on their location within Australia or New Zealand, which can be used to develop more local guidelines or strategies such as catchment water quality and river flow objectives (see Section 2.3.2), particularly in the absence of site specific water quality information NSW water quality and river flow objectives The Water Quality and River Flow Objectives have been developed to guide plans and actions to achieve healthy waterways in NSW. Each objective is based on providing the right water quality for the environment and the different beneficial uses of the water. They are based on measurable environmental values (EVs), which are those values or uses of water that the community believes are important for a healthy ecosystem for public benefit, welfare, safety or health. The target concentrations for each water quality objective (WQO) are based on ANZECC (2000). The EVs for the uncontrolled streams in the Namoi catchment relevant to the Project area: Aquatic ecosystems. Objective: Maintaining or improving the ecological condition of water bodies and their riparian zones over the long term. Visual amenity. Objective: Maintaining aesthetic qualities of waters. Livestock water supply. Objective: Protecting water quality to maximise the production of healthy livestock. Irrigation water supply. Objective: Protecting the quality of waters applied to crops and pasture. Aquatic foods (cooked). Objective: Protecting water quality so that it is suitable for the production of aquatic foods for human consumption and aquaculture activities. (Note: The ANZECC (2000) Guidelines lists this environmental value as Aquaculture and human consumption of aquatic foods) Local policies and plans Namoi Catchment Management Authority (CMA) plans and policies have been considered in the development of this SWMP and are listed below. For further information on Namoi CMA documents refer to Section 2.5 of the WMP. Namoi CMA Catchment Action Plan Namoi CMA Extractive Industries Policy Namoi CMA cumulative risk assessment tool (currently being developed) 2.4 Project approval conditions Conditions of the Project Approval relating to surface water management are provided in Section 3.3 of the WMP and are summarised in Table 2-3 and Table 2-4. BCPL Page 10
18 Table 2-3 Project conditions of approval Planning and Assessment Commission of NSW Applicable Condition Schedule 3 Condition 38 Requirement (b) A Surface Water Management Plan, which includes: detailed baseline data on surface water flows and quality in the water-bodies that could potentially be affected by the project; detailed baseline data on soils within the irrigation* management area; detailed baseline data on hydrology across the downstream drainage system of the Namoi River floodplain from the mine site to the Namoi River; a detailed description of the water management system on site, including the: clean water diversion systems erosion and sediment controls (dirty water system) mine water management systems including irrigation areas discharge limits in accordance with EPL requirements water storages haul road and Boggabri Rail Spur Line and bridge flood and water diversions detailed plans, including design objectives and performance criteria for: design and management of final voids design and management for the emplacement of reject materials, sodic and dispersible soils and acid or sulphate generating materials design and management for construction and operation of the Boggabri Rail Spur Line and bridge across the Namoi River floodplain and upstream adjoining Nagero /Bollol creek catchments reinstatement of drainage lines on the rehabilitated areas of the site control of any potential water pollution from the rehabilitated areas of the site performance criteria for the following, including trigger levels for investigating any potentially adverse impacts associated with the project: the water management system soils within the irrigation area* downstream surface water quality downstream flooding impacts, including flood impacts due to the construction and operation of the Boggabri Rail Spur Line and rail bridge stream and riparian vegetation health, including the Namoi River a program to monitor: the effectiveness of the water management system soils within the irrigation area surface water flows and quality in the watercourses that could be affected by the project downstream flooding impacts SWMP Reference Refer to Section 3.6 of this SWMP. Refer to Section 3.4 of this SWMP Refer to Section 3.3 of this SWMP. Refer to Section 4 of this SWMP; also refer to the Rehabilitation Management Plan (RMP). Refer to Sections 4 and 5 of this SWMP Refer to Section 7 of this SWMP; also refer to the RMP. Refer to Section 6 of this SWMP; also refer to the RMP. reporting procedures for the results of the program Refer to Section 8 of this SWMP. a plan to respond to any exceedances of the performance criteria, and mitigate and/or offset any adverse surface water impacts of the project. Refer to Section 7.2, 7.3 and Table 7-2 of this SWMP. * An irrigation management area is not currently planned for the Boggabri Coal Mine BCPL Page 11
19 Table 2-4 Project conditions of approval SEWPAC Applicable Condition Requirement SWMP Reference 15 The person taking the action must provide to the Minister for approval, the surface and groundwater management plans as identified in condition 38 of the NSW state government Project Approval dated 18 July 2012 (application no, 09_0182). The surface and groundwater management plans approved by the Minister must be implemented prior to the commencement of new mining operations 16 The surface and groundwater management plans must be consistent with the National Water Quality Management Strategy 17 The person taking the action must within 6 months of this approval, in collaboration with the person taking the action to develop and operate the Maules Creek Coal Project (EPBC 2010/5566) and any other approved mines within 20km of the mine site provide written advice to the Minister demonstrating how the approved surface and groundwater management plans (specified in condition 15), addresses the cumulative impact of groundwater drawdown as a result of mining and how this may impact on the consequent health of the remnant native vegetation in the Leard State Forest, the Leard State Conservation Area and surrounding areas. In particular advice must address the following matters: a. maximum amount of allowable drawdown in the alluvial aquifer b. drawdown in hard rock aquifer c. trigger levels pertaining to drawdown in the alluvial aquifer when corrective actions will be required to be undertaken d. identify the depth of root zone of the native vegetation e. to assess the ongoing quality and quantity of both surface and groundwater to identify impacts on the native vegetation 18 The person taking the action must within 6 months of the date of this approval, or such other timeframe as specified by the Minister, provide to the Minister a report on: a. any updated modelling of surface and groundwater impacts that has been undertaken in preparing the surface and groundwater management plans b. how the surface and groundwater management plans address groundwater and surface water impacts on native vegetation 19 A risk-based assessment of the disposal of mine water by irrigation on soils must be undertaken. The assessment must include the risk of metal and salinity accumulation on the soils See contents of Table 2-3 above Refer to Section of the WMP a) See Section of GMP b) See Section of GMP c) See Section of GMP d) See Section of this SWMP and Section of WMS e) See Section 6.3 of this SWMP and Section and of GMP, Section 5.3 of WMS a) See Section of this SWMP, Section of GMP, Section 6.3 of WMS b) See Section and 7.3 and Section 4.1 of GMP NA* * An irrigation management area is not currently planned for the Boggabri Coal Mine. BCPL Page 12
20 3. Surface water and environmental setting 3.1 Regional hydrology Boggabri Coal Mine is largely contained within the catchment of an unnamed ephemeral waterway, locally called Nagero Creek. A small area to the south of the Mine Infrastructure Area (MIA) is located within the catchment of Bollol Creek. Nagero Creek and Bollol Creek are both small tributaries of the Namoi River, which is part of the Barwon-Darling River system. The Namoi River catchment is bounded by the Great Dividing Range in the east, the Liverpool Ranges and Warrumbungle Ranges in the south, and the Nandewar Ranges and Mount Kaputar to the north. Major tributaries of the Namoi River include Coxs Creek, Mooki River, Peel River, Cockburn River, Manilla River and Macdonald River, which all join the Namoi River upstream of Boggabri. The Namoi River catchment has an area of approximately 42,000 km 2. The catchment extends over 350 km in an east-west direction between the Great Dividing Range and the Barwon River. The Namoi River catchment area to Boggabri is approximately 22,600 km 2. Split Rock Dam on the Manilla River and Keepit Dam on the Namoi River are the two main water storages in the Namoi River catchment. These structures allow the delivery of flows to meet the needs of water users downstream. Average annual rainfall in the Namoi River catchment is highly variable, and decreases across the catchment from around 1,000 mm along the Great Dividing Range in the east, to around 470 mm in the western extent of the catchment. The Namoi Valley is subject to regular flooding. The existing mining area and MIA are not located within the floodplain; however, the existing product coal haul road and approved rail spur line both cross the floodplain. 3.2 Local catchment hydrology Unnamed waterway - Nagero Creek The existing mining area and MIA are entirely contained within the catchment of an unnamed ephemeral waterway, locally called Nagero Creek. Figure 1 in Appendix A shows the existing watercourses in the area. Nagero Creek catchment is bounded by the Willowtree range to the north-east and falls generally to the south-west. The catchment area is approximately 43km 2 to the point where Nagero Creek meets the Namoi River floodplain. The Nagero Creek catchment is approximately 0.2% of the total Namoi River catchment area to Turrawan gauge, approximately 40km downstream of Boggabri Township on the Namoi River and downstream of Boggabri Coal Mine. The majority of Nagero Creek catchment upstream of the existing mine site is contained within the Leard State Forest. Leard State Forest has been selectively logged in the past, but is generally still forested with the exception of Boggabri Coal Mine, Tarrawonga Coal Mine and Leard Forest Road. The majority of the catchment downstream of the mine site comprises cleared farm land. BCPL Page 13
21 From the south-western corner of the mining area, Nagero Creek flows about 8 km westward to the Namoi River. The cross-section of Nagero Creek comprises a well-defined incised channel up to approximately 15 m wide bank to bank and 3 m deep. The banks are well vegetated, and the bed comprises sand and/or rock. The bed slope varies between approximately 2% at the top of the catchment to 0.8% at the downstream edge of the Boggabri Coal Mine. Downstream of the site, Nagero Creek becomes indistinct as it flows across the Namoi River floodplain. These alluvial flats become swampy following rainfall, and natural ponds (such as the Slush Holes ) and farm dams store water for long periods. There is anecdotal evidence that during high flow events Nagero Creek overtops its floodplain into the Bollol Creek (and vice versa) and that this will reduce throughout the duration of the project. It was noted that this was likely to occur some way upstream of the rail spur line and loop leading to Boggabri Coal Mine. Additional information was also sought from the NSW Office of Water and the advice received was that the NSW Office of Water has no record of Bollol Creek flooding in the area of the rail spur line works (Aurecon, 2013). Any overflows from the Nagero Creek catchment upstream of the rail spur line will overtop into the Tarrawonga Coal Mine Bollol Creek The existing mine water dam MW3 is contained within Bollol Creek catchment. The southern portion of the approved irrigation area is located in Bollol Creek catchment; however, the approved irrigation system is not planned for operation at this stage. No mining areas or other mine infrastructure are contained within Bollol Creek catchment. Tarrawonga Mine has part of their mining lease within Bollol Creek catchment (Gilbert & Associates Pty. Ltd, 2010). Bollol Creek is an ephemeral stream with a total catchment area of approximately 850 km 2, about 3.5% of the Namoi River catchment to Turrawan gauge. The upper catchment consists of forest and grades to a low lying wide floodplain. The floodplain part of the catchment is predominately cleared and used for cropping, grazing and other agricultural land uses. From the floodplain the creek meets Barbers Lagoon which then floods north-west to its confluence with the Namoi River (Gilbert & Associates Pty. Ltd, 2010). Hydrologic and hydraulic modelling for Nagero Creek and Bollol Creek undertaken to date did not examine in detail the interaction of these creeks during high flows; although it was concluded that any overtopping of flows from Nagero Creek to Bollol Creek was likely due to natural changes and not caused by the rail spur line (refer to section 5.3). Anecdotal evidence suggests that during high rainfall events there is overtopping and hydraulic interaction between Bollol Creek and Nagero Creek. Consideration will be given to commissioning a review of hydrological interaction between Bollol and Nagero Creek, working with relevant stakeholders (i.e. NoW, CCC) to consider further work in this regard. 3.3 Hydrologic data and records Flow data has been recorded by NOW along the Namoi River at the gauging stations shown in Table 3-1. The largest recorded flood event (maximum daily flow) for the Namoi River at Boggabri and Namoi River at Gunnedah gauges occurred in February Both gauges have a long period of record. The Namoi River at Turrawan gauge recorded its highest daily flow during another significant flood event in Other large floods have occurred in January 1971, February 1956 and February 1984 (WRM, 2009). BCPL Page 14
22 Table 3-1 Stream flow gauges along Namoi River Station Station commence date Namoi at Boggabri 16/11/1911 (Open) Boggabri Weir (Closed) Namoi at Turrawan 01/07/1953* (Open) Maules Creek at Avoca East 08/06/1972 (Open) Namoi at Gunnedah 27/11/1891 (Open) Maximum discharge (ML/day) Maximum gauged date Catchment area (km 2 ) /02/ ,600 NA NA 22,700** /01/ , /02/ /02/ ,100 *Discharge volume has been measured since August 1953 and discharge rate and stream level since **Catchment size from WRM (2009) report Water levels for the Namoi River at Boggabri are heavily regulated by upstream dams. Releases are made from Keepit Dam. Releases are lower during winter months, with less demand from irrigators. The Namoi River flood flows take about two days to travel from Gunnedah to Boggabri, a distance of about 40 km (WRM, 2009). A number of flood studies have been undertaken regionally for the Namoi River, but only a few relate to the stretch of the Namoi River downstream of Boggabri. Key studies undertaken for Namoi River near Boggabri Coal Mine are identified below: Continuation of Boggabri Coal Mine - Namoi River Flood Impact Assessment (WRM, 2009) Tarrawonga Coal Mine Modification - Surface Water Assessment (Gilbert & Associates Pty. Ltd, 2010) Namoi River flood study for the proposed Maules Creek Mine (Parsons Brinckerhoff, 2011) These reports provided useful information on the Namoi River flows downstream of Boggabri. However, limited information is available for Nagero Creek. Parsons Brinckerhoff (2011) summarised flow data from previous flood studies undertaken from 1980 to 2009 and their reports include historic flood and design flows for the Namoi River. Note that some of these flow records and design flows are for sites located a significant distance from the Namoi River near the Boggabri Coal Mine site, but are the best available flood information. Table 3-2 summarises the flood flow rates derived for the Namoi River. BCPL Page 15
23 Table 3-2 Summary of flood flow rates derived for the Namoi River Historic flood flows (m 3 /s) Source 1 Source 2 Source 3 Source 4 Source 5 Source 6 Source Flood Flood Flood Flood Design flows (m 3 /s) 5yr ARI yr ARI yr ARI yr ARI yr ARI Source 1 - Report on Flood Levels at Boggabri, Appendix 2, AAMX-BHP Joint Venture, Boggabri Coal Project, EIS 1983; Source 2 - Flood Information Report Floods in the Namoi Valley, Water Resources Commission, 1980; Source 3 - Water Quality in the Namoi Catchment ,Department of Land & Water Conservation; Source 4 - Proposed Coal Haulage Road and Namoi River Crossing Effects on River Hydraulics, Kinhill Engineers Pty Ltd, 1993; Source 5 DWE streamflow records from Pineena database for Boggabri (419012); Source 6 - DWE streamflow records from Pineena database for Turrawan (419023); Source 7 - Continuation of Boggabri Coal Mine Namoi River Flood Impact Assessment, WRM 2009 Aurecon (2013) undertook a flood assessment of Nagero Creek for the construction of the rail spur line from Boggabri Coal Mine, running west across the Namoi River floodplain to where it will link in with the existing rail network. The 100 year design flow for Nagero Creek at the rail spur line (referred to as Nagero Creek elbow) was estimated using a standard Rational Method approach based on catchment area, rainfall and runoff coefficients. Refer to section 5.2 of the Aurecon report (2013) for details on design flow estimation methodology. At present no stream flow gauging is undertaken by BCPL on Nagero Creek and there are no historic stream flow records. This has been identified as a significant data gap in order to assess baseline conditions. Water quality on Nagero Creek is undertaken by Whitehaven Coal for the neighbouring Tarrawonga Coal Mine site, however, no flow gauging is undertaken. This was also identified as a data gap by Gilbert and Associates (2010). Section 6.3 of this SWMP outlines the actions and of flows that will be undertaken to address this gap. 3.4 Local catchment soils A Soil Survey and Land Resource Impact Assessment (GSS Environmental 2010) was undertaken for the Part 3A Continuation of Boggabri Coal Mine Project Environmental Assessment (EA) (Hansen Bailey 2010). The soil assessment identified the following soil units within the Project Boundary: Grey Brown Gradational Loam. These moderately drained soils range from slightly acidic to neutral in the upper layers to strongly acidic to moderately alkaline at depth. The soils are generally non saline with poor to moderate fertility characteristics. The topsoil is non-sodic tending to moderately sodic in the subsoil. These soils are found on the waning mid to lower slopes within the Leard State Forest. BCPL Page 16
24 Light Brown Uniform Gravelly Sand. These well drained soils range from moderately acidic to strongly acidic at depth. The soils are generally non saline with poor fertility characteristics. The topsoil and subsoil are non-sodic. These soils are found on the upper slopes, crests and ridgelines within the Leard State Forest. Light Brown Duplex Loam. These moderately drained soils range from moderately acidic in the upper layers to strongly alkaline at depth. The soils are generally non saline with poor fertility characteristics. The topsoil is non-sodic whilst the subsoil is sodic to very sodic. These soils are found on the waning lower slopes within the Leard State Forest and nearby grazing land. Brown Gradational Clay. These poorly drained soils range from neutral to strong alkaline in the upper layers to moderate to strong alkaline at depth. The soils are generally non saline with good fertility characteristics. The topsoil is non-sodic tending to highly sodic in the subsoil. These soils are found on the lower slope, flats and flood plain of the higher quality grazing and cropping soil. The Grey Brown Gradational Loams, Light Brown Duplex Loams and Brown Gradational Clay showed a similar pattern, with the upper layers being non dispersive and non sodic, and the subsoils tending to be highly dispersive and highly sodic with depth. The Light Brown Uniform Gravelly Sands were found to be non-dispersive and non-saline throughout the soil profile (GSS Environmental 2010). 3.5 Catchment environmental values Sensitive aquatic species/habitat Local context The biodiversity impact assessment carried out for the Part 3A Continuation of Boggabri Coal Mine Project EA (Parsons Brinckerhoff, 2010b) found that the aquatic habitat in the Project Boundary (including Nagero Creek and Bollol Creek) was of a very poor quality. Aquatic habitats within the Project area consist mainly of farm dams, mine dams and riverine woodlands. Collectively these habitats contain moderate habitat for native fauna, particularly amphibians and avifauna. The endangered Aquatic Ecological Community in the Natural Drainage System of the Lowland Catchment of the Darling River as listed on the Fisheries Management Act 1994 was identified within the project boundary and is consistent with the surrounding local environment. River Red Gum riparian vegetation associated with the Namoi River (classed as an overcleared vegetation type) was highly disturbed from clearing and exotic weed incursions and contained limited habitat for aquatic fauna. Aquatic habitats within the Project Boundary were found to be generally poor to very poor in quality. Aquatic macrophytes are important components of riverine systems and studies of aquatic macrophytes and the association between macro-invertebrates and diversity of native fish have emphasised the role of structural complexity in determining the composition of assemblages (Cummins, 1997; Pusey & Arthington 2003). There were few aquatic macrophytes recorded within the Namoi River and this can be attributed to the severely degraded condition of the aquatic habitats. This degradation of aquatic habitats is likely to be attributed to anthropogenic disturbances, which included pollution, cattle access, changes in water flow regimes and loss of riparian stream bank vegetation (PB 2010b). BCPL Page 17
25 Regional context The Namoi River and several creeks within the Project Boundary fall within the lowland catchment of the Darling River. The River Red Gum Riverine Woodlands vegetation community, recorded within the Project Boundary is a regionally significant community and is classified as an over-cleared vegetation type (Parsons Brinckerhoff, 2010b). It is estimated that only 75% of its pre-european distribution remains. A review of past assessments of the Namoi River riverine condition (Thoms 1999, cited in Parsons Brinckerhoff, 2010b) made the following conclusions: The riparian vegetation of River Red Gum Riparian Woodlands and forests which occur on the banks of the Namoi River are highly disturbed and severely degraded as a result of clearing and exotic weed incursions. The remaining riparian vegetation contains limited habitat for aquatic fauna. Numerous migratory freshwater fish species in the Namoi River are significantly impacted by the construction of dams and weirs which block fish passage and undoubtedly contribute to the decline in native fish species. Few aquatic in-stream macrophytes were recorded within the Namoi River due to poor aquatic habitat quality as a result of anthropogenic disturbances, including cattle access, changes in water flow regimes and loss of riparian streambank vegetation Native vegetation The majority of vegetation communities within the Leard State Forest occur on slopes and ridges associated with well drained soils characterised by shallow skeletal conglomerate on the steeper upper slopes and drainage lines and deep basaltic derived fertile soils on the lower slopes. Such vegetation is disconnected from localised groundwater systems. Roots are unable to grow far into soil horizons that are of high bulk density (i.e. excessively stony soils). Consequently, rooting depth in areas of shallow bedrock is limited. Groundwater is not within the root zone of these vegetation types given their location in the landscape, and as such they are not groundwater dependent. These vegetation types, which include vegetation that occurs adjacent to ephemeral streams, rely on rainfall to support growth and photosynthesis. Riparian forests such as the River Red Gum open forest on the banks of the Namoi River rely on the availability of groundwater below the surface but within the rooting depth of the vegetation. The loose, deep, well-drained alluvial soils with large pore spaces promote greater root depths as they are well aerated and provide less resistance to root penetration (rooting is not limited by underlying rock). Ironbark and Box eucalypts, such as those that dominate the lower slopes of the study area, are shallow rooted and allocate substantial biomass to above-ground parts at the expense of an expansive root system (Fensham & Fairfax, 2007). They are unlikely, therefore to be groundwater dependent. While loamy soils allow considerable root development, the remnant vegetation communities (Pilliga Box Popular Box White Cypress Pine Grassy Open Woodland and Plains Grassland) that are restricted to the lower lying plain areas with these soils are generally associated with shallow perched water tables over impermeable clay lenses rather than groundwater fed by subsurface aquifers. This vegetation is likely to send roots to the BCPL Page 18
26 perched water table but not through the impermeable clay lens. This also applies to Derived Native Grassland and Exotic Grassland vegetation types. The development of tree root architecture is influenced by both the tree species and a range of soil conditions. Mechanical resistance, aeration, fertility, and moisture of the soil will influence rooting depth. Broad ecosystem scale studies have shown that sclerophyllous shrubland and forest (such as that in the study area) have a mean rooting depth of 5.2 ± 0.8 m (Canadell et al. 1996). Average rooting depth for temperate grassland has been shown to be 2.6 ± 0.2 m (Canadell et al. 1996). 3.6 Baseline surface water data Surface water quality Surface water quality is currently undertaken by BCPL in accordance with the EPL, the MOP and associated EMPs at seven sampling locations: Nagero Creek upstream and downstream of existing mine operations (2 locations) Within existing sediment and mine water dams (5 locations) One-off surface water was also undertaken at the Namoi River as part of the environmental assessment process (Parsons Brinckerhoff, 2010b). Monitoring locations are shown in Appendix A. Monitoring is undertaken for ph, electrical conductivity, total suspended solids, oil and grease, nitrate, nitrogen (total), phosphorus (total) and reactive phosphorus. Monitoring of dissolved metals was also undertaken on a total of four occasion(s) in Nagero Creek Nagero Creek baseline The EPL specifies that ambient water quality is to be undertaken upstream of the mine to initially establish background conditions of Nagero Creek. This site is called SW2. Water quality downstream of the mine at Nagero Creek is also to be undertaken at SW1. Water quality by BCPL is not undertaken in Bollol Creek as no surface water discharges currently occur into this catchment from the Boggabri Coal Mine site. A summary of the Nagero Creek data for key parameters collected by Boggabri Coal at SW2 upstream of the mine between July 2008 and July 2012 is provided in Table 3-3. The baseline sampling results have been compared against ANZECC (2000) outlined in Section 2.3, using the most stringent triggers for the identified EVs. The values highlighted in red in Table 3-3 indicate that the ANZECC (2000) water quality trigger has been exceeded and values highlighted in green indicate that the water quality trigger has been satisfied. Samples have been collected on 6 discrete occasions and 42 daily occasions. The 80 th percentile has been calculated for each analyte as recommended by ANZECC (2000) for developing site-specific trigger values for slightly to moderately disturbed ecosystems. Typically 2 years worth of contiguous monthly data are recommended for development of customised site-specific triggers (see Section ), however until more data becomes available the values in Table 3-3 have been used to provide a reference for the baseline. BCPL Page 19
27 Preliminary 80 th percentile values have been calculated and will be updated once more data becomes available. The ANZECC (2000) guidelines, along with the baseline sampling results, have been combined in Section 7.1 to develop water quality triggers for the Project going forward. BCPL Page 20
28 Table 3-3 Summary of ambient water quality data Nagero Creek at SW2 upstream of mine site ANZECC (2000) guideline SW2 80 th percentile (preliminary value - to be revised) 23/09/20 08 ph a /10/ /12/ /02/2 009 Feb 2012* Mar 2012* 12/07/ /07/201 2 Electrical conductivity (µs/cm) a Total suspended solids (mg/l) 40 b Total nitrogen as N (mg/l) 0.25 a ND 0.68 Total phosphorus as P (mg/l) 0.02 a ND ND 0.18 Oil and grease (mg/l) Not be noticeable as a visible film on the water ND ND ND <5 <5 <5 <5 ND - Nitrate (mg/l) 0.7 a 0.05 < ND 0.05 Reactive phosphorus (mg/l) a ND ND ND Dissolved metals: Arsenic (mg/l) a ND ND ND ND ND ND Cadmium (mg/l) a ND ND ND ND < < ND ND < Chromium (mg/l) a ND ND ND ND <0.001 <0.001 ND ND <0.001 Copper (mg/l) a ND ND ND ND ND ND Lead (mg/l) a ND ND ND ND ND ND Nickel (mg/l) c ND ND ND ND ND ND Zinc (mg/l) b ND ND ND ND ND ND Iron (mg/l) 10 c ND ND ND ND ND ND 0.25 a: ANZECC (2000) guideline for the protection of aquatic ecosystems, south-east Australia, slightly to moderately disturbed ecosystem, upland streams (>25AHD); b: ANZECC (2000) guideline for aquatic foods; c: ANZECC (2000) guideline for irrigation water (short term) ND no data Red shaded cells Exceedance of guideline value; Green shaded cells Below guideline value (except ph & electrical conductivity where green within range and red outside lower/upper limit) *daily was undertaken for the period of 16 th to 29 th February for February 2012 and 1 st to 28 th March for March 2012, so average values have been displayed in the table above. For the average dissolved metals calculation, where recordings have been reported as less than, the value has been havled so that averages could be calculated.. The 80 th percentiles for dissolved metals have been based on the 80 th percentile of 42 daily data points recorded in February 2012 and March 2012 (see Appendix B for raw data). BCPL Page 21
29 A summary of the ambient water quality results at SW2 upstream of the mine site is provided below: ph ranged from 5.9 to 7.8 Electrical conductivity ranged from 33 to 479 µs/cm Total suspended solids concentrations ranged from 32 to 220 mg/l Oil and grease was sampled on four occasions and was not detected Dissolved metals were sampled daily at SW2 for 42 days during the period of February and March 2012.This daily occurred during the emergency discharge following heavy rainfall events (explained in more detail in the Section of the SWB). SW2 is upstream of the emergency discharge point. Values in Table 3-3 shown for Feb 2012 and Mar 2012 represent the average daily concentration measured during the months of February and March Refer to Appendix B for the raw data. Background total suspended solids, nitrogen and phosphorous concentrations at the upstream point SW2 are naturally elevated and exceed the ANZECC (2000) guidelines for aquatic ecosystems. These concentration ranges for Nagero Creek are consistent with results previously recorded for Nagero and Bollol Creek by the Tarrawonga Coal Mine Modification Surface Water Assessment (e.g.total suspended solids mg/l) (Gilbert and Associates, 2010). Electrical conductivity values were within the ANZECC guideline range for most samples, except during the emergency discharge release during February and March 2012 when the average electrical conductivity recordings exceeded the guideline range. The background ph was generally neutral to slightly alkaline but was lower (i.e. more acidic) than the range specified in in ANZECC (2000) for upland streams on one occasion. Dissolved copper, lead and zinc were detected in low levels at SW2 indicating there are background levels of dissolved metals present in the natural catchment. Dissolved metal concentrations were also monitored within the site water dams between February 2010 and March Dissolved metal concentrations were assessed against ANZECC guideline values for discharging sediment dams SD3, SD6 and SD23 (see Appendix B for the raw data recorded). Across all of these sediment dams arsenic, cadmium, nickel and iron were below the ANZECC guidelines and also in many cases below the level of detection. Copper and zinc at SD6 and SD23 exceeded ANZECC values. Lead was exceeded at SD6 in February 2012, however, at SW2 the February 2012 lead levels measured also exceeded ANZECC guideline values. Chromium was detected once at SD23 and not detected at SW2. During February 2012, copper, nickel and zinc levels in the sediment dams and at SW2 exceeded ANZECC guideline values. For example, copper concentrations at SD6 for February 2012 were above ANZECC guidelines at mg/l, however, ambient water quality measured at SW2 during February 2012 (average reading of mg/l for copper) indicated that copper was also present in runoff water upstream of the mine. The frequent exceedences of target WQOs at SW2 highlight the need to develop site specific triggers based on local conditions. This is discussed in detail within Section Namoi River baseline Water quality in the Namoi River has also been recorded by BCPL in 2012 at two sampling locations on a total of 42 occasions; NR1 located upstream at the road crossing of Boggabri- Manilla Road and NR2 located downstream of the mine near the haul road crossing (see figure in Appendix B for location of samplings sites for the wider BCPL environmental program). NR1 is located downstream of the Bollol Creek confluence with the BCPL Page 22
30 Namoi River, but upstream of the Nagero Creek confluence with Namoi River and NR2 is located downstream of these confluences. Results from this sampling on the Namoi River are shown in Table 3-4 along with another discrete sample taken during July Turbidity and electrical conductivity data from the Namoi River at Gunnedah (station number ); approximately 35 km upstream from the Nagero Creek confluence are provided by NSW Office of Water. Turbidity values between June 1995 and February 2000 (n 4,070) ranged from NTU with an average of 60 NTU. Although the exact relationship between turbidity and total suspended solids readings in this system has not been established, these data suggest that Namoi River would probably exceed the ANZECC 2000 guideline for total suspended solids in Table 3-3 on a frequent basis. This is similar to the comparison for the upstream locations where all sampling periods were above the guideline value (Table 3-4). Electrical conductivity values between June 1995 and June 2013 (n 210,317) ranged from 0 1,184 µs/cm with an average of 486 µs/cm. These data indicate that the Namoi River at Gunnedah exceeds the upper limit of the ANZECC 200 guideline for electrical conductivity 70 percent of the time, a higher frequency than indicated for the upstream locations, NR1 and NR2 (Table 3-4). BCPL Page 23
31 Table 3-4 Summary of ambient water quality data Namoi River Analyte/ Parameter ANZECC (2000) guideline NR1 NR2 February 2012* March 2012* 24/07/2012 February 2012* March 2012* 24/07/2012 ph a Electrical conductivity (µs/cm) 350 a Total suspended solids (mg/l) 40 b Total nitrogen as N (mg/l) 0.25 a Total phosphorus as P (mg/l) 0.02 a Oil and grease (mg/l) Not noticeable <5 <5 <5 <5 <5 <5 Nitrate (mg/l) 0.7 a ND Reactive phosphorus (mg/l) a ND Arsenic a ND Cadmium a < < ND < < Chromium a <0.001 <0.001 ND <0.001 < Copper a <0.001 ND Lead a <0.001 ND < Nickel a ND < Zinc b ND Iron 10 c ND a: ANZECC (2000) guideline for the protection of aquatic ecosystems, slightly to moderately disturbed ecosystem, upland streams. b: ANZECC (2000) guideline for aquatic foods. c: ANZECC (2000) guideline for irrigation water (short term) ND no data Red shaded cells Exceedance of guideline value; Green shaded cells Below guideline value (except ph & electrical conductivity where green within range and red outside lower/upper limit) *daily was undertaken for the period of 16 th to 29 th February for February 2012 and 1 st to 28 th March for March 2012, so average values have been displayed in the table above. For the average dissolved metals calculation, where recordings have been reported as less than, the value has been havled so that averages could be calculated. Refer to Appendix B for the raw data. BCPL Page 24
32 The biodiversity impact assessment carried out for the Continuation of Boggabri Coal Mine Project Part 3A EA included water quality sampling on one occasion along the Namoi River (August 2009). Water quality sampling was undertaken upstream, downstream and at the mine haul road river crossing. Table 3-5 summarises the sampling carried out at each of the three locations (Parsons Brinckerhoff, 2010b). Results have been compared against ANZECC (2000) guidelines for the protection of aquatic ecosystems. Table 3-5 Measurements of water quality analytes recorded in Namoi River (adapted from Parsons Brinckerhoff, 2010b) Analyte ANZECC (2000) guideline* Namoi River downstream Sample 1 Sample 2 Namoi River mine haul road crossing Sample 1 Sample 2 Namoi River - upstream Sample 1 Sample 2 Temperature ( o C) ph Electrical conductivity (µs/cm) Dissolved oxygen (mg/l) % (86%) (90%) (102%) (98%) (105%) (94%) Turbidity (NTU) *Guidelines for the protection of aquatic ecosystems, slightly to moderately disturbed ecosystem, upland streams. Red shaded cells Exceedance of turbidity guideline value/below dissolved oxygen guideline or outside ph & electrical conductivity upper/lower limit; Green shaded cells Below turbidity guideline value/above dissolved oxygen guideline or within ph & electrical conductivity range Derived percentage saturation value using dissolved oxygen solubility values (USGS, 2012) The measured ph was within the ANZECC (2000) guidelines at each site except Namoi River- downstream, which is noted to be only slightly above guideline limits. A similar pattern was noted for electrical conductivity, with concentrations at each of the 3 sites slightly above the upper ANZECC (2000) threshold. Parsons Brinckerhoff (2010b) noted that the turbidity ( NTU) at all sites reflected the muddy nature of the water as a result of recent rainfall at the time of sampling. A number of additional water quality and quantity locations have been proposed to further establish baseline conditions and assess impacts to the local creek systems and the Namoi River as part of the BTM Complex Water Management Strategy (WMS), described in more detail in Section 6.5. The management of potential impacts to water quality during construction of the rail line and MIA expansion are addressed in the CEMP including upstream/ downstream during the construction phase (Refer to Section 6.2 for further information on the CEMP) Surface water quantity Nagero Creek Flow conditions in Nagero Creek have been periodically observed by BCPL between 2008 and present, however no recordings of flow were made during this time. This likely reflects the ephemeral and flashy nature of Nagero Creek. This has been identified as a significant data gap in order to assess baseline conditions. Options to capture flow information in Nagero Creek (including zero flow readings) are proposed going forward, and are described in Section 6.3. BCPL Page 25
33 Namoi River As discussed previously in Section 3.3, flow data has been recorded by NOW along the Namoi River at a number of gauging stations shown in Table 3-1. Examination of gauging station hydrographs for the Namoi River show peaky responses to rainfall with rapid rising and falling limbs and extended periods of no or very low flow. A number of flood assessments have been undertaken for the Namoi River for the EA and for the haul road and rail line crossing of the Namoi River. Flows in the Namoi River are heavily regulated. BCPL Page 26
34 4. Surface water management system 4.1 Objectives The key objectives of the surface water management system design for the Boggabri Coal Mine are to: segregate clean runoff, dirty runoff and contaminated water generated from rainfall events and mining operations minimise the volume of contaminated mine water (surface runoff draining to pit and groundwater seepage) generated by the Project preferentially reuse contaminated water for dust suppression and coal washing provide sufficient on-site storage to avoid releases of contaminated water that could affect the quality of downstream watercourses treat all dirty runoff from unrehabilitated overburden areas to settle coarse suspended solids maximise diversion of clean runoff to downstream creeks where practicable Erosion and sediment control measures are used to supplement the water management system. The following definitions have been adopted for the water management system elements: Clean water is defined as runoff from catchments that are not disturbed by mining operations. Dirty water is defined as runoff from disturbed areas within the mine site and includes runoff from spoil dumps, haul roads and parts of the MIA. This water contains high levels of suspended solids. Contaminated water is defined as runoff generated from coal stockpiles, the CHPP, parts of the MIA and the mining void, as well as groundwater inflows to the mining void. This water contains high levels of suspended solids and is mildly saline. Erosion and sediment control is defined as the suite of management and physical measures available to minimise the generation of soil erosion and to prevent soil and sediment entering the receiving water systems (i.e. Nagero Creek ). 4.2 Surface water management system - general General descriptions of the various elements of the surface water management system are provided in this section and should be read in conjunction with the more detailed description provided in Section 3 of the SWB. Water management system conceptual layout plans for Years 1, 2, 5, 10, 15 and 21 are provided in Appendix A. Schematic diagrams showing the general connectivity between water sources, demands and storages for Years 1, 2, 5, 10, 15 and 21 are also provided in Appendix A. BCPL Page 27
35 4.2.1 Clean water management system BCPL will maximise the diversion of clean water runoff from undisturbed catchments around the mine working area and into Nagero Creek. Clean water diversion drains at Boggabri Coal Mine will be designed to convey the peak flow rate from a 100 year ARI time of concentration storm event for the contributing catchment. Typical design features of diversion drains are as follows: trapezoidal in section 3H:1V side slopes base and sides of drains may require gypsum stabilisation where constructed in dispersive clay scour protection will be required where velocities exceed 2 m/s or diversion drains are constructed in highly erosive soil Where it is not practical to provide diversion drains, highwall dams will be provided to capture clean runoff in order to minimise inflows to the mining void. The volume of a highwall dam will be at least sufficient to contain the volume from a 100 year ARI 24 hour storm event with freeboard for the contributing catchment. In some locations it is not feasibly possible to provide diversion drains or highwall dams due to topographic conditions and advancing topsoil stripping and stockpiling. In these circumstances clean water will be allowed to enter the active mining areas and the dirty water diversion system. BCPL may have to account for the additional captured clean water and hold adequate licences or harvestable water rights. Initial discussions with NOW indicate that a surface water licence will not be required Dirty water management system Dirty water runoff will be captured in sediment dams to encourage the settling of suspended solids. These sediment dams are generally wet basins, comprising a settling zone for temporary treatment storage and a sediment zone for storage of sediment. Runoff from large storm events may overtop sediment dams and discharge to Nagero Creek. Captured water will typically be released to the creek. However, during extended dry periods water may be pumped to mine water storage dams for storage and reuse. Generally captured water is suitable for release following settling of the suspended solids, however, spoil dump runoff could potentially have elevated levels of acidity, salinity, dissolved metals and oil and grease. Sediment dams will therefore be provided with manually operated valves on the outlet pipes or alternatively consist of mobile pump out arrangements only, so that discharge to the creek can be prevented if water quality is not suitable (e.g. to allow for treatment). Dirty water diversion drains will be designed for the peak 100 year ARI time of concentration storm event for the contributing catchment. Dirty water sediment dams will be sized in accordance with the guidelines Managing Urban Stormwater Soils and Construction Volume 1 (Landcom, 2004) using a 90 th percentile 5 day rainfall total and are based on the Type F type given the local soil conditions. The Managing Urban Stormwater guidelines recommend that the settling zone be sized to capture the 90 th percentile 5 day duration storm event, and the sediment zone be sized at 50% of the settling zone volume. This sizing is based on site disturbance duration of more than 3 years and a standard receiving environment, and results in an average sediment basin overflow frequency of 2 to 4 overflows per year. For sizing purposes, runoff coefficients of 0.75 to 0.85 and 0.4 have been adopted for disturbed and undisturbed areas, respectively. BCPL Page 28
36 Discharges from the dirty water management system will be subject to EPL conditions specified in Table 6-1. For those parameters without an EPL limit, the upstream water quality site (SW2) will act as a control site. Concentrations at the downstream water quality site (SW1) will be compared against SW2 results. A 20% difference between upstream and downstream is considered an appropriate trigger to initiate further investigation to identify site activities potentially causing degradation of downstream water quality. Further discussion on this is provided in Section Additionally, for parameters not specified in an EPL, the general provisions of POEO s120 apply regarding pollution of waters Contaminated water management system Contaminated water will be captured in contaminated water sediment dams or mine water dams for storage and reuse and will not be released to Nagero Creek. The water management system will aim to reuse as much contaminated water as possible onsite, and contaminated water will be used as a priority for dust suppression and coal washing. Surplus contaminated water will be stored in-pit. Contaminated water dams are built using the best available materials so that seepage can be minimised and water is not lost. Contaminated water diversion drains will be designed for the peak 100 year ARI time of concentration storm event for the contributing catchment. The volume of a contaminated water sediment dam will be sufficient to contain the volume from a 100 year ARI 72 hour storm event with freeboard for the local contributing catchment, and an additional 20% allowance for sediment storage. Mine water dams will be sized based on water balance modelling, so as not to overflow under recorded historical climate conditions. The approved irrigation system to dispose of surplus water has not been included in this SWMP as it has not been commissioned. 4.3 Surface water management system mine plan stages This section describes the current and future surface water management systems for the Continuation of Boggabri Coal Mine Project 21 years of operation. Boggabri Coal Mine has been in operation since 2006 and the locations and extent of the pit, spoil dumps, rehabilitation zones and associated surface water management system change and evolve over time. In order to plan for the future, the mine operational plan includes a number of snapshots of the mine landform that are used for planning purposes, those relevant to this SWMP are detailed in Table 4-1. The snapshot landforms considered are Years 1, 2, 5, 10 and 21. Where components of site water management system are inadequate for mine years not explicitly referenced, commentary is provided as to the timing of the modification in the preceding mine year snapshot. BCPL Page 29
37 Table 4-1 Mine stage summary Mine stage Anticipated production rate (Mtpa product coal) Approx calendar year Relevant mine plan Year Draft MOP (November, 2013) Year Draft MOP (November, 2013) Year EA mine plan (2009) Year EA mine plan (2009) Year EA mine plan (2009) Comments Upgrades of existing MIA and CHPP. New dirty and contaminated water sediment dams in the MIA and CHPP area. Excavation of box cut. New dirty water sediment dams to cater for expanded spoil dump and clearing ahead of mining. Upgrading of existing dirty water sediment dam SD3. Water management system is generally similar to Year 1 with some change to land use in east of mine. MW3 upgraded. Addition of two dams; MW5 and SD11. Dams MW2 and SD4 decommissioned. Water management system is generally similar to Year 5 with addition of two new dirty water sediment dams SD13 and SD14. A number of new dirty water sediment dams to cater for expanded spoil dump and new clean water highwall dams to minimise pit inflows. Established rehabilitation areas are released directly to Nagero Creek Surface water management system Year 0 The Year 0 surface water system consists of a number of clean, dirty and contaminated water interception drains transferring flows into the surface water management basins. In addition rising mains allow the transfer of water between key surface water management basins. A summary of the Year 0 storage characteristics is provided in Table C1, Appendix C. These are the existing storages onsite at the beginning of calendar year A summary of the Year 0 discharge points is provided in Table D1, Appendix D. These are the existing discharge points and types listed in Section P1.3 of the EPL (licence version date 5 September 2013). Temporary in-pit mine water storage is provided to cater for surplus mine water in-pit until additional out-of-pit mine water storage is constructed onsite. The temporary storage will be a segregated void area within the advancing mining pit area. This report reflects the conditions set out on the most current EPL, however a variation to the EPL will be sought so that the and discharge points match what is proposed to be built on site and to ensure that contaminated sediment dam point types are corrected. BCPL Page 30
38 4.3.2 Surface water management system Year 1 The Year 1 water management system is provided in Figure 2 of Appendix A. A summary of the proposed Year 1 storage characteristics is provided in Table C2, Appendix C. The required minimum capacity in Table C2 is the minimum capacity required to store the design storm and the nominated sediment allowance. The existing capacity of MWDs (MW2 and MW3 and Strip 9) will be retained in Year 1 for the storage of surplus mine water during the excavation of the box cut in the north-east of the site. In future years, the box cut will become MW5, the main water storage on site. A new dirty sediment dam SD7 will cater for runoff from the disturbed surfaces of topsoil stripping in the east. A new dirty water sediment dam SD27 will also be constructed to capture the expanded overburden area in the south-west of the mine. Existing dirty water sediment dams SD1 and SD5 and existing contaminated water dam SD2 will be decommissioned as part of the MIA and CHPP upgrades. A new dirty water sediment dam SD8 will be constructed to cater for runoff from the MIA. New contaminated water dams SD10 and SD12 will cater for runoff from the coal stockpiles and CHPP area. SD12 will also have a reuse zone for storage additional water for CHPP operations as designed by CHPP designers Sedgman. A new diversion drain will divert overflows from the TCM northern waste rock emplacement area dams around the BCPL MIA. The TCM diversion drain will not interact with BCPL onsite water storage infrastructure. Catchments draining to SD3 will increase from Year 0 to Year 1 and the capacity of SD3 will be upsized to cater for runoff from the expanded overburden area in the south. A summary of the proposed Year 1 discharge points is provided in Table D2, Appendix D. SD2 (Point 2) and SD4 (Point 4) are listed in the ELP but are not present in Year 1. The EPL will be reviewed and updated in consultation with the regulators to cater for the additional discharge points proposed in the table. Although the EPL currently includes a discharge water quality point at contaminated water dam SD4 (Point 4), it is very unlikely that water stored in SD4 would meet the EPL water quality discharge criteria. As such, only wet weather discharges are proposed from SD4. BCPL Page 31
39 4.3.3 Surface water management system Year 2 A summary of the proposed Year 2 storage characteristics is provided in Table C3, Appendix C. The Year 2 storages and catchments are the same as Year 1, however the landuse changes in the east of the mine where topsoil stripping becomes covered by the unshaped spoil dump. A summary of the proposed Year 2 discharge points is provided in Table D3, Appendix D. The EPL will be reviewed and updated in consultation with the regulators to cater for the discharge points proposed in Table D Surface water management system Year 5 A summary of the proposed Year 5 storage characteristics is provided in Table C4, Appendix C. Existing mine water storage capacity will be increased to account for an additional 495ML. Existing MWD MW2 will be decommissioned (as mining disturbs this area) and a new MWD MW5 with a capacity of 1,800 ML will be commissioned to receive mine water pumped from the pit sumps. The total out-of-pit MWD storage in MW3 and MW5 will be 2,400 ML. Strip 9 will be mined through. It is expected that the proposed upgrades to the MWDs will be made by Year 3 of the Project. Water will still be stored in-pit during extreme wet weather. Contaminated water dam SD4, located at the existing rail loading facility 15 km west of the mine site, will be decommissioned once the MIA and CHPP upgrades have been completed. The contaminated water dam SD11 will be provided to cater for runoff from the Train Load Out (TLO) area and the product stockpile on the southern side of the rail loop. A summary of the proposed Year 5 discharge points is provided in Table D4, Appendix D. The EPL will be reviewed and updated in consultation with the regulators to cater for the additional discharge points proposed in Table D Surface water management system Year 10 The Year 10 water management system figure is provided in Appendix A. A summary of the proposed Year 10 storage characteristics is provided in Table C5, Appendix C. A new dirty water sediment dam SD13 will be provided to cater for runoff from the expanded spoil dump. A new dirty water sediment dam SD14 will be provided to cater for runoff from the cleared area ahead of the pit. A summary of the proposed Year 10 discharge points is provided in Table D5, Appendix D. The EPL will be reviewed and updated in consultation with the regulators to cater for the discharge points proposed in Table D Surface water management system Year 21 A summary of the proposed Year 21 storage characteristics is provided in Table C6, Appendix C. BCPL Page 32
40 New dirty water sediment dams SD19, SD20, SD21, SD22 and SD24 will be provided to cater for runoff from the expanded spoil dump. New clean water highwall dams CD5, CD6, CD7 and CD8 will be provided to minimise inflows from the natural catchment to the mining void. The highwall dams will be pumped out to the Nagero Creek system, however, they will overtop to the mining void during large storm events. A summary of the proposed Year 21 discharge points is provided in Table D6, Appendix D. The EPL will be reviewed and updated in consultation with the regulators to cater for the discharge points proposed in Table D Soil and sediment erosion control Water quality of natural and manmade water bodies can be impacted by sediment, fuels, litter, construction debris, trade waste and chemical runoff and residue. These pollution incidents may have a wide-ranging effect on the viability of the water body to support aquatic ecosystems and riparian flora and fauna. Sediment is one of the main pollutants generated at mine sites and largely arises from the erosion of exposed soils by surface water runoff. The adoption of appropriate erosion and sediment controls is essential to prevent sediment pollution of nearby watercourses. Effective erosion and sediment control for a mine requires appropriate activities to be carried out over the life of the Project including the planning and design, operations phase and closure and rehabilitation phase ( Blue Book Managing Urban Stormwater, Volume 2E: Mines and Quarries, DECC, 2008) All works will be generally in accordance with the WMP and consistent with the Blue Book - Managing Urban Stormwater, Soils and Construction, Volume 1 (Landcom, 2004) and Managing Urban Stormwater, Volume 2E: Mines and Quarries (DECC, 2008). Typical sediment and erosion control guidance has been outlined for the key stages in the Boggabri Coal Mine life as follows: Construction and operational phase typically represented by the large materials transfer (cut/fill/emplacement) with associated infrastructure, haulage, stockpiles etc. These measures will be required from the very beginning of the mine in Year 1 and continue through until the end of mining of Year 21. Closure and rehabilitation phase typically represented by the final shaping, topsoiling, and landscaping of the emplaced spoil material and final void. These measures will be required from Year 1 onwards when spoil dump areas are progressively rehabilitated and also after Year 21 during mine closure and establishment of the final landform. Maintenance and inspection required as an integral part of the above two phases to identify additional or changed risk, to instigate improvements and to ensure the continued functionality of the treatment measures. BCPL Page 33
41 4.4.1 Construction and operational phase measures As a minimum, the following management measures will be implemented by the construction and mining contractors to minimise the potential for soil erosion and to control potential sediment and pollution impacts from all construction and operation works. The construction and mining contractors will ensure the quality of any surface water leaving the site is compliant with the required limits. In this sense, the construction and mining contractors will manage and segregate clean runoff, dirty runoff and contaminated water. A system of clean water diversion drains and dams will prevent flood waters from a 100 year ARI flow event fragmenting the mine workings by diverting flows around the site. A series of dirty water drains will direct dirty runoff to sediment dams. Initial laboratory analysis of the soils has been undertaken as part of the RMP (Section of RMP) to provide basic material characterisation and enable further examination of erodibility parameters for topsoil, topsoil/mulch and overburden. It was found that topsoil materials may be prone to dispersion and amelioration of some soils may be required to reduce the erosion potential. On-going soil testing is proposed for the Soil Management Protocol (SMP) (Appendix C of RMP) and results will be used to prioritise soil management procedures based on soil types. Appropriate sediment and erosion control measures should be in place prior to surface disturbance of soils with high erodibility and dispersion properties as outlined in the RMP and SMP. Erosion control The SMP (Appendix C of RMP) identifies procedures for comprehensive soil surveys prior to topsoil stripping, assessment of top-soil and sub-soil suitability for mine rehabilitation and annual soil balances to manage soil handling including direct respreading and stockpiling. Soil stripping will involve continual evaluation of soil throughout the depths of the profile as they are exposed. Prior to stripping topsoil and subsoils, sampling will be undertaken to identify the soil resource prior to stripping, prepare a soil balance or inventory to assist with rehabilitation planning and determine if the soil requires amelioration. Current topsoil reuse and stockpile management at the site illustrates that forest topsoil contains a large amount of seeds, so topsoil stripped from each vegetation community will be used in rehabilitated areas for the corresponding vegetation community where possible. Refer to the SMP for details on topsoil stripping and handling procedures. The construction and mining contractors will implement the following general erosion controls together with procedures identified in the SMP in order to minimise soil erosion: The extent of disturbed / exposed areas is to be kept to the minimum area necessary for works. The boundary between the disturbed and undisturbed extent should be clearly marked or fenced. The subsoils should be placed in the overburden dumps in areas where they are unlikely to be exposed to rainfall or drainage for long periods of time. Stripped topsoil will be stockpiled in a stable manner. The stockpile will be stabilised to ensure that the topsoil is not dispersed and the height of stockpiles is to be restricted to 3 metres in height. Exposed areas and stockpiles may be watered to reduce the effect of wind erosion and generation of dust. BCPL Page 34
42 Soil, mulched vegetation and spoil materials will not be stockpiled within 10 metres of any gullies, waterways, paved areas or roads. Stockpile locations to be selected to minimise erosion (for example on level contained ground away from drainage lines). Long term (greater than six months) stockpiles to be stabilised by appropriate seeding or mulched vegetation where possible. Traffic movement and traffic speeds will be restricted through construction areas. Dust emissions from unsealed roads and topsoil stockpiles may be reduced by the use of water sprays. Personnel and vehicles to use designated access areas and routes only. Vehicle wash-down to be carried out in a designated area so that washings (including concrete washings) will not enter waterways or stormwater drains. No parking of plant and equipment near waterways and, where appropriate, equipment to be fitted with drip trays under engines. Disturbed areas to be rehabilitated as soon as possible following disturbance. All vegetation disturbed or removed from the site will be disposed of or stored in a location where it cannot be washed off site. Clearing of vegetation to be minimised to authorised and delineated areas only. Where approved, the width of disturbance on creek banks is to be minimised. Where feasible, understorey and ground cover vegetation to be retained in and around drainage lines. All erosion control measures are to be maintained until all earthworks and mining activities are completed and site rehabilitation is complete. Erosion and sediment control measures installed prior to the commencement of any works. All erosion and sediment control measures to be appropriately designed, sized, located and installed. Sediment and pollution control The construction and mining contractors will implement the following controls in order to minimise sedimentation and pollution: Silt fencing, or staked straw bales, or other appropriate sediment controls may be constructed down gradient of all excavation and construction works where required. Earth bunds and diversion drains will be constructed around the perimeter of the site, particularly on the upslope, of excavations to prevent surface water entering these areas. BCPL Page 35
43 Where appropriate, geotextile sediment fencing and straw bales will be constructed on the down slope of earth bunds/stockpiles to prevent sediment migration to water bodies and land. Surface waters will be prevented from entering the construction and mining areas where possible by installing diversions systems to drain surface runoff away from these areas. Stormwater runoff will be diverted around any active or rehabilitation mine areas. Stormwater runoff from stable rehabilitated areas will be diverted away from operation areas. Stabilised diversion drains to direct dirty water to sediment traps (e.g. straw bale filter, sandbag filter). Sediment retention traps will be installed and maintained to prevent sediment migration to down slope areas. Sediment control dams will be utilised to manage larger areas. All sediment control measures will be maintained until all earthwork activities are completed and the site rehabilitated. Rehabilitated areas shall be monitored periodically to check for the possible onset of soil erosion and/or weed problems. Spill control equipment including spill trailers are located for use around the site. Staff to be appropriately trained in procedures for the management of fuel and chemical spills and the location and use of spill kits. Vehicles to be well maintained to avoid fuel and oil leakages. Re-fuelling of trucks on site to take place away from drainage lines and in isolated/bunded areas to contain spills and minimise the risk of environmental contamination. Fuels, oils and chemicals required for construction and operation to be appropriately stored. Storage in open areas will be bunded to ensure any spills are contained. Any spillages to be immediately contained and absorbed with a suitable material and disposed in an approved manner. Management of emplacement reject materials Spoil and soil testing was undertaken to assess the degree of risk from acid rock drainage, leachability of metals and characterisation of standard soil parameters including salinity, sodicity, cation exchange capacity, potential nutrients and major metal compositions. The RMP identified the following key findings from the initial landform assessment: The overburden is classified as non-acid forming (<0.1% total sulphur content). The concentration of metals in overburden and potential coal reject solids is unlikely to present any environmental issues associated with revegetation and rehabilitation. BCPL Page 36
44 Most overburden materials will generate slightly alkaline and relatively low-salinity runoff and seepage following surface exposure. The concentration of dissolved metals in initial runoff and seepage from overburden materials is unlikely to present any significant issues associated with surface and groundwater quality. Grey Brown Gradational Loam, Light Brown Duplex Loam and Brown Gradational Clay subsoil/overburden materials are sodic and likely to have structural stability problems related to dispersion. These subsoils will be either gypsum treated or selectively handled and encapsulated during waste dump construction. Most potential coal reject materials are sodic and also likely to have structural stability problems related to potential dispersion. Some near surface and conglomerate overburden materials are likely to be less sodic and may be the most suitable materials for revegetation and rehabilitation activities (as a growth medium). For all other sodic overburden materials, treatment may be required to be considered for use as vegetation growth medium. Most potential coal reject materials are likely to have negligible total sulphur content and are therefore classified as NAF barren, except for a small portion of the potential coal reject materials located near the Braymont Seam, which have a relatively high total sulphur content and negligible buffering capacity and are classified as Potentially Acid Forming - High Capacity (PAF-HC). Most potential coal reject materials will generate slightly alkaline and relatively low salinity runoff and seepage following surface exposure. The exception is potential coal reject material from the Braymont seam (and potentially the Jeralong seam) where PAF materials may generate acidic and more saline runoff and seepage. The Soil and Land Resource Assessment for the Continuation of Boggabri Coal Mine Project EA (GSS Environmental 2010) stated that the potential for acid generation from regolith material (topsoil and subsoil) within the mine area is low (not including consolidated bedrock below 2-3m depth which was not assessed during the survey). Acid sulphate soils are commonly found less than 5m above sea level and there has been little history of acid generation from regolith material in the Boggabri area (GSS Environmental 2010). On-going as part of the RMP will be undertaken to identify the geochemical and physical characteristics of coal reject materials. Furthermore, prior to commissioning of the CHPP and emplacement of reject and dewatered tailings materials within the pit, a robust geochemical and emplacement plan will be prepared and incorporated into a revised management plan. Effort will be made to select samples across the breadth of the mine area, particularly those where sulphides are observed in hand specimen. Geochemical test work could include: ph, EC, Acidity, Sulphate S Sulphur speciation on solids (pyrite, sulphate and organic) Acid Neutralising Capacity (ANC) Total Organic Carbon (TOC) and BCPL Page 37
45 Net Acid Generation (NAG), if the samples are found to be low in TOC. Results of the test work can be used to quantify the potential for acid forming materials at Boggabri Closure and rehabilitation phase measures The BCPL RMP provides details on the proposed rehabilitation works adopted to achieve a stable, natural looking, vegetated and ecologically diverse post-mining landscape. The plan outlines sediment and erosion control measures for the rehabilitated spoil areas of the mine and the final landform, as summarised later in Section of this SWMP. The following erosion and sediment control management measures should be implemented, as a minimum, by the construction and mining contractors to lessen the potential for soil erosion and to control potential sediment and pollution impacts from all closure and rehabilitation works. Management strategies for topsoil stripping and handling, topsoil respreading, post disturbance regrading, and seedbed preparation are outlined in the RMP. Some of the measures listed below are recommended by the Blue Book Managing Urban Stormwater; Mines and Quarries (DECC, 2008) and others are recommendations from the soils study undertaken for the EA (GSS Environmental 2010) and the RMP but is not an exhaustive list. Erosion control post disturbance regrading will produce slopes, angles and lengths and shapes that are compatible with the proposed land use and not prone to an unacceptable rate of erosion contoured furrows or contour banks will be constructed at intervals down the slope to divide a long slope into a series of short slopes preventing runoff from reaching a depth or velocity that would cause erosion intercepted runoff will be diverted via engineering waterways using erosion blankets, ground-cover vegetation and/or rip rap to safely dispose of runoff down slope soils should be stripped in a slightly moist condition (neither too dry nor wet) thus reducing dust generation and deterioration in topsoil quality topsoil should be stockpiled only when disturbed areas are not available for immediate rehabilitation soil stockpiles should be constructed to minimise the stockpile area in a discrete 3 metre high (maximum) pile, with a working face battered down at 30 degrees stockpiles should be trimmed, deep ripped to 500 millimetres, immediately sown with permanent pasture species, and fertilised (refer to BCPL s Biodiversity Plan) Sediment and pollution control Stormwater runoff will be diverted around any active or rehabilitation mine areas. Seedbed preparation will be undertaken to ensure optimum establishment of growth and vegetation. BCPL Page 38
46 Handle topsoil at an optimum moisture content to reduce damage to soil structure this will provide a higher standard of revegetation and lower maintenance requirements. Re-spread topsoil in the reverse sequence to its removal so that the organic layer, containing any seed or vegetation, is returned to the surface. Spread topsoil at a minimum depth of 150 mm (as specified in the RMP) The SMP requires comprehensive to establish viable soils (top and subsoils) in the annual program the objective is to maximise soil (both top and subsoil) resource for rehabilitation (Refer to Section of RMP for topsoil stripping and handling procedures). Retain as much moisture as possible on the slope for maximising tree growth. Mounds will be placed every 5 m down the slope for erosion control and to plant the trees in. As part of that process the dozer rips in between the mounds to key in the topsoil. Level topsoil to an even surface, and avoid a compacted or over-smooth finish. Incorporate topsoil into the overburden or waste rock by contour cultivation with a tined implement in preparation for sowing this will leave the soil surface in a roughened condition creating a key between the soil and the spoil. Stop any vehicle traffic entering the area once topsoil is spread. Maintenance and inspection On-going maintenance/inspection will be designed and undertaken generally in accordance with the Blue Book - Managing Urban Stormwater, Soils and Construction, Volume 1 (Landcom, 2004) and Managing Urban Stormwater, Volume 2E: Mines and Quarries (DECC, 2008). Erosion and sediment management and maintenance/inspection guidance for the construction, operation, rehabilitation and closure phases are provided in Appendix E. 4.5 Post mining surface water management Rehabilitated areas The mining area will be progressively rehabilitated throughout the life of the Boggabri Coal Mine. Rehabilitated areas will be free draining to Nagero Creek following the successful rehabilitation and stabilisation of overburden emplacement areas. The final landform will be generally consistent with the surrounding environment. Details relating to quantifiable indicators for the short, medium and long term objects for soil and landform rehabilitation are outlined in Domain Completion Criteria and Progressive Soil Criteria (Refer to Appendix A of the RMP). This document outlines the rehabilitation phases, domain objectives, indicators and completion criteria for different domains. The four domains are: 1. Mine disturbance area 2. Mine infrastructure area 3. Haul road/rail spur corridor 4. Final void BCPL Page 39
47 The Domain Completion Criteria and Progressive Soil Criteria (Appendix A of RMP) contains domain closure sheets for each of the four domains. They have been developed in accordance with the recommended structure in the DII (Mineral Resources) (now Division of Resources and Energy (DRE)) Draft Rehabilitation and Management Plan Guidelines (June 2010). A number of domain objectives and completion criteria relate to water management and water quality. Refer to the detailed tables in Appendix A of RMP. The rehabilitated landform will be revegetated with a mixture of native trees and shrubs. For details regarding the potential risks to revegetation and proposed contingency measures, see Table 6-2 of the BMP (Parsons Brinckerhoff, 2012). The final land use will be predominantly native forests for conservation purposes and may include some forestry activities, that is similar to the pre-mining land use. Management of emplacement reject materials The RMP outlines that geochemical testing was undertaken to assess the degree of risk from Acid Rock Drainage. Findings from the assessment classified the overburden and majority of coal rejects as Non Acid Forming (NAF). A small proportion of potential coal reject material located near the Braymont Seam was classified as Potentially Acid Forming High Capacity (PAF) due to a relatively high total sulphur content and negligible buffering capacity. Previous geochemical assessments also indicated the existence of PAF materials associated with immediate roof and floor materials at both the Braymont and Jeralong seams. For PAF materials, the initial concentration of soluble sulphate in run-off and seepage is expected to remain within the applied water quality guideline criterion, although further exposure to oxidising conditions could lead to increased soluble sulphate concentrations. BCPL will manage PAF material through the following process: The geochemical and physical characteristics of coal reject materials will be confirmed as bulk samples become available from the CHPP; Undertake deep (in-pit) burial of identified PAF potential coal reject materials including materials from the Braymont and Jeralong seams. Specifically, burial will occur at an elevation below the predicted long term recovered water table; Undertake ongoing water quality in areas adjacent to emplacement reject materials and maintain watching brief on potential leachate generation. A number of shallow water table bores are proposed immediately downgradient of mine voids and dams to monitor the effects of potential seepage into the local groundwater system. Further details are provided in section of the GMP. Re-establishment of drainage lines BCPL have committed to proving a conceptual final landform design that will be free draining and integrate with the surrounding catchments. Initial batter slope modelling indicates that the current design of a linear batter gradient of 10 (17.5%) and lift to a height of 20 m initially constructed with diversion banks (berms), which are removed once target vegetation cover levels, are possible to provide a stable landform. Batter slopes should be sheeted with a topsoil and mulch mix to a minimum depth of 0.15m. Topsoil will be appropriately ameliorated following soil testing undertaken as part of the SMP process (Appendix C of RMP). BCPL Page 40
48 Regrading of overburden dumps has and will be undertaken to produce slopes with angles, lengths and shapes compatible with the proposed land capability classifications suitable for the proposed land use and have a low potential to erode at unacceptably high rates. The design profile and associated requirements are broadly consistent with rehabilitation techniques employed on parts of the existing rehabilitated overburden dumps. Integrated with this will be a drainage pattern which is capable of conveying runoff from the newly created catchments and integrates with surrounding catchments by sheeting water towards natural drainage lines of associated ephemeral creeks. Reinstatement of drainage lines on the rehabilitated areas of the site will be undertaken in accordance with Guidelines for Establishing Drainage Lines on Rehabilitated Minesites (Draft) (DLWC, 1999) and will be based on the existing topography and natural drainage present before the mine. All soil conservation and erosion control drainage structures (viz. graded banks, chutes and flumes) will be designed in accordance with SCS Technical Handbook No. 5, Design Manual for Soil Conservation Works. All sediment and/or pollution control facilities will be designed in accordance with Volume 1 and Volume 2E of Managing Urban Stormwater: Soils and Construction (Landcom 2004 and DECC 2008). Approximately 52 ha of riverine woodland are proposed to be rehabilitated within the existing and proposed drainage lines in the final landform (See Figure 6.1 in RMP). Current rehabilitation trials have rip and mound formations which result in the ponding of water, especially at the site of the 2011 plantings. Avoiding concentration of flow and the ponding of water on the edge of the landform (diversion channels) and amelioration with gypsum will address this issue. This will reduce the amount and velocity of run-off and increase the amount of water available to plants. Additional stabilisation works will be undertaken as required and may include reshaping, the installation of grade stabilisation structures, and amelioration of dispersive soil, revegetation, fencing and de-silting. Stabilisation works are inspected annually as part of the annual rehabilitation inspection and some of the works will be formally monitored as part of the formal rehabilitation program. Sediment basins will remain operational until 70% soil surface cover the rehabilitation completion criteria is achieved to encourage the settling of suspended solids prior to the release of water to Nagero Creek the associated ephemeral creek. Temporary erosion and sediment control measures will be required while rehabilitation is establishing (e.g. contour banks, contour ripping, graded banks, erosion blankets, ground-cover vegetation, rip-rap). Sediment basins on emplacements will be removed once rehabilitation has established. Further investigation is required for the longer term management of landforms and to better inform landform design, using landform evolution simulations to assess time long-term impact of diversion channels. Pollution control The quality of runoff from rehabilitated areas is expected to be similar to pre mining water quality conditions. Based on the conclusions of the geochemical assessment (RGS, 2009), leachate generated from overburden and coal reject materials is unlikely to significantly impact surface water quality downstream of the site, if these materials are managed correctly. BCPL Page 41
49 4.5.2 Final void Schedule 3, Condition 72 of the Project Approval requires the preparation of a Final Void and Mine Closure Plan (as a component of the overall RMP required under condition 71 of Schedule 3) to the satisfaction of the Executive Director, Mineral Resources in DRE. This plan is to be completed by the end of December The SWMP will be updated as necessary following preparation of the Final Void and Mine Closure Plan. The RMP, (Parsons Brinckerhoff, 2013a) outlines the general design objectives and management of final voids. The final void will be in the northern section of the Boggabri Coal Mine. BCPL have generally committed to reshaping the high wall to ensure it is safe, stable, non-erosive and revegetated as is practical. The long term stability of a high wall can be affected by a number of factors which are described in the RMP (Section , Parsons Brinckerhoff, 2013a). A final landform for the high wall will be developed following assessment by geotechnical and erosion specialists. BCPL has committed to back fill the final void to RL 28 to ensure the final void does not remain a groundwater sink in the landscape. Rehabilitation design objectives from the project approval are shown in Table 4-2 below. Table 4-2 Rehabilitation design objectives Feature Mine site (as a whole), including the final void Surface infrastructure Other land Objective Safe, stable and non-polluting Minimise the size and depth of the final void as far as is reasonable and feasible and ensure that the void contains no retained surface water (i.e. no pit lake) To be decommissioned and removed, unless the Executive Director, Mineral Resources in DRE agrees otherwise Restore ecosystem function, including maintaining or establishing self-sustaining ecosystems comprised of: Local native plant species (the Executive Director, Mineral Resources in DRE agrees otherwise); and a landform consistent with the surrounding environment Community Ensure public safety Minimise the adverse socio-economic effects associated with mine closer The RMP outlines that laboratory analysis has been undertaken to provide a basic material characterisation to enable further examination of erodibility parameters for three common materials including topsoil, topsoil/mulch and overburden. The WEPP model has been used to assess interactions between slope height and gradient for all three materials supplied (refer to Conceptual Landform Interim Report (Appendix D of RMP)). A water balance assessment will be undertaken to determine long term water levels in the final void and any potential for overtopping or seepage from the final void. Additional erosion and geotechnical assessment of the highwall will be undertaken to determine a highwall design that provides a rate of scarp retreat equivalent to natural scarp retreat rates in the surrounding environment. BCPL Page 42
50 Soil sampling will be undertaken as outlined in the SMP (Appendix C of RMP). On-going validation and revision of surface and groundwater models as proposed in Section 8.2 of this SWMP and Section 6 of the SWB will provide information to support the final void plan. Further information regarding the final landform description can be found in Section 5.2 of the RMP (Parsons Brinckerhoff, 2013a). BCPL Page 43
51 5. Haul road and Boggabri rail spur line Schedule 3, Condition 37 of the state Project Approval requires that, before construction of the rail spur line or any upgrades to the haul road, the Proponent will undertake a flood assessment of the detailed design to confirm minimal impacts as predicted in the EA. This must include assessment of impacts of the rail spur line embankment and proposed design of stormwater culverts along the rail spur line to the Namoi River to assess changes to localised flood impacts within the Nagero Creek catchment and adjoining Bollol Creek catchment. 5.1 Assessment outline Aurecon (2013) carried out a drainage, hydrology and hydraulic assessment for the Boggabri Maules Creek Rail (BMCR) project which is approximately 30km of track with three distinct sections of rail for Boggabri Coal Mine arm, Maules Creek Coal Mine arm and the common shared track. The assessment focused on the Nagero Creek elbow, interface with Bollol Creek, Boggabri loop, cross drainage and long drainage, haul road and proposed track access roads to the track (refer to Figures 12a-12e in Appendix A for flood assessment study area). The study relied on previous flood assessment Namoi River Flood Study for the Proposed Maules Creek Mine (PB, 2011) to determine flooding impacts from the viaduct crossing on the Namoi River. The flood assessment was undertaken using a number of hydrologic and hydraulic software packages (HEC-RAS, MIKE21, XP-RAFTS) to assess changes to existing flood levels (afflux) upstream and downstream of the rail line. Triggers for flood warning are proposed in section Impacts to Nagero Creek The assessment of Nagero Creek elbow concluded that upstream afflux occurs due to the proposed BMCR formation encroaching on the Nagero Creek flood extents but with a residual afflux of less than 20 mm observed at the boundary of the model which is approximately 50 upstream of the rail embankment at the elbow. The following hydraulic observations were made: It is estimated that the residual afflux at the nearest property that has been advised as sensitive to project impacts is approximately 8 mm. The magnitude of residual afflux is of the same order as the minimal hydraulic impacts accepted along the Namoi River in the Environmental Assessment; The minimal afflux experience as a consequence of the works will ensure there is minimal impact on upstream flood conditions, including any over topping to the Bollol Creek catchment in higher storm events. 5.3 Impacts to Bollol Creek The Ministers Conditions of Approval Schedule 3 Condition 37 requires assessing changes to localised flood impacts within the Nagero Creek catchment and the adjoining Bollol Creek catchment. BCPL Page 44
52 The Bollol Creek catchment is located to the south of the Nagero Creek catchment, as shown in Figure 12a of Appendix A. The Environmental Approval states that the Nagero Creek currently overtops its floodplain into the Bollol Creek only in high flow events and that this will reduce throughout the duration of the project. Additional information was also sought from the NSW Office of Water and the advice received was that the NSW Office of Water has no record of Bollol Creek flooding in the area of the works. No allowance for inflow from the Bollol Creek catchment into the Nagero Creek catchment has been included within the flood model for the Nagero Creek elbow. The flood model of the Nagero Creek elbow showed the proposed railway will cause minimal impact within the Nagero Creek catchment with a predicted afflux of 3m at the point of encroachment and reduces to 2m at the upstream extent of the model (refer to Section 6.1.2), approximately 40 from the encroachment. The upstream interface between the Bollol Creek catchment and the Nagero Creek catchment is approximately 7km from the encroachment. The impact on flood conditions in the upper reaches of the Nagero Creek, including the point where the Bollol Creek is likely to overtop, will be negligible due to the limited afflux experience at the Nagero Creek elbow which is immediately upstream of the proposed railway works. Therefore any overtopping of flows from Nagero Creek to Bollol Creek is likely due to natural changes in hydrology and flooding and not caused by the mine or rail spur line. Triggers for flood warning in the Nagero and Bollol catchments will be proposed in Section BCPL Page 45
53 6. Surface water program The aim of the surface water program is to evaluate the effectiveness of BCPL s water management systems, to assist in detecting any significant off-site impacts as a result of mining and to trigger the response plan to prevent any adverse impacts or minimise potential adverse impacts. This section outlines the requirements to ensure the effective implementation of this SWMP including the compliance criteria based on the EPL. BCPL is accountable for environmental throughout the mine operations. 6.1 EPL compliance criteria EPL sets concentration limits for pollutants discharged from sediment dams at Points 1, 2, 3, 4, 40 and 46 (SD6, SD2, SD3, SD4, SD23 and discharge to waters (Table 6-1)). The most recent variation of the EPL is dated 5 September 2013 and has been used as the basis for the locations and frequencies in this SWMP. This report reflects the conditions set out on the most current EPL, however a variation to the EPL will be sought so that the and discharge points match what is proposed to be built on site and to ensure that contaminated sediment dam point types are corrected or removed and new dams to be added to the EPL. Table 6-1 lists the concentration limits set in EPL for discharge to Nagero Creek. Table 6-1 EPL concentration limits for discharge to surface water Pollutant Unit of measure 50 th percentile concentration limit 90 th percentile concentration limit Oil & Grease mg/l ph Total suspended solids mg/l th percentile concentration limit EPL allows total suspended solids (TSS) concentration limits specified for Points 1, 3, 4, 40 and 46 (SD6, SD2, SD3, SD4, SD23 and discharge to waters) to be exceeded for water discharged provided that: the discharge occurs solely as a result of rainfall measured at the premises that exceeds 38.4 mm over any consecutive 5 day period immediately prior to the discharge occurring all practical measures have been implemented to dewater all sediment dams within 5 days of rainfall such that they have sufficient capacity to store runoff from a 38.4 mm 5 day rainfall event. Note that 38.4 mm equates to the 5 day 90 th percentile rainfall depth for Gunnedah sourced from Table 6.3a of the Managing Urban Stormwater: Soils and Construction Volume 1: 4th edition (Landcom, 2004). EPL requires water quality testing to be undertaken downstream of the surface water management system; however the testing of water quality within the water management BCPL Page 46
54 element (i.e. sediment dam) prior to release would be a more practical control for field staff. BCPL has two handheld water quality meters on-site and rapid field testing of the water management system is possible for the following parameters to act as an early warning tool for non-compliant releases: Electrical conductivity Oil and grease (presence / absence of surface films) ph Turbidity (as a surrogate for TSS) A turbidity-tss relationship would need to be developed by conducting a verification study (i.e. simultaneous determination of both parameters followed by regression to an appropriate correlation coefficient as agreed with the EPA) in order to enable customised turbidity limits to be derived, based on the TSS values in Table 6-1. Until this time, TSS determination would be required. Discharge criteria for new sediment dams under wet weather conditions will require further discussion with the EPA. Sections 6.2 and 6.3 set out the surface water quality and quantity programs respectively. The programs for Year 1 of mining have been included in these sections; see Appendix D for tables of proposed locations for Years 2, 5, 10 and Water quality The EPL specifies the surface water quality requirements for BCPL include event based, ambient based and frequency based of Nagero Creek. The EPL also includes the concentration limits for water discharged from the site at licensed discharge points. All data needs to be recorded in a systematic manner as discussed in Section 6.2. The event, ambient, and frequency based programs are outlined in the following sections Event based and ambient based Event based is defined as undertaken within the site water management system in response to a controlled discharge such as the release of water from sediment dams, an uncontrolled discharge such as spilling from a dam during wet weather or a unique discharge event such as an emergency discharge resulting from a water surplus. Event based includes both water quality and inspection of water levels in the sediment dams. This is intended to confirm that the discharges comply with the compliance criteria set out in the EPL. Ambient based is defined as undertaken outside the site water management system, in an area not affected by mine operations, within the existing creek lines, to establish baseline water quality conditions under a range of flow events and quantify inherent temporal and spatial variation within the environment. Ambient will be event based, which means is triggered by an event rather than sampling at set periods. BCPL Page 47
55 By carrying out event based ambient based and surface water quality both within the site and around the site may be tracked, potential impacts identified and appropriate management measures employed as necessary. The surface water system event based and ambient based sampling locations, trigger events, frequency and required testing parameters are summarised in Table 6-2. Refer to figures in Appendix A for the site layout, points and dam locations. The existing program should be extended, in consultation with agency bodies, to include new sediment dams and mine water storages as appropriate. Each location included in event based and ambient based should be sampled for test suite A. Details on the testing suite are provided in Table 6-4. Table 6-2 Event based and ambient based summary Year 1 EPL Point Location Location description Type of Frequency Test suite Sampling method Point 1 SD6 Nagero Dam Wet weather discharge Discharge water quality As soon as practicable at the commencement of a wet weather discharge A Grab sample with conductivity and ph in situ Point 3 SD3 South west corner of spoil dump Wet weather discharge Discharge water quality As soon as practicable at the commencement of a wet weather discharge A Grab sample with conductivity and ph in situ Point 4 SD4 Sediment dam at rail load out area, west of mine site Wet weather discharge Discharge water quality As soon as practicable at the commencement of a wet weather discharge A Grab sample with conductivity and ph in situ Point 40 SD23 Topsoil stockpile Wet weather discharge Discharge water quality As soon as practicable at the commencement of a wet weather discharge A Grab sample with conductivity and ph in situ Point 5 SW1 Nagero Creek Downstream of mining Rainfall event sufficient to generate flow in Nagero Creek As soon as practicable during or following a rainfall event sufficient to generate flow in Nagero Creek A Grab sample with conductivity and ph in situ Point 6 SW2 Nagero Creek Upstream of mining Rainfall event sufficient to generate flow in Nagero Creek As soon as practicable during or following a rainfall event sufficient to generate flow in Nagero Creek A Grab sample with conductivity and ph in situ Point 46 See EPL Outlet from sediment basins Discharge to waters Discharge water quality As soon as practicable at the commencement of a wet weather discharge A Grab sample with conductivity and ph in situ TBD Clean water Clean water diversion Rainfall event sufficient to As soon as practicable during A Grab sample with BCPL Page 48
56 drain along Southern border around southern end of site, downstream of haul road crossing generate flow in the clean water diversion or following a rainfall event sufficient to generate flow in the clean water diversion conductivity and ph in situ Notes: *SD2 does not exist on site anymore (point 2 has been removed from this table *EPL Point licensed discharge point. *Wet Weather Discharge An uncontrolled spill event from a dam as a result of excessive rainfall (i.e. typically via the emergency spillway). *Discharge Water Quality A controlled discharge event from a dam (i.e. draw-down of a sediment dam after suitable settlement has occurred). Ongoing ambient based quality should be undertaken for a minimum period of 6 months and up to 2 years to improve the baseline dataset for Nagero Creek under a range of flow and seasonal conditions. Trends in the data can then be identified and may aid future management strategies, including those relating to site discharges. An assessment of how representative and variable the collected data is will be undertaken after 6 months and a decision made on the need for further data by an appropriately trained employee or contractor. A similar approach will be taken for surface water quantity, outlined in Section 6.3. Monitoring upstream of the site at location SW2 will be undertaken until Year 5, after which time this location will be disturbed by mining. However, by Year 5 sufficient data (i.e. more than 2 years of data) from SW2 will be available to establish baseline water quality. An alternative upstream location on Nagero Creek or hydrologically and geomorphologically similar adjacent creek will be identified as part of the geomorphology survey as a replacement control site (see Section 6.4). In addition to the program set out in Table 6-2, visual assessment of the clean water diversions will be carried out at the same time as event based and ambient based (i.e. at the commencement of a wet weather discharge and/or during or following a rainfall event sufficient to generate flow in the clean water diversions) to inspect the condition of the drains. Required maintenance or repair works will be identified through these inspections to ensure the diversion drains are not generating sediment during storm events. While a small portion of the lease area is contained within the Bollol catchment, the mine plan ensures that the Project will not affect flows in Bollol Creek due to topographic conditions. No discharges are proposed to Bollol Creek and therefore no surface water quality of Bollol Creek is proposed for Boggabri Coal Mine. The CEMP outlines management strategies that should be followed to minimise potential impacts to water quality during construction of the rail line and MIA expansion. Section 5 of the approved CEMP proposes BCPL undertake water quality adjacent to areas of construction in BCPL s MIA. While compliance with EPL criteria remains the responsibility of BCPL, the CEMP requires Contractors to also undertake their own due diligence water quality for the duration of the construction phase. At a minimum, Contractors will monitor and confirm water quality of all sediment dams and advise the BCEP Environmental Representative of compliance with EPL criteria, prior to treated water being pumped offsite. While the construction of approved infrastructure on the Namoi River Flood Plain has been assessed as having no significant impact on river levels or river bank erosions there are a number of potential controls that will be implemented by the Contractor during construction of this infrastructure. Refer to the CEMP document for specific details relating to management of impacts during construction. BCPL Page 49
57 6.2.2 Frequency based Frequency based is defined as that undertaken within the site water management system on a periodic basis (i.e. quarterly). This is intended to confirm the water quality status of elements within the surface water management system so that changes to systems and management can be implemented where systematic problems are identified. Frequency based will be undertaken in addition to event based and ambient based to comprehensively track the surface water quality, both within and around the site, as outlined in the EPL conditions. The surface water system frequency based sampling locations, trigger event, frequency and required testing parameters are summarised in Table 6-3. Details on the testing parameters are provided in Table 6-4. Refer to Appendix A for the site layout, points and dam locations. Table 6-3 Frequency based summary Year 1 EPL Point Location Location description Point 19 MW2 North of pit void Point 20 Pit void Pit void Point 36 SD6 Nagero Dam Point 38 Point 39 SD3 SD4 South west corner of spoil dump Rail loop 15 km west of mine site Point 41 MW3 South of MIA Point 42 SD23 Topsoil stockpile Type of Frequency Test suite Surface water quality Surface water quality Surface water quality Surface water quality Surface water quality Surface water quality Surface water quality Notes: *SD2 does not exist on site anymore (point 2has been removed from this table * EPL Point licensed discharge point Sampling and analytical methods Analytical suites Quarterly Quarterly Quarterly Quarterly Quarterly Quarterly Quarterly EPL specifies the pollutants to be analysed for water samples from the event based, ambient and frequency based requirements. These tests have been identified as two suites as outlined in Table 6-4. Table 6-4 Water quality testing suites B B B B B B B Test Suite A B Determinants Conductivity, nitrate, nitrogen (total), oil and grease, ph, phosphorus (total), reactive phosphorus, total suspended solids (TSS), arsenic, cadmium, chromium, copper, lead, nickel, zinc, iron Conductivity, ph, arsenic, cadmium, chromium, copper, lead, nickel, zinc, iron BCPL Page 50
58 The dissolved metals listed in Table 6-4 are to be monitored as proposed in the EA until deemed not significant. This would involve comparison to both the trigger values listed in Table 7-1 and the concentrations detected at the control site on an annual basis and removal from the test suite should be following agreement with the EPA Sampling methods Monitoring and sampling will be undertaken in accordance with the following guidelines: National Water Quality Management Strategy: Australian Guidelines for Water Quality Monitoring and Reporting (ANZECC & ARMCANZ, 2000) Approved Methods for the Sampling and Analysis of Water Pollutants in NSW (NSW, 2004) Details on methods to be adopted for the program are set out in Appendix F Quality assurance and control The following actions will be undertaken as part of the quality control process: All samples and water quality measurements will be collected by a suitably trained employee or contractor (personnel with experience in best practice sampling methods and storage/ handling techniques). Quality control samples such as duplicates and field blanks will be taken at regular intervals. As a minimum, one duplicate and one field blank will be collected for 10% of the sampling program. As far as possible, all samples will be delivered to the laboratory within the maximum holding time. All collected samples will be analysed by a National Association of Testing Authorities (NATA) accredited laboratory. All site-equipment will be maintained and calibrated as per the manufacturer recommendations and by a person possessing appropriate experience and qualification Compilation of results data A written (electronic) record must be kept of all data for compliance with statutory requirements, trend analysis and input into reporting. Pro forma sheets will be used to maintain consistent and relevant records on file, with a clear audit trial. This will ensure that records are clearly accessible to site management and are traceable in the case of staff changes. Staff will be required to sign-off from the responsible parties identified in the SWMP. See Appendix G for proforma sheets to be filled out for all and reporting sites. Management of the results data remains the responsibility of the BCPL Environment Superintendent. BCPL Page 51
59 6.3 Water quantity Water quantity (flow) will be undertaken in Nagero Creek as part of the ambient. Flow is required to be undertaken in order to: Obtain a baseline of hydrologic conditions in Nagero Creek from which potential impacts due to operation of the mine may be assessed Provide information on the flow conditions at the time each water quality sample is taken so trends in quality may be interpreted Allow validation of surface water modelling. Water level readings will be recorded with an automatic datalogger (after installation of a stage board) at SW1 and SW2 and utilised to estimate flows. In this way water level in the creek will be recorded as a regular time series which can be converted to flow estimates using a site-specific stage-discharge relationship. This equipment will capture data during all flow conditions, ranging from no flow to high flow. The number of samples classified in each type of flow event can then be evaluated which can be used as a guide for the sampler about the timing of future sampling events. An equal distribution of sample events over the different flow conditions is desirable. Each datalogger should be set to record water levels with an hourly frequency as a minimum so that high flow peaks passing through the system can be picked up. The dataloggers will then be downloaded during each ambient based round, or after six months, whichever is shorter. Memory allocation in loggers for hourly frequency collection should last at least one year. Further details on the flow are provided in Appendix H. 6.4 Geomorphology A baseline geomorphology survey will be carried out and will include a rapid walkover assessment following the RiverStyles TM approach (Thompson et al. 2001), undertaken with the initial ambient based and repeated on an annual basis by suitably trained personnel (personnel with knowledge/experience in geomorphology assessments). This rapid survey will characterise the Nagero Creek bed, bank and riparian zone geomorphological conditions by completion of the following tasks: Populate RiverStyles TM type template Cross-sectional profile measurements (upstream and downstream) Geomorphology summary map Bank stability assessment The survey will be carried out at 5 key locations both upstream and downstream of the Project area, covering a representative 100 m long reach of the creek. BCPL Page 52
60 6.5 Stream and riparian vegetation health The main requirement for the stream and riparian vegetation health is to detect change from the baseline condition, and to separate the effects (if any) of mining activities (which will trigger a response plan to prevent any adverse impacts or minimise potential adverse impacts) from those effects that are due to natural spatial and temporal variability. Statistically designed comparison of impact and control sites over an adequate timescale will be undertaken based on the Beyond-BACI design of Underwood (1992) or similar. The impact sites for stream and riparian vegetation health, Nagero Creek and the Namoi River, will be compared against multiple reference streams and river reaches that will serve as controls. The reference sites will be selected by finding the nearest stream/riparian reach that matches Nagero Creek and the Namoi River (as closely as possible) in condition. This will allow for paired comparisons with the reference sites to be made that will indicate changes in the riparian zones over time relative to the background environmental conditions (i.e. changes due to climate, precipitation, hydrologic variability, etc.). Stream and riparian health will be undertaken on an annual basis by appropriately trained personnel with knowledge/experience in vegetation Riparian vegetation health Rapid appraisals of environmental condition will be used based on surrogate indicators of stream and riparian vegetation health to detect trends over time. Specifically, the Rapid Appraisal of Riparian Condition (RARC) method (Jansen et al. 2005) will be used. Using the RARC method, four transects (10 metres wide; perpendicular to the direction of river flow) are evenly spaced along the bank and the following parameters are recorded within each transect on a RARC scoring sheet: channel width and width of the riparian canopy vegetation (on the side of the river being assessed) percentage vegetation cover within each layer (ground cover lichens, mosses, grasses, herbs, reeds and sedges to 1 metre tall; understorey herbs, reeds, shrubs and saplings 1 5 metres tall; canopy trees > 5 metres tall) percentage covers of native species in each vegetation layer the number of vegetation layers percentage leaf litter cover on the ground and the percentage cover which is of native species presence of standing dead trees (>20 cm dbh) abundance of fallen logs (>10 cm in diameter) abundance of native canopy species seedlings (< 1 metre tall) grazing damage to canopy species seedlings abundance of native shrub regeneration BCPL Page 53

61 presence of reeds. Sites should be at least 200 m long, with 500 m being the preferred length (where practicable). The length of transects at each site will be determined by the width of the river channel, but will likely be 40 m long for Nagero Creek and larger for the Namoi River. The Figure below illustrates a hypothetical stream with the proposed layout of the survey area and the transects. Figure 6.1 Example riparian sample site layout (Jansen et al. 2005) Photographs should be taken, as a minimum, at each of the transect sites. Permanent photo points provide an important visual representation of conditions at a given point in time and are an effective way of showing relative change in condition over time. A permanent marker, such as a steel post, should be placed at each photo point. Photographs should also be taken from the side of the stream, upstream and downstream, to show important characteristics Analysis of riparian vegetation data Using the RARC method (Jansen et al. 2005), the data recorded on the indicators during the RARC surveys will be averaged across transects within a site, and then summed into subindices. The final index score will then be a weighted sum (each sub-index is divided by its maximum possible total and multiplied by 10) of the sub-indices, with a possible maximum of 50 indicating best condition. The index scores will be categorised (e.g. less than 25 very poor, poor, average, good and more than 40 excellent) (Jansen et al. 2005) Aquatic macroinvertebrate The Australian River Assessment System (AusRivAS) uses riverine aquatic macroinvertebrate data to provide information about river health using nationally standardised methods and analysis protocols. In addition to AusRivAS, it is recommended that the biotic index Stream Invertebrate Grade Number - Average Level (SIGNAL - an index of water pollution based on tolerance or intolerance of biota to pollution) be used in analysis. The SIGNAL biotic index is used to assign average pollution sensitivity grades using macroinvertebrate data. SIGNAL values range from 1 (most tolerant to pollution) to 10 (most sensitive to pollution). Average SIGNAL values greater than 6 indicate clean water, while between 5 to 6 the water quality is doubtful or mildly polluted. SIGNAL values between 4 and 5 indicate moderate pollution, while a value less than 4 indicates severe pollution. Macro-invertebrate communities within ephemeral waterways (such as Nagero Creek ) are highly variable over time, with community structure strongly linked to flow conditions. As such, AusRivAS assessment and SIGNAL analysis will only be possible for Nagero Creek BCPL Page 54
62 during periods of high rainfall when the ephemeral stream flows. Therefore, AusRivAS assessment and SIGNAL analysis will be restricted to the Namoi River and undertaken opportunistically when Nagero Creek flows. During each survey event, macro-invertebrate communities will be sampled at each site in accordance with the protocols outlined the New South Wales AusRivAS sampling and process manual (Turak et al. 2004). 6.6 Tree root depth analysis and GDE To satisfy SEWPaC condition number 17, the depth of the root zone of native vegetation will be examined via a localised tree root depth study undertaken using replicate samples within each of the broad vegetation types identified in the study area. This study will provide site specific local data on tree root depths and validate literature based assessments of the likely root depths of local vegetation. Ground-penetrating radar (GPR) can be used to noninvasively establish three dimensional subsurface structural root layouts of trees and create detailed morphology maps. The use of GPR is an established inspection method that has been shown to successfully locate tree roots noninvasively in forest soils (see Hruska et al. 1999; Butnor et. al. 2003; Bassuk et al. 2011). To monitor and assess the ongoing quality and quantity of groundwater to identify impacts on the native vegetation, a GDE survey will be conducted in conjunction with the tree root depth study, and in accordance with the GMP. The GDE study will include a floristic and vegetative health assessment for replicate sites in each of the potential GDE vegetation types in the study area (i.e. Melaleuca sp. and River Red Gum communities). These floristic locations will be paired with shallow groundwater bores to identify any potential correlation between vegetation health and depth to water. 6.7 Proposed additional sites A number of additional water quality and quantity locations have been proposed to further establish baseline conditions and assess impacts to the local creek systems and the Namoi River as part of the BTM Complex Water Management Strategy (WMS) (Parsons Brinckerhoff, 2013b). The purpose of the WMS is to document the approach that mines within the Boggabri-Tarrawonga-Maules Creek Complex will take to monitor and collectively manage the surface water and groundwater impacts of their operations. The WMS is intended to work in parallel with this SWMP. The purpose of the strategy in terms of surface water is to monitor flow and water quality upstream and downstream of each mine, so that baseline conditions can be established and any changes to surface water at the mine lease boundaries can be recorded for accountability purposes. The WMS proposes points for assessing cumulative impacts, and are listed in Table 5.3 (WMS document). Some of these sites (e.g. SW1, SW2) are part of BCPL s existing network outlined in Section 6.2 and 6.3. Results from any new sites will be presented in each Annual Environmental Management Report and used to inform any future surface water modelling Surface water modelling Separate hydrologic and hydraulic modelling has been undertaken as part of the Environmental Assessment for Boggabri Coal Mine, Maules Creek Mine and Tarrawonga Coal Mine. The BTM Complex WMS recommends that further hydraulic modelling will be BCPL Page 55
63 carried out using additional survey data, to model the hydraulic characteristics of local creek systems to provide a more accurate baseline characterisation of existing conditions. Refer to Section 4 of the BTM Complex WMS for further information on modelling undertaken for the EA for each of the three mines. No additional surface water modelling has been carried out as part of this SWMP. BCPL Page 56

64 7. Trigger levels and management responses 7.1 Trigger levels Nagero Creek ambient Trigger level development ANZECC (2000) recommends that, wherever possible, site-specific data is used to determine customised trigger values for physical and chemical factors which can adversely impact the environment. The approach recommended by ANZECC (2000) for developing site-specific trigger values for slightly to moderately disturbed ecosystems is to formulate trigger values based on the 80 th percentile of the site-specific baseline data as outlined in Figure 7.1. Figure 7.1 Criteria for defining site performance criteria BCPL Page 57
65 However baseline data records of suitable length are not available for Nagero Creek to enable a meaningful statistical analysis to be undertaken for trigger levels. Therefore interim trigger levels will be adopted as outlined in Section As additional ambient water quality modelling is undertaken over the Project life, the preparation of site specific trigger levels may become feasible Interim trigger levels In the absence of suitable baseline data, the approach recommended by ANZECC (2000) is to develop trigger values based on the ANZECC (2000) default guidelines. However, this approach is considered inappropriate for Nagero Creek because the ambient water quality exceeds some of the guidelines. Nagero Creek is also an ephemeral stream which imparts very specific chemical behaviour on the water. As an interim measure, preliminary trigger levels therefore will be based on the greater of the following two concentrations: 1. The least stringent ANZECC (2000) guideline value for the protection of EVs (discussed in Section 2.3.2); or 2. The 80 th percentile value of the (limited) ambient results collected at SW2. Trigger levels will be updated once additional ambient data is collected. This will be modified by an additional trigger check that compares the upstream (SW2) and downstream (SW1) parameter for a variance that exceeds a nominal 20%. The intent of the variance check is to ensure trigger events occur where significant changes in water chemistry are evident over a short section of the creek line even though the actual stated parameter may be exceeded. The level/concentration of a parameter monitored at the location indicated in Table 6-2 must be within the limits specified for that parameter in Table 7.1. BCPL Page 58
66 Table 7-1 Receiving environment interim trigger levels Analyte/ Parameter Unit ANZECC (2000) guideline 80 th percentile (SW2) Trigger ph a Electrical conductivity µs/cm 350 a Suspended solids mg/l 40 b Total nitrogen as N mg/l 0.25 a Total phosphorus as P mg/l 0.02 a Oil and grease mg/l Not noticeable Not noticeable Not noticeable Nitrate mg/l 0.7 a Reactive phosphorus mg/l a Arsenic mg/l a Cadmium mg/l a < Chromium mg/l a < Copper mg/l a Lead mg/l a Nickel mg/l a Zinc mg/l b Iron mg/l 10 c a: ANZECC (2000) guideline for the protection of aquatic ecosystems, slightly to moderately disturbed ecosystem, upland streams. b: ANZECC (2000) guideline for aquatic foods. c: ANZECC (2000) guideline for irrigation water (short term) ND no data *daily was undertaken for the period of 16 th to 29 th February for February 2012 and 1 st to 28 th March for March 2012, so average values have been displayed in the table above. For the average dissolved metals calculation, where recordings have been reported as less than, the value has been havled so that averages could be calculated. For dissolved metals, 80 th percentile values have been calculated from the 42 daily data points recorded in February and March Refer to Appendix B for the raw data. BCPL Page 59
67 7.1.2 Nagero Creek event Controlled discharge or wet weather discharge can occur from licensed discharge points in the water management system. These discharges must comply with the concentration limits for pollutants specified in EPL as shown in Table 6-1. Trigger levels for discharge events to Nagero Creek will be based on the 100 th percentile concentration limit as shown in Table Flooding impacts along haul road and rail spur The trigger for a response to potential downstream flooding impacts should be based on a combination of weather conditions, flood warnings, rainfall gauges and upstream flow/water level gauges along the Namoi River. In the first instance, BCPL will check if a flood warning for the Namoi River has been issued by the Bureau of Meteorology (BoM) warning system ( This website is the first place to check of any flood warnings in place and if a significant event is predicted. If the BoM has issued a flood warning then weather forecasts and upstream stations should be checked. The nearest rainfall station to the site is at Boggabri Post Office (055007), and upstream NOW flow gauging stations on the Namoi River are located upstream at Boggabri (419012) and upstream at Gunnedah (419001). If weather conditions and /gauging stations show that the flooding impacts could be significant, then a management response is required. Appendix I shows the flooding response and communication protocol which should be followed and whether a response action is required. At a localised scale, if flood risk is suspected on the Nagero Creek floodplain local landholders should be informed immediately. The trigger for localised events may be when there are a number of controlled releases from multiple sediment dams at the same time or when there is an uncontrolled release event. Local landholders should also be informed of imminent increases in flow during the event based program. Flow data at SW1 and SW2 will also be scrutinised during the lifetime of the mine in order to discern any changes in flow at SW2 that are not mirrored by changes in flow at SW1. It is possible to estimate the flow in Nagero Creek that corresponds to when the creek overtops it banks using the water level/ flow data recorded at SW2 and the stage-discharge rating curve.. These records will be used to inform the timing of future warnings to local landholders in relation to both heavy rainfall events and releases from sediment dams. This will be communicated via the annual report. As shown in the communication protocol, if flooding impacts pose a threat to downstream properties and occupiers, the Environment Superintendent will notify those likely to be affected. A list of contact details for nearby residents are maintained by BCPL Stream and riparian health The trigger for a response to degradation in stream and riparian health should be based on the results of the riparian vegetation (RARC scores) and macroinvertebrate (AusRivAS and SIGNAL analysis). If the condition of riparian vegetation and/or aquatic macroinvertebrate communities is identified to be declining significantly (as identified by statistical analysis) during the period as compared to the condition of the control sites, BCPL will implement mitigation and management measures designed to improve riparian vegetation and aquatic habitat quality. BCPL Page 60
68 If during the period riparian habitat quality is determined to be declining (as compared to control sites), rehabilitation and restoration activities are to be undertaken until habitat quality is determined to be similar to that of the control sites or better. Riparian and aquatic restoration activities can include (but are not limited to): installation of fencing to control cattle access to the riparian zone revegetation riparian vegetation to a width of 10 m or more using appropriate riparian species no clearing of River Red Gum riparian communities or Lowland Catchment of the Darling River vegetation communities without prior approval limit clearing in the riparian zone weed management invasive and pest species management stabilization of unstable river banks aquatic habitat restoration The Biodiversity Management Plan (BMP) (Section 7.6, Parsons Brinckerhoff, 2012) lists a number of management strategies to manage the impacts of salinity on local biodiversity. A combination of preventative measures, active measures and will be used to manage sediment, erosion and seepage. The management of Nagero Creek and the Namoi River will be coordinated between this SWMP and plans for the management of biodiversity offset areas to ensure a comprehensive approach. Stream and riparian health should be carried out at the same time as geomorphology undertaken annually (section 6.4). 7.2 Management responses Investigation, notification and mitigation of exceedances of trigger levels for surface water quality and quantity will be carried out as required. Management responses can be divided into six key areas: Nagero Creek ambient requires a management response to water quality in Nagero Creek that exceeds the trigger level conditions. Nagero Creek event requires a management response to water quality within the site water management system or immediately downstream of these elements that exceeds the trigger level conditions. Flood impacts along haul road and rail spur requires management response by environmental staff if flooding impacts exceed the trigger level conditions. Stream and riparian vegetation health requires management response to prompt secondary stage of investigation in the event of impacts to stream and riparian vegetation exceed trigger level conditions. BCPL Page 61
69 Incident management refers to the general site wide management response to incidents including environmental incidents such as oil or chemical spills. There are no specific trigger levels for these events. Complaint management refers to the BCPL Complaint Management procedure to respond to community complaints. Each of the management response areas are discussed in the following sections Nagero Creek ambient If any parameters in the receiving water at the downstream point SW1 specified in Table 7-1 exceed the trigger levels during ambient, the BCPL Environment Superintendent must compare the downstream results to the upstream results and: where the downstream results (SW1) are within 20% of the upstream result (SW2) value for the parameters then no action is required where the downstream results (SW1) are not within 20% of the upstream result (SW2) value for the parameters the response plan must be followed as per Table 7-2. As more data is gathered for SW1 and SW2 (at least five data points collected on the same day), the parameter-specific variance between the two sites should be used as the trigger for further action rather than the nominal 20% stated above Nagero Creek event If water quality monitored at locations listed in Table 6-2 exceed the trigger levels specified in Table 7-1 prior to a discharge event, the response plan must be followed as per Table 7-2. During high flow events, water from the Nagero Creek catchment overtops a crest on the floodplain and flows south into the Bollol Creek catchment. This water is currently captured in farm dams on several properties located to the south of the Project Boundary including those along Therribri Road, Manilla Road and Leard Forest Road. In the unlikely event that a discharge poses a threat to health of surrounding property owners and occupiers, the Environment Superintendent will notify those likely to be affected. This risk is also identified within the Response Plan in Section 7.3. A list of contact details of nearby residents is maintained by BCPL Flooding impacts As outlined in Appendix I, if the BOM has issued a Flood Warning for the Namoi River and weather conditions and local /gauging stations have recorded high flows upstream over the past few days then the flooding impacts could be significant and a management response is required. Appendix I shows the flooding response and communication protocol to be followed. In the event that flooding impacts pose a threat to downstream properties and occupiers, the Environment Superintendent will notify those likely to be affected. Contact details for nearby residents are provided in Appendix A of the WMP. In addition, if overtopping of sediment dams are predicted or controlled discharge from multiple sediment dams at the same time, local landholders should be contacted as part of the event based program. BCPL Page 62
70 If a flood event causes damage to the mine haul road or rail embankment, significant downstream flooding impacts or damage to downstream landowners may occur, in which case Government agencies are to be notified of the incident as outlined in Section The flood assessment for the rail spur (Aurecon, 2013) found that the residual afflux at the nearest property that has been advised as sensitive to project impacts is approximately 8 mm for the 100 year ARI event. Aurecon (2013) also found that impact on flood conditions in the upper reaches of the Nagero Creek, including the point where the Bollol Creek is likely to overtop into Nagero Creek and vice versa, will be negligible due to the limited afflux experience at the Nagero Creek elbow which is immediately upstream of the proposed railway works. Flood impacts downstream of Tarrawonga Mine (Bollol Creek) should be considered in the next revision of the WMS (Parsons Brinckerhoff, 2013b) Stream and riparian vegetation health Refer to section Incident management Incident reporting is required under Schedule 5, Condition 8 of the Project Approval granted 18 July 2012 under Section 75J of the EP&A Act BCPL has developed an incident management procedure detailing how all environmental incidents and emergencies are followed up and investigated to ensure that all agreed actions are appropriately followed up and closed-out, and that essential information is recorded. When an environmental incident or emergency occurs, the Contractor and Subcontractor will record specific information in accordance with this procedure. This information will be passed to BCPL s Environment Superintendent immediately. BCPL s Environment Superintendent will maintain records of all environmental incidents. All environmental incidents that have the potential to cause material harm to the environment will be immediately notified to the Director-General, EPA and DP&I. Notifications will be followed by a written incident report to the Director-General and EPA within seven days of the date on which the incident occurred. A response plan to address identified potential environmental incidents and their contingency measures are provided in Complaint management All community complaints related to water management from the Boggabri Coal Mine are to be managed in accordance with the BCPL Complaint Management Procedure. This procedure outlines a standard process for reporting and responding to community complaints for all BCPL employees and contractors at the Boggabri Coal Mine. BCPL Page 63
71 7.3 Response plan Triggers and corrective actions, including required notification of authorities and responsibilities, are provided in 7-2 for events where material environmental harm and/or breach EPL licence conditions is caused or threatened. Corrective actions and reporting requirements have been based on the following: EPL Part 5.7 section 148 of the POEO Act Part 5.3 section 120 of the POEO Act Schedule 5 condition 8 of Project Approval granted 18 July 2012 under Section 75J of the EP&A Act Emergency and contingency planning will form part of the SWMP on site. Appendix J shows a simple spill response procedure developed for the site to be displayed at appropriate locations (e.g. river crossings, near outfalls, adjacent to watercourses).the response plan for incidents requiring a response is provided in Table 7-2. BCPL Page 64
72 Table 7-2 Response plan Aspect Event type Trigger Corrective action Authority notification Responsibility Further information Water quality impact Water quality impact Water quality impact Nagero Creek ambient Nagero Creek event, prior to intention for a controlled discharge Sediment dam, prior to intention for a controlled discharge Exceedence of interim trigger levels (Section ) and discharges have occurred from the site Exceedence of interim trigger levels (Section ) Exceedence of EPL limits (Table 6-1) Report incident internally as per Boggabri Coal incident reporting guidelines. Prevent and restrict discharge into watercourses until further analyses are carried out and water quality parameters returns within set values. Immediately notify EPA and potentially affected persons including those properties along Therribri Road, Manilla Road and Leard Forest Road with farm dams (where necessary). Investigate and prepare report outlining causes, impacts and recommended mitigation measures. Supply details to EPA in the annual return report and implement report recommendations. Report exceedence internally as per Boggabri Coal incident reporting guidelines. Prevent and restrict discharge into watercourses until Nagero Creek water quality parameters returns within set values. In the event of prolonged rainfall and sediment dams are full, and water quality criteria for discharge cannot be met, sediment dam water will be pumped to the mine water storages to prevent uncontrolled discharges. Report exceedence internally as per Boggabri Coal incident reporting guidelines. Prevent and restrict discharge into watercourses until further analyses are carried out and water quality parameters returns within set values. In the event of prolonged rainfall and sediment dams are full, and water quality Immediately notify EPA of incident by calling the Environment Line service on Immediately notify Director-General and DP&I. Provide written details of the notification to the EPA and Director- General within 7 days of the event occurring. Supply laboratory results to EPA within 7 days of receiving results. Not required. Not required. Environment Superintendent Environment Superintendent Environment Superintendent If regular exceedances occur, the Environment Superintendent, is to notify the appropriate Manager Mining, and formulate a corrective action in consultation with EPA and NSW Office of Water, if appropriate. BCPL Page 65 N/A Flocculation can be used to increase sedimentation in the water column of the sediment dams to achieve EPL limits. Testing after flocculation to confirm if under EPL limits for
73 Aspect Event type Trigger Corrective action Authority notification Responsibility Further information criteria for discharge cannot be met, sediment dam water will be pumped to the mine water storages to prevent uncontrolled discharges. discharge. Water quality impact Nagero Creek, during uncontrolled discharge Exceedence of interim trigger levels (Section ) Report incident internally. Prevent and restrict discharge into watercourses until further analyses are carried out and water quality parameters returns within set values. Immediately notify EPA within and potentially affected persons including those properties along Therribri Road, Manilla Road and Leard Forest Road with farm dams (where necessary). Investigate and prepare report outlining causes, impacts and recommended mitigation measures. Supply details to EPA in the annual return report and implement report recommendations. Immediately notify EPA of incident by calling the Environment Line service on Immediately notify Director-General and DP&I. Provide written details of the notification to the EPA and Director- General within 7 days of the event occurring. Supply laboratory results to EPA within 7 days of receiving results. Environment Superintendent If regular exceedances occur, the Environment Superintendent is to notify the appropriate Manager Mining, and formulate a corrective action in consultation with EPA and NSW Office of Water, if appropriate. Water quality impact Oil/chemical spill or other event potentially causing material environmental harm Large spills or spill occurring in close proximity of water drain and/or watercourse In the event of an oil/chemical spill, all work will stop in the area where the spill occurred. Deploy spill response kits if applicable and contain the spill if safe to do so. Notify the Environment Superintendent and consult MSDS, if relevant. Mitigate spill as per the Environment Superintendent s recommendation. Notify potentially affected persons (where necessary). Report incident internally as per Boggabri Coal incident reporting guidelines. Immediately notify EPA of incident by calling the Environment Line service on Immediately notify Director-General and DP&I. Provide written details of the notification to the EPA within 7 days of the event occurring. Environment Superintendent BCPL Emergency Management Plan Investigate and prepare report outlining causes, impacts and recommended mitigation measures. Supply details to EPA in the annual return report and implement report recommendations. BCPL Page 66
74 Aspect Event type Trigger Corrective action Authority notification Responsibility Further information Downstrea m flooding impact Flood event causes damage to rail/haul road embankment and potential damage downstream BoM Flood warning issued and nearby gauges indicate significant rainfall event Notify downstream landowners, await instructions from SES. Immediately notify EPA of incident by calling the Environment Line service on Immediately notify Director-General and DP&I. Provide written details of the notification to the EPA within 7 days of the event occurring. Environment Superintendent Appendix I of this document Downstrea m flooding impact Downstrea m flow impact Riparian vegetation condition Increased flows to downstream Nagero Creek Changes to downstream hydrology and potential impact on agricultural enterprise Damage to riparian vegetation or reduction in riparian vegetation condition Multiple controlled releases from sediment dams; or uncontrolled releases/spills Complaints received regarding flooding impacts downstream Habitat condition assessed to be declining compared to control sites during annual aquatic Notify downstream landowners Review flow quantity data to confirm cause of flooding from mine discharges or natural flood event. If complaints continue, consider undertaking flood assessment of lower order events (e.g. 3 month to 5 year ARI) and duration of flows. Follow complaint response protocol Install fencing to control cattle access to the riparian zone. Revegetate riparian zone to a width of 10 m or more using appropriate riparian species. Do not clear River Red Gum riparian communities or Lowland Catchment of the Darling River vegetation communities without prior approval. Limit clearing in the riparian zone. Management weeds and invasive and pest species. Report in annual review Report in annual review Ecological Assessment and approval required prior to clearing River Red Gum riparian vegetation communities and Lowland Catchment of the Darling River vegetation community. Environment Superintendent Environment Superintendent Environment Superintendent Stream Reduction in stream Habitat condition Restore and rehabilitate riparian zone. All actions to comply Environment Appendix I of this document BCPL Complaint Management Procedure BCPL Page 67
75 Aspect Event type Trigger Corrective action Authority notification Responsibility Further information health health and or water quality based on Biodiversity Management Plan and Geomorphology surveys assessed to be declining compared to control sites during annual aquatic. with the Fisheries Management Act 1994 Superintendent Damage to geomorphological functioning (e.g. increased bank erosion, change in cross-sectional profiles, increased sedimentation) Invasive and pest species management Stream channel sequencing modification where required installation of riffles, runs and pools. Protect unstable river banks and discharge outlets. Decrease flow velocities during release events. Ensure compliance with suspended solids limits. BCPL Page 68
76 8. Reporting and plan revision 8.1 Reporting Reporting items related to the SWMP are discussed in Section 5 of the WMP. Specific requirements relating to the SWMP are described below Annual surface water appendix An Annual Surface Water Monitoring Appendix is to be prepared for each calendar year. The results of the Annual Surface Water Monitoring Appendix are to be presented as part of the Annual Environmental Management Report (AEMR). The Annual Surface Water Monitoring Appendix will utilise the following data: water quality results for the previous calendar year water quantity results for the previous calendar year summary of any incidents or breaches that have occurred and corrective actions taken analysis and assessment of results, update on baseline data to review interim triggers management actions including riparian / geomorphology 8.2 Revision and development The SWMP is a living document and will be updated, and will evolve and develop throughout the mine life. Triggers for these revisions could include: requirement for additional detail of the water management system in the mid to later years of the Project SWMP review as part of Annual Review changes to legislation, regulation and guidance changes/amendments to project planning approval changes/amendment to environmental licences changes to mine operations, mine stage planning and water supply strategies, including if the irrigation system is commissioned onsite to dispose of surplus water feedback loop as part of plan implementation, internal review, testing, training and lessons learnt agency consultancy if there are outcomes from an independent audit required under the approval conditions BCPL Page 69
77 if there are actions or changes required as a result of an incident report Annual review This SWMP, its operation and implementation will be reviewed at least every 12 months by the BCPL Environment Superintendent, to ensure that the system is conforming to the MOP, environmental policies, plans, objectives and legal and other requirements. At any time if preventative actions indicate that amendments to the WMP are required, the WMP review process will be triggered, including the related sub-documents (SWMP, GMP and SWB). Refer to the WMP for further detail Planning related changes Non-site specific changes to legislation, regulation, guidance and related site specific changes to planning approvals and licences are likely to occur over the life of the mine. A process for managing this is provided in the WMP. Any revisions relevant to the SWMP will generally be documented as part of the Annual Review, however, specific revisions may be required subject to the Environment Superintendent s direction Changes to mine operations Changes to mine planning and operation are likely to occur over the life of the mine and could result from changes such as budgetary constraints, increased/reduced production demands, water availability etc. Any revisions relevant to the WMP will generally be documented as part of the Annual Review; however, specific revisions may be required subject to the Environment Superintendent s direction. In addition, if there are significant changes to mine operations then this may trigger requirements for revised plans to be approved by DP&I in consultation with agencies and CCC Feedback loop The SWMP is intended to provide structure and guidance to the surface water management process. Many elements relating to licensing compliance can be considered prescriptive in nature however opportunities exist as part of the plans implementation/revision for feedback to be incorporated. This feedback could include: mine staff, contractors and environmental staff feedback, lessons learnt and previous experience testing of, water quality adjustment (i.e. flocculation, ph adjustment etc.), soils management and data documentation and implementation audit processes (internal and external) community, stakeholders, authorities and other parties Agency consultation Revisions and updates to the SWMP will be prepared in consultation with representatives from OEH, NOW, NCMA and CCC. BCPL Page 70
78 8.2.6 Submission of incident report The SWMP will be revised where investigation and reporting following an environmental incident recommends additional or amended actions be taken relating to water management Independent environmental auditing Independent environmental auditing is required to be carried out by the end of June 2014 and every 3 years thereafter, as specified in Schedule 5 condition 8 of Project Approval granted 18 July 2012 under Section 75J of the EP&A Act Any measures or actions recommended during independent auditing relating to water management will be reflected in a revision of the WMP, including the related sub-documents (SWMP, GMP and SWB). 8.3 Future work The following items are to be considered in future updates to the SWMP: development of surface water management concept plans of additional snapshot landforms in the mid to later years of the Project (the current SWMP provides more detail around the first five years of the Project with three of the five snapshot landforms relating to the first five years) update of ambient based program for Nagero Creek from July 2012 capturing zero flow records. Reporting of automatic water level and converted flow data. review and update of trigger levels based on a review of a longer ambient data set where appropriate. Suitable geomorphological triggers to be developed based on the first walkover survey. investigation into reliability of supply of water during low rainfall periods BCPL Page 71
79 9. Corrective and preventative actions Contractors and BCPL employees are to be involved in the implementation of corrective and preventative actions during the construction and operational phases of the Project. 9.1 Non-compliances and corrective actions Non-compliances will be detected through verification processes such as, inspections and audits: When a non-conformance issue is detected, corrective actions will be identified, communicated and agreed on with BCPL and implemented. Relevant contractors will be notified immediately of any non-compliant activities that present a risk of causing material environmental harm. Corrective actions will include a review of any relevant plans and procedures following identification of any non-conformance. Where the non-conformance issue is associated with an inspection, audit or event, the actions will be linked to the record of that event. Non-compliance reports will be reviewed on a regular basis to ensure actions are progressed appropriately. 9.2 Preventive actions Preventive actions will be managed as follows: A preventive action may be identified without an environment incident or nonconformance occurring. Corrective actions will be identified and agreed with BCPL before being implemented. Preventative actions may include physical works or changes to plans or procedures, training or other requirements. BCPL Page 72
80 10. Training and awareness 10.1 Visitors induction All visitors to the Boggabri Coal Mine (personnel not undertaking work) will undergo a visitor s induction. Contractors and subcontractors are responsible for the actions and conduct of their visitors and will ensure that all environmental requirements of the site are obeyed. All visitors will be accompanied around the site at all times. Under no circumstances will a visitor undertake any physical work on site. Records of visitor inductions will be maintained by BCPL and relevant contractors and subcontractors Site induction All personnel (including employees, contractors and subcontractors) mobilised during the construction and operational phases of the Project will undertake a site-orientated induction program prior to commencing works. The induction will describe environmental impacts applicable to the Boggabri Coal Mine, including relevant legislation and legal responsibilities Toolbox talks Toolbox talks will be conducted regularly to maintain and improve employee and contractor awareness of surface water management issues/requirements Task specific training BCPL employees and contractors undertaking tasks requiring specific knowledge or skills in surface water management may be required to undergo task specific training. Specific requirements for BCPL employees and contractors (e.g. water quality sampling) will be identified during BCPL s annual training needs analysis, and/or as required as changes to activities or personnel occur. The training needs analysis identifies the minimum required competencies, qualifications and skills commensurate with the individual s role responsibilities. Records of personnel training attendance, competencies, qualifications and skills will be maintained by BCPL and contractors. BCPL Page 73
81 11. Implementation 11.1 Summary of actions Key actions for the SWMP going forward include on-going of ambient water quality, quantity and geomorphology so that there is a sufficient baseline data to be used for assessment and to develop more appropriate local trigger values. Table 11-1 outlines the actions that will be taken and the recommended timeframes. Table 11-1 Summary of actions Element Action Timing 1 Sufficient ambient baseline water quality data for Nagero Creek On-going of ambient data for water quality parameters set out in Table 6-4, including metals and including zero flow recordings On-going, event based until such time that there are sufficient data points to establish baseline conditions for water quality. Typically 2 years of continuous data. Review dataset annually. 2 Sufficient ambient baseline flow data for Nagero Creek 3 Dissolved metals 4 Geomorphology 5 Dam water level surveys On-going of ambient flows in Nagero Creek as specified in Section 6.3 and Appendix H, including zero flow recordings On-going of dissolved metals as listed in Table 6-4 for both ambient and within the water management system, until such time that it can be concluded that metals are not of concern Undertake baseline geomorphology assessment as specified in Section 6.4 Survey of water levels in the sediment dams and mine water dams to monitor pumping requirements and maximum storage levels to prevent uncontrolled spills On-going, event based until such time that there are sufficient data points to establish baseline flow conditions. Typically 2 years of continuous data. Review dataset annually. On-going until such time that it can be concluded that metals are not of concern. Review dataset annually. Baseline geomorphology survey as soon as possible. On-going geomorphology surveys annually. Weekly if possible and before pumping of water from one dam to another 6 Monitoring of clean water drains to ensure stability and non-sediment generating 7 Impacts to downstream flows 8 Acid rock drainage Visual inspection of clean water drains at same time as ambient If complaints are received from downstream landholders on Nagero Creek, and discharges have occurred on site, a flood assessment of lower order events will be investigated and considered Ongoing of geochemical and physical characteristics of coal reject materials using bulk samples Visual inspection of clean water drains during ambient along the clean water drains and to inspect condition of drains and report any maintenance or repair work If multiple complaints are received from downstream landholders and discharges have occurred from the mine On-going. Review annually. BCPL Page 74
82 Element Action Timing obtained from the CHPP. 9 Stream base flow and GDE s 10 Stream and riparian vegetation health Conduct tree root depth study using replicate samples within each broad vegetation type to assess dependency on surface water/groundwater as specified in Section 6.6 Undertake baseline stream and riparian vegetation health assessment in line with details specified in section 6.5 As soon as is practicable. As soon as is practicable. On-going surveys annually. BCPL Page 75
83 12. References Aurecon (2013) Boggabri Maules Creek Rail P5060 Drainage Hydrology and Hydraulic Assessment Common and Boggabri, prepared for Leighton Contractors, May 2013 ANZECC (2000) Australian and New Zealand Guidelines for Fresh and Marine Water Quality, Australian and New Zealand Environment and Conservation Council/Agriculture and Resource Management Council of Australia and New Zealand Bassuk, N, Grabosky, J, Mucciardi, A & Raffel, G 2011, 'Ground-penetrating radar accurately locates tree roots in two soil media under pavement', Arboriculture & Urban Forestry, vol. 37, no. 4, pp Butnor, JR, Doolittle, JA, Johnsen, KA, Samuelson, T, Stokes, T & Kress, L 2003, 'Utility of ground-penetrating radar as a root biomass survey tool in forest systems', Soil Science Society of America Journal, vol. 67, pp Canadell, J., Jackson, R.B., Ehleringer, J.B., Mooney, H.A., Sala, O.E. and Schulze, E.D. (1996) Maximum rooting depth of vegetation types at the global scale, Oecologia, 108(4), Cummins, S., Roberts, D., Church, A., Ling, J. (1997). Invertebrate associations in macrophyte assemblages within the Hawkesbury-Nepean River, NSW. Science and Technology in the Management of the Hawkesbury-Nepean Catchment, Geographical Society NSW, 14: Department of Land and Water Conservation (1999). Guidelines for Establishing Drainage Lines on Rehabilitated Minesites (Draft). Fensham, R.J. and Fairfax, R.J. (2007) Drought-related tree death of savanna eucalypts: Species susceptibility, soil conditions and root architecture, Journal of Vegetation Science, 18: Gilbert and Associates (2010) Tarrawonga Coal Mine Modification - Surface Water Assessment, March 2010 GSS Environmental (2010), Continuation of Boggabri Coal Mine Project Environmental Assessment, Soil Survey and Land Resource Impact Assessment Report. May 2010 Hansen Bailey (2010) Continuation of Boggabri Coal Mine Environmental Assessment. Singleton, NSW Hruska, J., Cermak, J. & Sustek, S. (1999). Mapping tree root systems with groundpenetrating radar, Tree Physiology, 19, Jansen, A., Robertson, A., Thompson, L. & Wilson, A. (2005). Development and application of a method for the rapid appraisal of riparian condition, River & Riparian Land Management Technical Guideline, no. 4A, Land & Water Australia, Canberra. Landcom (2004), Managing Urban Stormwater Soils and Construction Fourth Edition, March 2004, NSW Government BCPL Page 76
84 NSW (2004) Approved Methods for the Sampling and Analysis of Water Pollutant in NSW. Department of Environment and Conservation and Environmental Protection Agency. ISBN Document reference DEC 2004/35. March NSW Department of Environment and Climate Change, DECC (2008), Managing Urban Stormwater Soils and Construction Volume 2E Mines and Quarries, June NSW Department of Environment and Heritage, DEH (2006) NSW Water Quality and River flow objectives - Namoi River < site accessed 23 March Parsons Brinckerhoff, (2010a) Continuation of Boggabri Coal Mine Surface Water Assessment. Parsons Brinckerhoff, (2010b), Continuation of Boggabri Coal Mine Biodiversity Impact Assessment, October 2010 Parsons Brinckerhoff, PB (2011), Namoi River Flood Study for the Proposed Maules Creek Mine, March Parsons Brinckerhoff, PB (2012), Biodiversity Management Plan (BMP). October Parsons Brinckerhoff, PB (2013a), Rehabilitation Management Plan (RMP). January Parsons Brinckerhoff, PB (2013b), BTM Complex Water Management Strategy, January 2013RGS (2009) Maules Creek Project Geochemical Assessment of Overburden and Potential Reject Materials. Pusey, B. J., Arthington, A. H. (2003). Importance of the riparian zone to the conservation and management of freshwater fish: a review. Mar. Freshwater Res., 54: Ribbons, C. (2009), Water availability in New South Wales Murray-Darling Basin regulated rivers, NSW Department of Water and Energy, Sydney, p.12 Thompson JR, T. M. (2001). A geomorphological framework for river characterization and habitat assessment. Aquatic Conservation: Marine and Freshwater Ecosystems, 11, Turak, E., Waddell, N., Johnstone, G. (2004) New South Wales Australian River Assessment System (AUSRIVAS) Sampling and Processing Manual 2004, Department of Environment and Conservation, Sydney. Underwood, A.J. (1992) Beyond BACI: the detection of environmental impacts on populations in the real, but variable, world, Journal of Experimental Marine Biology and Ecology, vol. 161, pp WRM (2009) Continuation of Boggabri Coal Mine - Namoi River Flood Impact Assessment, December BCPL Page 77
85 Appendix A Water management system layout plans, and discharge locations, and schematics. BCPL

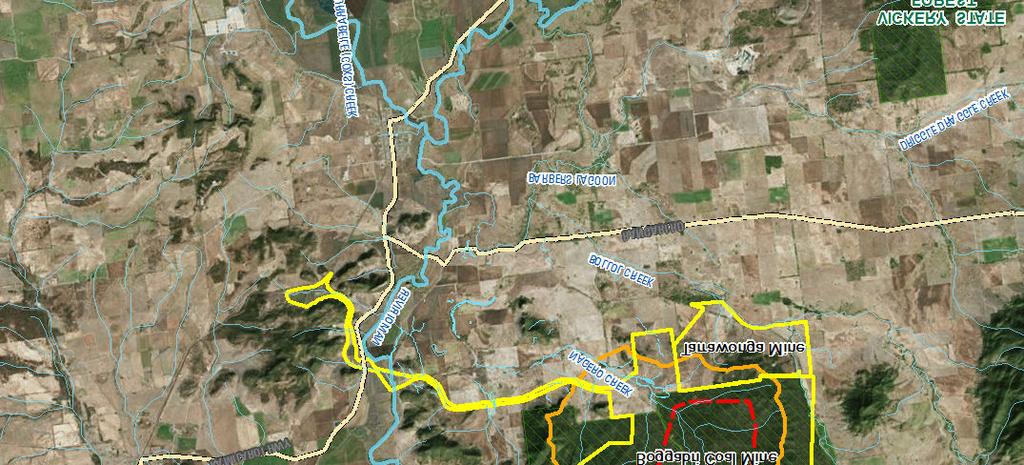

86 BOGGABRI COAL PROJECT WATER MANAGEMENT PLAN BOGGABRI COAL PTY LTD NARRABRI BARRABA MANILLA GUNNEDAH TAMWORTH QUIRINDI \\APNTLFPS01\proj\B\Boggabri_Coal\ B_Boggabri_Water_Management_Pla\10_GIS\Projects\Drawings_Figures_Sketches\ B_GIS_F016_A1.mxd Author: SaflianK 6/06/2013 Mining leases Mine disturbance area Study catchment NSW State Forest/ Conservation Area NSW Main Road Drainage THE SLUSH HOLES km Figure 1 Locality plan
87 BOGGABRI COAL PROJECT SURFACE WATER MANAGEMENT PLAN BOGGABRI COAL PTY LTD m SD7 MW2 Strip 9 SD km m SD m SD10 SD6 39 SD10 SD6 SD8 ek Cre m 29 0 SD12 en SD11 SD27 ow yg SD3 rr Me River 25 i Namo k' MW3 ri Cree k e Cre The Slush H oles 24 o ge r 'Na G o o nb \\APNTLFPS01\proj\B\Boggabri_Coal\ B_Boggabri_Water_Management_Pla\10_GIS\Projects\Drawings_Figures_Sketches\ B_GIS_F001_A11.mxd Author: SuansriR 11/10/ m 43 0 m 37 0 SD12 m 40 0 SD SD3 Mine Infrastructure Rail Loop Fence Year 1 Mine Contours 1 contour Water Balance Catchment Boggabri Coal Mining Tenement EIS Boundary Federal Approval Limit Tarrawonga Mining Lease Boundary Bollol C Year 1 Water Management Clean water drain Dirty water drain Pump pipeline Existing pipeline Water Storages Year 1 Land Use Zones Unshaped Spoil Dump Active Mining Area Cleared/Pre-Stripping Road/Industrial Topsoil stripping Stockpiled material km reek [ Undisturbed Tarrawonga Coal Mine Figure 2 Water Management System Concept - Year 1
88 BOGGABRI COAL PROJECT WATER MANAGEMENT PLAN BOGGABRI COAL PTY LTD FIGURE 2A WATER BALANCE MODEL SCHEMATIC YEAR 1
89 BOGGABRI COAL PROJECT SURFACE WATER MANAGEMENT PLAN BOGGABRI COAL PTY LTD 36 0 m SD7 SD10 SD6 SD8 ek Cre en m 29 0 ow yg SD27 rr Me 28 River i Namo SD3 SD12 SD11 25 MW2 Strip 9 26 SD km m SD m SD10 45 SD6 39 'Nagero Creek' k' MW3 ri Cree k e Cre The Slush H oles 24 o ge r 'Na G o o nb \\APNTLFPS01\proj\B\Boggabri_Coal\ B_Boggabri_Water_Management_Pla\10_GIS\Projects\Drawings_Figures_Sketches\ B_GIS_F002_A7.mxd Author: SuansriR 10/10/ m 43 0 m 37 0 SD12 m 40 0 SD SD3 Mine Infrastructure Rail Loop Fence Year 2 Mine Contours 1 contour Water Balance Catchment Boggabri Coal Mining Tenement EIS Boundary Federal Approval Limit Tarrawonga Mining Lease Boundary Bollol C Year 2 Water Management Clean water drain Dirty water drain Pump pipeline Existing pipeline Water Storages Year 2 Land Use Zones Unshaped Spoil Dump Active Mining Area Cleared/Pre-Stripping Road/Industrial Longterm rehabilitation Topsoil stripping km reek [ Stockpiled material Undisturbed Tarrawonga Coal Mine Figure 3 Water Management System Concept - Year 2
90 BOGGABRI COAL PROJECT WATER MANAGEMENT PLAN BOGGABRI COAL PTY LTD FIGURE 3A WATER BALANCE MODEL SCHEMATIC YEAR 2
91 BOGGABRI COAL PROJECT SURFACE WATER MANAGEMENT PLAN BOGGABRI COAL PTY LTD SD m SD km m 27 0 MW5 32 SD m SD10 SD 'Nagero Creek' SD8 SD6 SD10 ek SD27 Cre en SD12 SD3 ow m 29 0 SD11 yg River 25 rr Me 28 i Namo 26 k' MW3 ri Cree k e Cre The Slush H oles 24 o ge r 'Na G o o nb \\APNTLFPS01\proj\B\Boggabri_Coal\ B_Boggabri_Water_Management_Pla\10_GIS\Projects\Drawings_Figures_Sketches\ B_GIS_F003_A4.mxd Author: SuansriR 10/10/2013 m 37 0 m 43 0 SD12 41 m 40 0 SD11 42 SD3 Mine Infrastructure Rail Loop Fence Year 2 Mine Contours 1 contour Water Balance Catchment Boggabri Coal Mining Tenement EIS Boundary Federal Approval Limit Tarrawonga Mining Lease Boundary Bollol C Year 5 Water Management Clean water drain Dirty water drain Pump pipeline Existing pipeline Water Storages Year 5 Land Use Zones Unshaped Spoil Dump Active Mining Area Cleared/Pre-Stripping Road/Industrial Longterm rehabilitation Stockpiled material km reek [ Undisturbed Tarrawonga Coal Mine Figure 4 Water Management System Concept - Year 5
92 BOGGABRI COAL PROJECT WATER MANAGEMENT PLAN BOGGABRI COAL PTY LTD FIGURE 4A WATER BALANCE MODEL SCHEMATIC YEAR 5
93 SD10 SD8 SD6 ek Cre en m 29 0 SD12 ow SD3 yg rr Me River SD m 44 i Namo 25 SD7 26 SD23 MW5 SD km SD m k' ri Cree k MW3 G o o nb e Cre The Slush H oles 24 o ge r 'Na \\APNTLFPS01\proj\B\Boggabri_Coal\ B_Boggabri_Water_Management_Pla\10_GIS\Projects\Drawings_Figures_Sketches\ B_GIS_F004_A3.mxd Author: SuansriR 13/11/2013 m 43 0 m SD m 30 SD10 SD m SD12 SD11 42 SD3 Disturbance within 25 of the Mining Tenement Boundary will be subject to approvals as required under Schedule 3 condition 7 of the approval. BOGGABRI COAL PROJECT SURFACE WATER MANAGEMENT PLAN BOGGABRI COAL PTY LTD Mine Infrastructure Rail Loop Fence Year 10 Mine Contours 1 contour Water Balance Catchment Boggabri Coal Mining Tenement EIS Boundary Federal Approval Limit Tarrawonga Mining Lease Boundary Bollol C Year 10 Water Management Clean water drain Dirty water drain Pump pipeline Existing pipeline Water Storages Year 10 Land Use Zones Unshaped Spoil Dump Cleared/Pre-Stripping Road/Industrial Longterm rehabilitation Stockpiled material Undisturbed km reek [ Mining Void Tarrawonga Coal Mine Figure 5 Water Management System Concept - Year 10
94 BOGGABRI COAL PROJECT WATER MANAGEMENT PLAN BOGGABRI COAL PTY LTD FIGURE 5A WATER BALANCE MODEL SCHEMATIC YEAR 10
95 m 34 SD SD23 MW5 SD10 SD6 SD8 ek m 29 0 SD12 Cre en SD11 SD3 ow yg River 25 rr Me 28 i Namo 26 k' MW3 G o o nb e Cre The Slush H oles 24 o ge r 'Na ri Cree k \\APNTLFPS01\proj\B\Boggabri_Coal\ B_Boggabri_Water_Management_Pla\10_GIS\Projects\Drawings_Figures_Sketches\ B_GIS_F005_A3.mxd Author: SuansriR 13/11/ km SD22 SD24 SD21 0 m 27 0 SD20 SD CD m SD 'Nagero Creek' m SD6 CD m 40 0 SD12 SD11 CD6 CD5 42 SD3 Disturbance within 25 of the Mining Tenement Boundary will be subject to approvals as required under Schedule 3 condition 7 of the approval. BOGGABRI COAL PROJECT SURFACE WATER MANAGEMENT PLAN BOGGABRI COAL PTY LTD Mine Infrastructure Rail Loop Fence Year 21 Mine Contours 1 contour Water Balance Catchment Boggabri Coal Mining Tenement EIS Boundary Federal Approval Limit Tarrawonga Mining Lease Boundary Bollol C Year 21 Water Management Clean water drain Dirty water drain Pump pipeline Existing pipeline Water Storages Year 21 Land Use Zones Unshaped Spoil Dump Road/Industrial Longterm rehabilitation Stockpiled material Undisturbed km reek [ Mining Void Tarrawonga Coal Mine Figure 6 Water Management System Concept - Year 21
96 BOGGABRI COAL PROJECT WATER MANAGEMENT PLAN BOGGABRI COAL PTY LTD FIGURE 6A WATER BALANCE MODEL SCHEMATIC YEAR 21
97 BOGGABRI COAL PROJECT SURFACE WATER MANAGEMENT PLAN BOGGABRI COAL PTY LTD 34 SD MW3 oles G o o nb MW3 ri Cree k 35 ek 24 Cre k' en Frequency and event based water quality e Cre ow o ge r 'Na SD7 SD6 Ambient water quality and quantity Frequency based water quality 4 2 yg m 29 0 Year 1 Surface Water Monitoring Site For operational purposes only (if required) Mine Infrastructure Rail Loop Fence Year 1 Mine Contours 1 contour The Slush H Pit void rr Me 28 River 25 SD m 3 Strip 9 i Namo 26 MW2 3 2 MW2 SD km SW2 m m SD8 45 SD SD8 SD10 \\APNTLFPS01\proj\B\Boggabri_Coal\ B_Boggabri_Water_Management_Pla\10_GIS\Projects\Drawings_Figures_Sketches\ B_GIS_F006_A8.mxd Author: SuansriR 10/10/2013 SD SD6 30 SW1 29 'Nagero Creek' SD m 37 0 SD12 42 m m SD SD3 SD11 2 SD3 Water Balance Catchment Boggabri Coal Mining Tenement EIS Boundary Federal Approval Limit Tarrawonga Mining Lease Boundary Bollol C Year 1 Water Management Clean water drain Dirty water drain Pump pipeline Existing pipeline Water Storages Year 1 Land Use Zones Unshaped Spoil Dump Active Mining Area Cleared/Pre-Stripping Road/Industrial Topsoil stripping Stockpiled material km reek [ Undisturbed Tarrawonga Coal Mine Figure 7 Surface Water Monitoring Concept - Year 1
98 BOGGABRI COAL PROJECT SURFACE WATER MANAGEMENT PLAN BOGGABRI COAL PTY LTD 36 0 m SD m 37 0 SD12 m Strip 9 SD7 SD27 SD6 k' MW3 3 MW3 oles 24 Frequency and event based water quality e Cre ri Cree k o ge r 'Na G o o nb 2 1 ek 4 4 Cre m en 2 ow SD3 2 yg 4 2 Ambient water quality and quantity Frequency based water quality Pit Void rr Me 28 For operational purposes only (if required) Mine Infrastructure Rail Loop Fence Year 2 Mine Contours 1 contour The Slush H MW2 River Year 2 Surface Water Monitoring Site MW2 0.3 km 1 SD SW2 m SD m SD SD SD10 1 SD6 SD10 4 SW1 'Nagero Creek' i Namo \\APNTLFPS01\proj\B\Boggabri_Coal\ B_Boggabri_Water_Management_Pla\10_GIS\Projects\Drawings_Figures_Sketches\ B_GIS_F007_A3.mxd Author: SuansriR 11/10/ SD11 m 40 0 SD11 2 SD3 SD3 Water Balance Catchment Boggabri Coal Mining Tenement EIS Boundary Federal Approval Limit Tarrawonga Mining Lease Boundary Bollol C Year 2 Water Management Clean water drain Dirty water drain Pump pipeline Existing pipeline Water Storages Year 2 Land Use Zones Unshaped Spoil Dump Active Mining Area Cleared/Pre-Stripping Road/Industrial Longterm rehabilitation Topsoil stripping km reek [ Stockpiled material Undisturbed Tarrawonga Coal Mine Figure 8 Surface Water Monitoring Concept - Year 2
99 BOGGABRI COAL PROJECT SURFACE WATER MANAGEMENT PLAN BOGGABRI COAL PTY LTD SD m Pit Void 0.3 km 0.2 MW MW5 m SD m 30 SD6 29 SD8 SW SD6 SD10 2 SW1 SD 'Nagero Creek' 47 SD SD12 m 37 0 m SD m 40 0 SD11 SD27 SD ek o ge r 'Na 24 Frequency based water quality e Cre k' MW3 3 ri Cree k Frequency and event based water quality MW3 G o o nb Event based water quality Mine Infrastructure Rail Loop Fence Year 2 Mine Contours 1 contour oles For operational purposes only (if required) The Slush H 4 5 Ambient water quality and quantity Cre 3 4 en 2 m 29 0 Year 5 Surface Water Monitoring Site 1 ow 25 SD3 yg River 26 rr Me 28 i Namo \\APNTLFPS01\proj\B\Boggabri_Coal\ B_Boggabri_Water_Management_Pla\10_GIS\Projects\Drawings_Figures_Sketches\ B_GIS_F008_A3.mxd Author: SuansriR 10/10/ SD3 SD3 Water Balance Catchment Boggabri Coal Mining Tenement EIS Boundary Federal Approval Limit Tarrawonga Mining Lease Boundary Bollol C Year 5 Water Management Clean water drain Dirty water drain Pump pipeline Existing pipeline Water Storages Year 5 Land Use Zones Unshaped Spoil Dump Active Mining Area Cleared/Pre-Stripping Road/Industrial Longterm rehabilitation Stockpiled material km reek [ Undisturbed Tarrawonga Coal Mine Figure 9 Surface Water Monitoring Concept - Year 5

100 BOGGABRI COAL PROJECT SURFACE WATER MANAGEMENT PLAN BOGGABRI COAL PTY 24 k' MW3 3 MW3 G o o nb Frequency based water quality e Cre o ge r 'Na ri Cree k ek SD6 Cre en ow 2 Frequency and event based water quality SD3 yg m 29 0 Ambient water quality and quantity rr Me 28 4 SD13 SD m SD7 Year 10 Surface Water Monitoring Site Event based water quality Mine Infrastructure Rail Loop Fence Year 10 Mine Contours 1 contour oles For operational purposes only (if required) The Slush H SD13 MW5 30 River MW5 SD km Pit Void SD14 SD14 0 m 27 0 SD m SD SD SD SD6 SD10 4 SW1 'Nagero Creek' 47 i Namo \\APNTLFPS01\proj\B\Boggabri_Coal\ B_Boggabri_Water_Management_Pla\10_GIS\Projects\Drawings_Figures_Sketches\ B_GIS_F009_A3.mxd Author: SuansriR 10/10/ m 37 0 SD m 43 0 SD12 41 m SD11 SD3 SD11 2 SD3 Water Balance Catchment Boggabri Coal Mining Tenement EIS Boundary Federal Approval Limit Tarrawonga Mining Lease Boundary Bollol C Year 10 Water Management Clean water drain Dirty water drain Pump pipeline Existing pipeline Water Storages Year 10 Land Use Zones Unshaped Spoil Dump Cleared/Pre-Stripping Road/Industrial Longterm rehabilitation Stockpiled material Undisturbed km reek [ Mining Void Tarrawonga Coal Mine Figure 10 Surface Water Monitoring Concept - Year 10
101 BOGGABRI COAL PROJECT SURFACE WATER MANAGEMENT PLAN BOGGABRI COAL PTY LTD SD23 SD19 3 SD MW5 MW SD21 2 SD SD22 SD24 SD km SD20 m SD8 4 CD8 5 Pit void m Frequency based water quality e Cre k' MW3 3 MW3 G o o nb o ge r 'Na ri Cree k Frequency and event based water quality SD6 ek 2 1 Cre 4 en m 29 0 Ambient water quality and quantity ow Year 21 Surface Water Monitoring Site Event based water quality Mine Infrastructure Rail Loop Fence Year 21 Mine Contours 1 contour oles For operational purposes only (if required) The Slush H SD3 2 yg River 25 rr Me 28 i Namo 26 \\APNTLFPS01\proj\B\Boggabri_Coal\ B_Boggabri_Water_Management_Pla\10_GIS\Projects\Drawings_Figures_Sketches\ B_GIS_F010_A3.mxd Author: SuansriR 10/10/ SD8 CD7 47 CD6 37 SD10 CD5-CD8 CD5 SD6 29 m 43 0 SD6 SD 'Nagero Creek' SD12 m 40 0 SD11 SW1 SD12 4 SD11 SD3 2 SD3 Water Balance Catchment Boggabri Coal Mining Tenement EIS Boundary Federal Approval Limit Tarrawonga Mining Lease Boundary Bollol C Year 21 Water Management Clean water drain Dirty water drain Pump pipeline Existing pipeline Water Storages Year 21 Land Use Zones Unshaped Spoil Dump Road/Industrial Longterm rehabilitation Stockpiled material Undisturbed km reek [ Mining Void Tarrawonga Coal Mine Figure 11 Surface Water Monitoring Concept - Year 21


102 Figure 12a: Locations of Bollol Creek, Nagero Creek, Namoi River (Source: Aurecon, 2013) Figure 12b: Rail spur line and Boggabri rail loop (Source: Aurecon, 2013)


103 Figure 12c: DEM of Nagero Creek Elbow model Figure 12d: 100 year afflux (m) Nagero Creek Elbow flood model (Source: Aurecon, 2013)

104 Figure 12e: 100 year proposed flood extent Nagero Creek at Boggabri Rail Loop (Source: Aurecon, 2013)
105 Appendix B Water quality data extracts sediment dam and SW2 daily BCPL
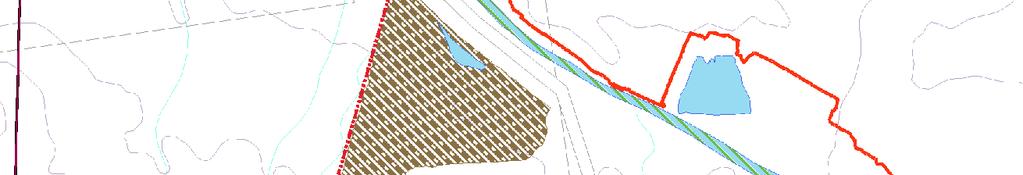


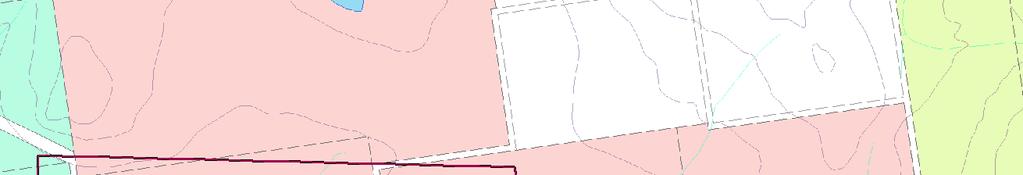

106
107 ALS Laboratory Group Analytical Chemistry Testing Services Date of Sample Time Colliery Site Reference Field ph ph Field EC (µs/cm) Electrical 25 C (µs/cm) Temp Field TSS TSS TDS Oil & Grease Hydroxide Alkalinity as CaCO3 Carbonate Alkalinity as CaCO3 Bicarbonate Alkalinity as CaCO3 Total Alkalinity as CaCO3 Sulfate as SO4 - Turbidimetric Chloride Calcium Magnesium Sodium Potassium 17-Feb-12 10:10 SW Feb-12 15:35 SW <1 17-Feb-12 16:40 SW < <5 <1 < < Feb-12 8:00 SW Feb-12 15:00 SW <5 <1 < Feb-12 17:15 SW Feb-12 8:50 SW Feb-12 15:00 SW <5 312 <5 <1 < Feb-12 17:00 SW Feb-12 9:10 SW Feb-12 12:40 SW <5 <1 < Feb-12 15:45 SW Feb-12 8:40 SW Feb-12 15:30 SW <5 244 <5 <1 < < Feb-12 17:30 SW Feb-12 9:20 SW Feb-12 10:15 SW <5 <1 < < Feb-12 16:00 SW Feb-12 8:40 SW Feb-12 11:05 SW <5 330 <5 <1 < < Feb-12 15:30 SW <1 24-Feb-12 9:40 SW <1 24-Feb-12 13:40 SW Feb-12 19:25 SW <5 322 <5 <1 < < Feb-12 9:50 SW Feb-12 11:30 SW < <5 <1 < < Feb-12 15:35 SW Feb-12 7:35 SW Feb-12 11:40 SW <5 <1 < < Feb-12 15:10 SW Feb-12 9:00 SW Feb-12 11:45 SW <5 <1 < < Feb-12 15:40 SW Feb-12 7:35 SW Feb-12 11:40 SW <1 <5 254 <5 <1 < < Feb-12 15:40 SW <1 29-Feb-12 9:25 SW <1 29-Feb-12 15:50 SW <1 <5 298 <5 <1 < < Mar-12 8:40 SW Mar-12 10:55 SW <5 <1 < < Mar-12 15:30 SW Mar-12 8:20 SW Mar-12 11:50 SW <5 292 <5 <1 < < Mar-12 15:15 SW Mar-12 8:40 SW Mar-12 11:25 SW <5 <1 < < Mar-12 15:20 SW Mar-12 8:30 SW Mar-12 10:20 SW <5 344 <5 <1 < < Mar-12 15:10 SW Mar-12 8:20 SW Mar-12 12:25 SW <5 286 <5 <1 < < Mar-12 15:20 SW Mar-12 9:30 SW <1 06-Mar-12 11:25 SW < <5 <1 < < Mar-12 15:10 SW Mar-12 8:40 SW Mar-12 11:35 SW <5 304 <5 <1 < < Mar-12 15:25 SW Mar-12 8:35 SW <1 08-Mar-12 11:40 SW <5 358 <5 <1 < < Mar-12 15:25 SW Mar-12 9:45 SW <1 09-Mar-12 13:40 SW <1 <5 304 <5 <1 < < Mar-12 16:35 SW <1 10-Mar-12 9:00 SW <1 10-Mar-12 13:00 SW <1 <5 304 <5 <1 < < Mar-12 17:00 SW <1 11-Mar-12 8:20 SW <1 11-Mar-12 12:20 SW <5 288 <5 <1 < < Mar-12 15:30 SW Mar-12 8:35 SW Mar-12 11:45 SW <5 288 <5 <1 < < Mar-12 15:20 SW <1 13-Mar-12 8:20 SW <1 13-Mar-12 11:45 SW <1 <5 344 <5 <1 < < Mar-12 15:20 SW <1 14-Mar-12 7:15 SW <1 14-Mar-12 10:20 SW <5 382 <5 <1 < < Mar-12 14:30 SW <1 1 of 4
108 ALS Laboratory Group Analytical Chemistry Testing Services 15-Mar-12 6:55 SW <1 15-Mar-12 10:30 SW <1 <5 264 <5 <1 < < Mar-12 15:10 SW <1 16-Mar-12 9:30 SW <1 16-Mar-12 12:50 SW <1 <5 318 <5 <1 < < Mar-12 14:00 SW <1 17-Mar-12 9:10 SW Mar-12 12:05 SW <5 256 <5 <1 < < Mar-12 15:35 SW <1 18-Mar-12 8:25 SW Mar-12 11:35 SW <5 300 <5 <1 < < Mar-12 14:15 SW Mar-12 8:35 SW Mar-12 11:30 SW <5 354 <5 <1 < < Mar-12 15:20 SW Mar-12 8:35 SW Mar-12 11:20 SW <5 314 <5 <1 < < Mar-12 15:00 SW Mar-12 8:35 SW Mar-12 11:25 SW <5 350 <5 <1 < < Mar-12 15:10 SW Mar-12 8:35 SW Mar-12 11:25 SW <5 304 <5 <1 < < Mar-12 15:10 SW Mar-12 8:15 SW Mar-12 11:20 SW <5 282 <5 <1 < < Mar-12 15:05 SW Mar-12 8:25 SW Mar-12 11:50 SW <5 362 <5 <1 < < Mar-12 15:10 SW Mar-12 8:25 SW Mar-12 11:25 SW <5 378 <5 <1 < < Mar-12 13:10 SW Mar-12 8:20 SW Mar-12 11:25 SW <5 336 <5 <1 < < Mar-12 15:10 SW Mar-12 8:15 SW Mar-12 11:30 SW <5 <1 < < Mar-12 15:15 SW Mar-12 8:30 SW Mar-12 11:20 SW <5 332 <5 <1 < < Mar-12 15:20 SW of 4
109 ALS Laboratory Group Analytical Chemistry Testing Services Date of Sample Time Arsenic Cadmium Chromium Copper Nickel Lead Zinc Iron Ammonia as N Nitrite as N Nitrate as N Nitrite + Nitrate as N Total Kjeldahl Nitrogen as N Total Nitrogen as N Total Phosphorus as Reactive Phosphorus P as P Total Anions Total Cations 17-Feb-12 10:10 17-Feb-12 15:35 17-Feb-12 16: < < < < Feb-12 8:00 18-Feb-12 15: < < < < Feb-12 17:15 19-Feb-12 8:50 19-Feb-12 15:00 <0.001 < < < <0.01 <0.01 <0.01 < Feb-12 17:00 20-Feb-12 9:10 20-Feb-12 12:40 <0.001 < < <0.01 <0.01 < Feb-12 15:45 21-Feb-12 8:40 21-Feb-12 15: < < < <0.01 <0.01 <0.01 < Feb-12 17:30 22-Feb-12 9:20 22-Feb-12 10: < < < <0.01 <0.01 <0.01 < Feb-12 16:00 23-Feb-12 8:40 23-Feb-12 11: < < < <0.01 <0.01 < Feb-12 15:30 24-Feb-12 9:40 24-Feb-12 13:40 24-Feb-12 19:25 <0.001 < < < <0.01 <0.01 <0.01 < Feb-12 9:50 25-Feb-12 11: < < < < Feb-12 15:35 26-Feb-12 7:35 26-Feb-12 11: < < < <0.01 <0.01 < Feb-12 15:10 27-Feb-12 9:00 27-Feb-12 11: < < < < Feb-12 15:40 28-Feb-12 7:35 28-Feb-12 11: < < < < <0.01 <0.01 <0.01 < Feb-12 15:40 29-Feb-12 9:25 29-Feb-12 15: < < < <0.01 < < Mar-12 8:40 01-Mar-12 10: < < < <0.01 <0.01 <0.01 < < Mar-12 15:30 02-Mar-12 8:20 02-Mar-12 11: < <0.001 < < <0.01 <0.01 <0.01 < < Mar-12 15:15 03-Mar-12 8:40 03-Mar-12 11:25 <0.001 < < < < Mar-12 15:20 04-Mar-12 8:30 04-Mar-12 10: < < < < < Mar-12 15:10 05-Mar-12 8:20 05-Mar-12 12: < < < < Mar-12 15:20 06-Mar-12 9:30 06-Mar-12 11: < < < < Mar-12 15:10 07-Mar-12 8:40 07-Mar-12 11:35 <0.001 < < < <0.01 < Mar-12 15:25 08-Mar-12 8:35 08-Mar-12 11:40 <0.001 < < < <0.01 < Mar-12 15:25 09-Mar-12 9:45 09-Mar-12 13:40 <0.001 < < < <0.01 < Mar-12 16:35 10-Mar-12 9:00 10-Mar-12 13:00 <0.001 < < < < < Mar-12 17:00 11-Mar-12 8:20 11-Mar-12 12:20 <0.001 < < < < < Mar-12 15:30 12-Mar-12 8:35 12-Mar-12 11:45 <0.001 < < < <0.01 < Mar-12 15:20 13-Mar-12 8:20 13-Mar-12 11:45 <0.001 < < < <0.01 < Mar-12 15:20 14-Mar-12 7:15 14-Mar-12 10:20 <0.001 < < < <0.05 <0.01 < Mar-12 14:30 3 of 4
110 ALS Laboratory Group Analytical Chemistry Testing Services 15-Mar-12 6:55 15-Mar-12 10:30 <0.001 < < < <0.01 < < Mar-12 15:10 16-Mar-12 9:30 16-Mar-12 12:50 <0.001 < < < < Mar-12 14:00 17-Mar-12 9:10 17-Mar-12 12: < < < <0.01 <0.01 < Mar-12 15:35 18-Mar-12 8:25 18-Mar-12 11:35 <0.001 < < < <0.01 <0.01 <0.01 < Mar-12 14:15 19-Mar-12 8:35 19-Mar-12 11:30 <0.001 < < < <0.005 < < Mar-12 15:20 20-Mar-12 8:35 20-Mar-12 11:20 <0.001 < <0.001 < <0.001 <0.005 <0.05 <0.01 < Mar-12 15:00 21-Mar-12 8:35 21-Mar-12 11:25 <0.001 < < < <0.005 <0.05 <0.01 < Mar-12 15:10 22-Mar-12 8:35 22-Mar-12 11: < < <0.001 <0.005 < < Mar-12 15:10 23-Mar-12 8:15 23-Mar-12 11: < < < <0.05 <0.01 < Mar-12 15:05 24-Mar-12 8:25 24-Mar-12 11: < < < < Mar-12 15:10 25-Mar-12 8:25 25-Mar-12 11: < < < < Mar-12 13:10 26-Mar-12 8:20 26-Mar-12 11:25 <0.001 < < <0.001 <0.005 <0.05 <0.01 < <0.01 < Mar-12 15:10 27-Mar-12 8:15 27-Mar-12 11: < < <0.001 <0.005 < <0.01 <0.01 < Mar-12 15:15 28-Mar-12 8:30 28-Mar-12 11: < < < <0.005 < < < Mar-12 15:20 4 of 4
111 Analyte/ Parameter ANZECC (2000) guideline SD3 SD6 SD23 24/07/ /03/ /02/ /02/ /02/ /03/ /03/ /03/ /03/ /03/ /07/ /03/ /02/ /02/ /03/ /03/ /03/ /03/ /03/ /03/ /07/2012 Arsenic a < < <0.001 <0.001 < <0.001 Cadmium a < < < < < < < < < < < < < < < < < < < < < Chromium a <0.001 <0.001 <0.001 <0.001 <0.001 <0.001 <0.001 <0.001 <0.001 <0.001 <0.001 <0.001 <0.001 <0.001 <0.001 <0.001 < <0.001 <0.001 <0.001 Copper a <0.001 < < <0.001 <0.001 Lead a <0.001 <0.001 < <0.001 <0.001 <0.001 <0.001 <0.001 <0.001 < <0.001 <0.001 <0.001 < <0.001 <0.001 <0.001 Nickel c < Zinc b <0.005 <0.005 < < Iron 10 c < < < a: ANZECC (2000) guideline for the protection of aquatic ecosystems, slightly to moderately disturbed ecosystem, upland streams. b: ANZECC (2000) guideline for aquatic foods. c: ANZECC (2000) guideline for irrigation water (short term) ND no data *daily was undertaken for the period of 16 th to 29 th February for February 2012 and 1 st to 28 th March for March 2012, so average values have been displayed in the table above. For the average dissolved metals calculation, where recordings have been reported as less than, the value has been havled so that averages could be calculated.
112 Appendix C Summary of storages
113 Table C 1 Summary of Year 0 storages Storage Location / description Stored water Design criteria Dirty water dams SD1 SD3 SD5 SD6 SD23 Sediment dam located in MIA Sediment dam located south-west of spoil dump Sediment dam located in MIA Sediment dam located downstream of MIA (referred to as Nagero Dam) Sediment dam located near topsoil stockpile Contaminated water dams SD2 SD4 MW2 MW3 Contaminated water dam located in MIA Contaminated water dam located at rail loading facility west of mine site Mine water dam located north-west of mining void (turkey s nest dam) Mine water dam located south of MIA Dirty runoff from MIA 90 th %ile 5 day Dirty runoff from spoil dump 90 th %ile 5 day Dirty runoff from MIA 90 th %ile 5 day Runoff from grassed areas near MIA, and overflows from SD1 and SD5 Dirty runoff from topsoil stockpile Contaminated runoff from ROM stockpile Contaminated runoff from existing rail loading facility Contaminated mine water pumped from pit Surplus contaminated water pumped from SD2 and MW2, and clean runoff from small grassed catchment 90 th %ile 5 day 90 th %ile 5 day 100 yr ARI 72 hr 100 yr ARI 72 hr Additional sediment allowance Runoff coefficient Existing catchment area (ha) Required minimum capacity (ML) Existing capacity (ML) Notes 50% Shortfall in storage provided in SD6. SD1 overflows to SD6. 50% 0.4 to % % 0.4 to % % Inadequate capacity to meet design criteria 20% % % (max operating level 105 ML) BCPL
114 Storage Location / description Stored water Design criteria Strip 9 Mine water storage Surplus contaminated water, provided as a backup to MW2 in earlier surplus years In pit void SE corner of site Excess mine water Based on remodelled site water balance (2012) requiring 1012ML of contaminate d water storage for next two years In accordance with EL12407 where benches can be flooded for additional storage Additional sediment allowance Runoff coefficient Existing catchment area (ha) Required minimum capacity (ML) Existing capacity (ML) - 0% ,400ML 0% At least 1,600ML Notes BCPL
115 Table C 2 Summary of proposed Year 1 storages Storage Location / description Stored water Design criteria Additional sediment allowance Runoff coefficient Catchment area (ha) Required minimum capacity (ML) Proposed capacity (ML) Notes Dirty water dams SD3 Sediment dam located southwest of spoil dump Dirty runoff from partially rehabilitated spoil dump 90 th %ile 5 day 50% 0.4 to Existing capacity 35 ML, previously proposed to be upgraded to 100ML in Year 5, now propose to upgrade earlier to account for extra runoff SD6 Sediment dam located downstream of MIA (referred to as Nagero Dam) Runoff from grassed areas near MIA, and overflows from SD1 and SD5 90 th %ile 5 day 50% 0.4 to Existing capacity 55 ML. Catchment size reduced due to SD10 location SD7 Sediment dam located in eastern spoil dump Dirty runoff from spoil dump and clean runoff from undisturbed catchment 90 th %ile 5 day 50% 0.4 to Sized for Year 10 catchment, alternatively could be staged sizing SD8 Sediment dam located in MIA Dirty runoff from MIA 90 th %ile 5 day 50% This catchment area and dam capacity based on currently approved MIA layout. Catchment and capacity may change depending on ultimate MIA & CHPP layout and breakdown SD23 Sediment dam located near topsoil stockpile Dirty runoff from topsoil stockpile 90 th %ile 5 day 50% Catchment and capacity increased since previous SWB due to larger disturbed catchment area in north-west SD27 Sediment dam located near unshaped spoil dump in southwest Dirty runoff from spoil dump 90 th %ile 5 day 50% New sediment dam located by BCPL BCPL
116 Storage Location / description Stored water Design criteria Additional sediment allowance Runoff coefficient Catchment area (ha) Required minimum capacity (ML) Proposed capacity (ML) Notes Contaminated water dams SD10 SD11 SD12 MW2 Contaminated water dam located in CHPP Contaminated water dam located at rail loop Contaminated water dam located in CHPP Mine water dam located northwest of mining void (turkey s nest dam) Contaminated runoff from product coal stockpile Contaminated runoff from rail loop Contaminated runoff from ROM coal stockpile Contaminated water pumped from pit 100yr ARI 72hr 100yr ARI 72hr 100yr ARI 72hr 20% Proposed capacity based on detailed design information from Sedgman. SD10 has included additional storage to provide for all operational capacity for CHPP. Catchment area draining to SD10 may change based on ultimate MIA & CHPP layout and breakdown. 20% Catchment is from Train Load Out (TLO) area and the product stockpile on the southern side of the rail loop. 20% Based on the currently approved MIA & CHPP layout the current catchment draining to SD12 location is larger than what was used in the detailed design for the modification EA and so the dam would be seen as undersized. Final catchments draining to SD12 may change depending on ultimate MIA & CHPP layout and breakdown; however combined capacity of SD10 and SD12 is sufficient to contain excess runoff from SD12 catchment since the two dams are linked via pressure mains. - 0% Existing capacity 175 ML. Excess mine water to be stored in Strip 9 BCPL
117 Storage Location / description MW3 In-pit Strip 9 Mine water dam located south of MIA Temporary segregated in-pit storage (required until additional out-of-pit mine water storage is provided onsite and/or irrigation system) Extra mine water storage for earlier surplus years Stored water Surplus contaminated water pumped from SD2 and MW2, and clean runoff from small grassed catchment Contaminated runoff and groundwater make captured in the mining void sumps Surplus mine water from pit and from MW2 Design criteria Additional sediment allowance Runoff coefficient Catchment area (ha) Required minimum capacity (ML) Proposed capacity (ML) - 0% (max operating level 105 ML) Water balance Notes Existing capacity 161 ML. Excess mine water to be stored in temporary in-pit storage or Strip 9 0% Surplus contaminated water stored in-pit when capacity of MWDs reached. 0% ,400 BCPL
118 Table C 3 Summary of proposed Year 2 storages Storage Location / description Stored water Design criteria Additional sediment allowance Runoff coefficient Catchment area (ha) Required minimum capacity (ML) Proposed capacity (ML) Notes Dirty water dams SD3 Sediment dam located southwest of spoil dump Dirty runoff from partially rehabilitated spoil dump 90 th %ile 5 day 50% 0.4 to Existing capacity 35 ML, previously proposed to be upgraded to 100ML in Year 5, now propose to upgrade earlier to account for extra runoff SD6 Sediment dam located downstream of MIA (referred to as Nagero Dam) Runoff from grassed areas near MIA, and overflows from SD1 and SD5 90 th %ile 5 day 50% 0.4 to Existing capacity 55 ML. Catchment size reduced due to SD10 location SD7 Sediment dam located in eastern spoil dump Dirty runoff from spoil dump and clean runoff from undisturbed catchment 90 th %ile 5 day 50% 0.4 to Sized for Year 10 catchment, alternatively could be staged sizing SD8 Sediment dam located in MIA Dirty runoff from MIA 90 th %ile 5 day 50% This catchment area and dam capacity based on currently approved MIA layout. Catchment and capacity may change depending on ultimate MIA & CHPP layout and breakdown SD23 Sediment dam located near topsoil stockpile Dirty runoff from topsoil stockpile 90 th %ile 5 day 50% Catchment and capacity increased since previous SWB due to larger disturbed catchment area in north-west SD27 Sediment dam located near unshaped spoil dump in southwest Dirty runoff from spoil dump 90 th %ile 5 day 50% New sediment dam located by BCPL BCPL
119 Contaminated water dams SD10 SD11 SD12 MW2 MW3 Contaminated water dam located in CHPP Contaminated water dam located at rail loop Contaminated water dam located in CHPP Mine water dam located northwest of mining void (turkey s nest dam) Mine water dam located south of MIA Contaminated runoff from product coal stockpile Contaminated runoff from rail loop Contaminated runoff from ROM coal stockpile Contaminated water pumped from pit Surplus contaminated water pumped from SD2 and MW2, and clean runoff from small grassed catchment 100yr ARI 72hr 100yr ARI 72hr 100yr ARI 72hr 20% Proposed capacity based on detailed design information from Sedgman. SD10 has included additional storage to provide for all operational capacity for CHPP. Catchment area draining to SD10 may change based on ultimate MIA & CHPP layout and breakdown. 20% Catchment is from Train Load Out (TLO) area and the product stockpile on the southern side of the rail loop. 20% Based on the currently approved MIA & CHPP layout the current catchment draining to SD12 location is larger than what was used in the detailed design for the modification EA and so the dam would be seen as undersized. Final catchments draining to SD12 may change depending on ultimate MIA & CHPP layout and breakdown; however combined capacity of SD10 and SD12 is sufficient to contain excess runoff from SD12 catchment since the two dams are linked via pressure mains. - 0% Existing capacity 175 ML. Excess mine water to be stored in Strip 9-0% (max operating level 105 ML) Existing capacity 161 ML. Excess mine water to be stored in temporary in-pit storage or Strip 9 BCPL
120 In-pit Temporary segregated in-pit storage (required until additional out-of-pit mine water storage is provided onsite and/or irrigation system) Contaminated runoff and groundwater make captured in the mining void sumps Water balance 0% Surplus contaminated water stored in-pit when capacity of MWDs reached Strip 9 Extra mine water storage for earlier surplus years Surplus mine water from pit and from MW2 0% ,400 BCPL
121 Table C 4 Summary of proposed Year 5 storages Storage Location / description Stored water Design criteria Dirty water dams SD3 SD6 SD7 SD8 SD23 SD27 Sediment dam located south-west of spoil dump Sediment dam located downstream of MIA (Nagero Dam) Sediment dam located in eastern spoil dump Sediment dam located in MIA Sediment dam located near topsoil stockpile Sediment dam located near unshaped spoil dump in south-west Dirty runoff from partially rehabilitated spoil dump Runoff from grassed areas near MIA, and overflows from SD8 Dirty runoff from spoil dump and clean runoff from undisturbed catchment Dirty runoff from MIA Dirty runoff from topsoil stockpile Dirty runoff from spoil dump 90 th %ile 5 day 90 th %ile 5 day 90 th %ile 5 day 90 th %ile 5 day 90 th %ile 5 day 90 th %ile 5 day Additional sediment allowance Runoff coefficient Catchment area (ha) Required minimum capacity (ML) Proposed capacity (ML) Notes 50% 0.4 to Existing capacity 35 ML, previously proposed to be upgraded to 100ML in Year 5, now propose to upgrade earlier to account for extra runoff 50% Existing capacity 55 ML. Catchment size reduced due to SD10 location 50% 0.4 to Sized for Year 10 catchment, alternatively could be staged sizing 50% This catchment area and dam capacity based on currently approved MIA layout. Catchment and capacity may change depending on ultimate MIA & CHPP layout and breakdown 50% Catchment and capacity increased since previous SWB due to larger disturbed catchment area in northwest 50% BCPL
122 Storage Location / description Stored water Design criteria Additional sediment allowance Runoff coefficient Catchment area (ha) Required minimum capacity (ML) Proposed capacity (ML) Notes Contaminated water dams SD10 Contaminated water dam located in CHPP Contaminated runoff from product coal stockpile 100yr ARI 72hr 20% Proposed capacity based on detailed design information from Sedgman. SD10 has included additional storage to provide for all operational capacity for CHPP. Catchment area draining to SD10 may change based on ultimate MIA & CHPP layout and breakdown. SD11 Contaminated water dam located at rail loop Contaminated runoff from rail loop 100yr ARI 72hr 20% Catchment is from Train Load Out (TLO) area and the product stockpile on the southern side of the rail loop. SD12 Contaminated water dam located in CHPP Contaminated runoff from ROM coal stockpile 100yr ARI 72hr 20% Based on the currently approved MIA & CHPP layout the current catchment draining to SD12 location is larger than what was used in the detailed design for the modification EA and so the dam would be seen as undersized. Final catchments draining to SD12 may change depending on ultimate MIA & CHPP layout and breakdown; however combined capacity of SD10 and SD12 is sufficient to contain excess runoff from SD12 catchment since the two dams are linked via pressure mains. MW5 Mine water dam (turkey s nest dam inside box cut ) Contaminated water pumped from pit Water balance 0% ,800 BCPL
123 Storage Location / description Stored water Design criteria MW3 In-pit Mine water dam located south of MIA In-pit storage during wet periods Surplus contaminated water, sediment dam water for reuse Contaminated runoff and groundwater make captured in the mining void sumps Water balance Water balance Additional sediment allowance Runoff coefficient Catchment area (ha) Required minimum capacity (ML) 0% Proposed capacity (ML) Up to 861 ML (refer to SWB) Notes Surplus contaminated water stored in-pit when capacity of MWDs reached BCPL
124 Table C 5 Summary of proposed Year 10 storages Storage Location / description Stored water Design criteria Dirty water dams SD3 SD6 SD7 SD8 SD13 SD14 SD23 Sediment dam located south-west of spoil dump Sediment dam located downstream of MIA (Nagero Dam) Sediment dam located in eastern spoil dump Sediment dam located in MIA Sediment dam located in spoil dump Sediment dam located in pre-strip Sediment dam located near topsoil stockpile Runoff from rehabilitated spoil dump Runoff from grassed areas near MIA, and overflows from SD8 Dirty runoff from spoil dump and clean runoff from undisturbed catchment 90 th %ile 5 day 90 th %ile 5 day 90 th %ile 5 day Dirty runoff from MIA 90 th %ile 5 day Dirty runoff from spoil dump and overflows from SD7 Dirty runoff from cleared area ahead of mining Dirty runoff from topsoil stockpile 90 th %ile 5 day 90 th %ile 5 day 90 th %ile 5 day Additional sediment allowance Runoff coefficient Catchment area (ha) Required minimum capacity (ML) Proposed capacity (ML) Notes 50% Sized for Year 1 catchment 50% Existing capacity 55 ML 50% 0.4 to % This catchment area and dam capacity based on currently approved MIA layout. Catchment and capacity may change depending on ultimate MIA & CHPP layout and breakdown 50% % % Sized for Year 1 catchment BCPL
125 Contaminated water dams SD10 Contaminated water dam located in CHPP Contaminated runoff from product coal stockpile 100yr ARI 72hr 20% Proposed capacity based on detailed design information from Sedgman. SD10 has included additional storage to provide for all operational capacity for CHPP. Catchment area draining to SD10 may change based on ultimate MIA & CHPP layout and breakdown. SD11 Contaminated water dam located at rail loop Contaminated runoff from rail loop 100yr ARI 72hr 20% Catchment is from Train Load Out (TLO) area and the product stockpile on the southern side of the rail loop. SD12 Contaminated water dam located in CHPP Contaminated runoff from ROM coal stockpile 100yr ARI 72hr 20% Based on the currently approved MIA & CHPP layout the current catchment draining to SD12 location is larger than what was used in the detailed design for the modification EA and so the dam would be seen as undersized. Final catchments draining to SD12 may change depending on ultimate MIA & CHPP layout and breakdown; however combined capacity of SD10 and SD12 is sufficient to contain excess runoff from SD12 catchment since the two dams are linked via pressure mains. MW5 Mine water dam (turkey s nest dam) Contaminated water pumped from pit Water balance 0% MW3 Mine water dam located south of MIA Surplus contaminated water, sediment dam water for reuse Water balance 0% BCPL
126 In-pit In-pit storage during wet periods Contaminated runoff and groundwater make captured in the mining void sumps Water balance Up to 861 ML (refer to SWB) Surplus contaminated water stored in-pit when capacity of MWDs reached BCPL
127 Table C 6 Summary of proposed Year 21 storages Storage Location / description Dirty water dams SD3 SD6 SD8 SD19 SD20 SD21 SD22 SD23 Sediment dam located south-west of spoil dump Sediment dam located downstream of MIA (Nagero Dam) Sediment dam located in MIA Sediment dam located in spoil dump Sediment dam located in spoil dump Sediment dam located in spoil dump Sediment dam located in spoil dump Sediment dam located near topsoil stockpile Stored water Design criteria Additional sediment allowance Runoff from rehabilitated spoil dump Runoff from grassed areas near MIA, and overflows from SD8 Runoff coefficient Catchment area (ha) Required minimum capacity (ML) Proposed capacity (ML) Notes 90 th %ile 5 day 50% Sized for Year 1 catchment 90 th %ile 5 day 50% Existing capacity 55 ML Dirty runoff from MIA 90 th %ile 5 day 50% This catchment area and dam capacity based on currently approved MIA layout. Catchment and capacity may change depending on ultimate MIA & CHPP layout and breakdown Runoff from recently rehabilitated spoil dump and overflows from SD20 Dirty runoff from spoil dump Dirty runoff from spoil dump Dirty runoff from spoil dump Dirty runoff from topsoil stockpile 90 th %ile 5 day 50% th %ile 5 day 50% th %ile 5 day 50% th %ile 5 day 50% th %ile 5 day 50% Sized for Year 1 catchment BCPL
128 Storage Location / description SD24 BCPL Sediment dam located in spoil dump Contaminated water dams SD10 SD11 SD12 MW5 Contaminated water dam located in CHPP Contaminated water dam located at rail loop Contaminated water dam located in CHPP Mine water dam (turkey s nest dam) Stored water Design criteria Additional sediment allowance Dirty runoff from spoil dump Contaminated runoff from product coal stockpile Contaminated runoff from rail loop Contaminated runoff from ROM coal stockpile Contaminated water pumped from pit Runoff coefficient Catchment area (ha) Required minimum capacity (ML) 90 th %ile 5 day 50% Proposed capacity (ML) 100yr ARI 72hr 20% Proposed capacity based on detailed design information from Sedgman. SD10 has included additional storage to provide for all operational capacity for CHPP. Catchment area draining to SD10 may change based on ultimate MIA & CHPP layout and breakdown. 100yr ARI 72hr 20% Catchment is from Train Load Out (TLO) area and the product stockpile on the southern side of the rail loop. 100yr ARI 72hr 20% Based on the currently approved MIA & CHPP layout the current catchment draining to SD12 location is larger than what was used in the detailed design for the modification EA and so the dam would be seen as undersized. Final catchments draining to SD12 may change depending on ultimate MIA & CHPP layout and breakdown; however combined capacity of SD10 and SD12 is sufficient to contain excess runoff from SD12 catchment since the two dams are linked via pressure mains. Water balance 0% Notes
129 Storage Location / description MW3 In-pit Clean water dams CD5 CD6 CD7 CD8 Mine water dam located south of MIA In-pit storage during wet periods Highwall dam located ahead of pit Highwall dam located ahead of pit Highwall dam located ahead of pit Highwall dam located ahead of pit Stored water Design criteria Additional sediment allowance Surplus contaminated water, sediment dam water for reuse Contaminated runoff and groundwater make captured in the mining void sumps Undisturbed catchment runoff Undisturbed catchment runoff Undisturbed catchment runoff Undisturbed catchment runoff Runoff coefficient Catchment area (ha) Required minimum capacity (ML) Water balance 0% Proposed capacity (ML) Water balance Up to 861 ML (refer to SWB) 100yr ARI 72hr 0% yr ARI 72hr 0% yr ARI 72hr 0% yr ARI 72hr 0% Notes Surplus contaminated water stored in-pit when capacity of MWDs reached BCPL
130 Appendix D Proposed points for Years 1, 2, 5, 10, 21
131 Table D 1 Summary of points in Year 0 EPL number 1 Monitoring point / discharge point type Discharge points Point 3 Point 1 Point 40 Point 2 Point 4 Discharge water quality and Wet weather discharge (>90 th percentile 5 day event) Discharge water quality and Wet weather discharge (>90 th percentile 5 day event) Discharge water quality and Wet weather discharge (>90 th percentile 5 day event) Wet weather discharge (>100yr ARI 72hr design event) Wet weather discharge (>100yr ARI 72hr design event) Storage Location / description Stored water SD3 SD6 SD23 SD2 SD4 Sediment dam located south-west of spoil dump Sediment dam located downstream of MIA Sediment dam located near topsoil stockpile Contaminated water dam located in existing coal crushing and handling area Contaminated water dam located at rail loading facility west of mine site Point 46 Discharge to waters - Outlet from sediment basins - Surface water quality points Point 38 Point 36 Point 42 Point 39 Point 37 Point 19 Point 41 Point 20 Surface water quality Surface water quality Surface water quality Surface water quality Surface water quality Surface water quality Surface water quality Surface water quality Ambient water quality points 5 Ambient water quality 6 Ambient water quality SD3 SD6 SD23 SD4 SD2 MW2 MW3 Sediment dam located south-west of spoil dump Sediment dam located downstream of MIA (referred to as Nagero Dam) Sediment dam located near topsoil stockpile Contaminated water dam located at rail loading facility west of mine site Contaminated water dam located in existing coal crushing and handling area Mine water dam located north-west of mining void (turkey s nest dam) Mine water dam located south of MIA Dirty runoff from partially rehabilitated spoil dump Runoff from grassed areas near MIA, and overflows from MIA sed dams Dirty runoff from topsoil stockpile Contaminated runoff from ROM stockpile Contaminated runoff from existing rail loading facility Dirty runoff from partially rehabilitated spoil dump Runoff from grassed areas near MIA, and overflows from SD1 and SD5 Dirty runoff from topsoil stockpile Contaminated runoff from existing rail loading facility Contaminated runoff from ROM stockpile Contaminated water pumped from pit Surplus contaminated water pumped from SD2 and MW2, and clean runoff from small grassed catchment Pit void Pit void Contaminated runoff and groundwater make SW1 SW2 Nagero Creek downstream of mine site Nagero Creek upstream of mine site Surface water quality of water stored in SD1 and SD5 is proposed for operational purposes only, as these dams discharge to a downstream dam. Monitoring is not required by EPL
132 Table D 2 Summary of proposed points for Year 1 EPL number Monitoring point / discharge point type Discharge points Point 3 Point 1 Point 40 Point 4 TBA TBA TBA TBA TBA Discharge water quality and Wet weather discharge Discharge water quality and Wet weather discharge Discharge water quality and Wet weather discharge Wet weather discharge (>100yr ARI 72hr design event) Discharge water quality Discharge water quality Wet weather discharge (>100yr ARI 72hr design event) Wet weather discharge (>100yr ARI 72hr design event) Wet weather discharge (>100yr ARI 72hr design event) Storage Location / description Stored water SD3 SD6 SD23 SD4 SD7 SD27 SD10 SD11 SD12 Sediment dam located south-west of spoil dump Sediment dam located downstream of MIA (Nagero Dam) Sediment dam located near topsoil stockpile Contaminated water dam located in existing cola crushing and handling area 15km wets of mine site Sediment dam located in eastern spoil dump Sediment dam located near unshaped spoil dump in south-west Contaminated water dam located in CHPP Contaminated water dam located at rail loop Contaminated water dam located in CHPP Point 46 Discharge to waters - Outlet from sediment basins - Surface water quality points Point 38 Point 36 Point 42 Point 39 Point 19 Surface water quality Surface water quality Surface water quality Surface water quality Surface water quality SD3 SD6 SD23 SD4 MW2 Sediment dam located south-west of spoil dump Sediment dam located downstream of MIA (referred to as Nagero Dam) Sediment dam located near topsoil stockpile Contaminated water dam located at rail loading facility west of mine site Mine water dam located north-west of mining void (turkey s nest dam) Dirty runoff from partially rehabilitated spoil dump Runoff from grassed areas near MIA, and overflows from SD8 Dirty runoff from topsoil stockpile Contaminated runoff from ROM stockpiles Dirty runoff from spoil dump and clean runoff from undisturbed catchment Dirty runoff from spoil dump Contaminated runoff from product coal stockpile Contaminated runoff from TLO and product stockpile on southern side of rail loop Contaminated runoff from ROM coal stockpile Dirty runoff from partially rehabilitated spoil dump Runoff from grassed areas near MIA, and overflows from SD1 and SD5 Dirty runoff from topsoil stockpile Contaminated runoff from existing rail loading facility Contaminated water pumped from pit
133 EPL number 1 Point 41 TBA TBA TBA TBA TBA TBA 1 Point 20 Monitoring point / discharge point type Surface water quality Surface water quality Surface water quality Surface water quality Surface water quality Surface water quality Surface water quality (required for operational purposes only) Surface water quality Ambient water quality points 5 Ambient water quality 6 Ambient water quality Storage Location / description Stored water MW3 SD7 SD27 SD10 SD11 SD12 SD8 Mine water dam located south of MIA Sediment dam located in eastern spoil dump Sediment dam located near unshaped spoil dump in south-west Contaminated water dam located in CHPP Contaminated water dam located at rail loop Contaminated water dam located in CHPP Sediment dam located in MIA Surplus contaminated water pumped from SD2 and MW2, and clean runoff from small grassed catchment Dirty runoff from spoil dump and clean runoff from undisturbed catchment Dirty runoff from spoil dump Contaminated runoff from product coal stockpile Contaminated runoff from TLO and product stockpile on southern side of rail loop Contaminated runoff from ROM coal stockpile Dirty runoff from MIA Pit void Pit void Contaminated runoff and groundwater make SW1 SW2 Nagero Creek downstream of mine site Nagero Creek upstream of mine site Surface water quality of water stored in SD8 is proposed for operational purposes only, as SD8 discharges to a downstream dam. Monitoring would not be required by EPL
134 Table D 3 Summary of proposed points for Year 2 EPL number Monitoring point / discharge point type Discharge points Point 3 Point 1 Point 40 Point 4 TBA TBA TBA TBA TBA Discharge water quality and Wet weather discharge Discharge water quality and Wet weather discharge Discharge water quality and Wet weather discharge Wet weather discharge (>100yr ARI 72hr design event) Discharge water quality Discharge water quality Wet weather discharge (>100yr ARI 72hr design event) Wet weather discharge (>100yr ARI 72hr design event) Wet weather discharge (>100yr ARI 72hr design event) Storage Location / description Stored water SD3 SD6 SD23 SD4 SD7 SD27 SD10 SD11 SD12 Sediment dam located south-west of spoil dump Sediment dam located downstream of MIA (Nagero Dam) Sediment dam located near topsoil stockpile Contaminated water dam located in existing cola crushing and handling area 15km wets of mine site Sediment dam located in eastern spoil dump Sediment dam located near unshaped spoil dump in south-west Contaminated water dam located in CHPP Contaminated water dam located at rail loop Contaminated water dam located in CHPP Point 46 Discharge to waters - Outlet from sediment basins - Surface water quality points Point 38 Point 36 Point 42 Point 39 Point 19 Point 41 TBA Surface water quality Surface water quality Surface water quality Surface water quality Surface water quality Surface water quality Surface water quality SD3 SD6 SD23 SD4 MW2 MW3 SD7 Sediment dam located south-west of spoil dump Sediment dam located downstream of MIA (referred to as Nagero Dam) Sediment dam located near topsoil stockpile Contaminated water dam located at rail loading facility west of mine site Mine water dam located north-west of mining void (turkey s nest dam) Mine water dam located south of MIA Sediment dam located in eastern spoil dump Dirty runoff from partially rehabilitated spoil dump Runoff from grassed areas near MIA, and overflows from SD8 Dirty runoff from topsoil stockpile Contaminated runoff from ROM stockpiles Dirty runoff from spoil dump and clean runoff from undisturbed catchment Dirty runoff from spoil dump Contaminated runoff from product coal stockpile Contaminated runoff from TLO and product stockpile on southern side of rail loop Contaminated runoff from ROM coal stockpile Dirty runoff from partially rehabilitated spoil dump Runoff from grassed areas near MIA, and overflows from SD1 and SD5 Dirty runoff from topsoil stockpile Contaminated runoff from existing rail loading facility Contaminated water pumped from pit Surplus contaminated water pumped from SD2 and MW2, and clean runoff from small grassed catchment Dirty runoff from spoil dump and clean runoff from undisturbed catchment
135 EPL number 1 TBA TBA TBA TBA TBA 1 Point 20 Monitoring point / discharge point type Surface water quality Surface water quality Surface water quality Surface water quality Surface water quality (required for operational purposes only) Surface water quality Ambient water quality points 5 Ambient water quality 6 Ambient water quality Storage Location / description Stored water SD27 SD10 SD11 SD12 SD8 Sediment dam located near unshaped spoil dump in south-west Contaminated water dam located in CHPP Contaminated water dam located at rail loop Contaminated water dam located in CHPP Sediment dam located in MIA Dirty runoff from spoil dump Contaminated runoff from product coal stockpile Contaminated runoff from TLO and product stockpile on southern side of rail loop Contaminated runoff from ROM coal stockpile Dirty runoff from MIA Pit void Pit void Contaminated runoff and groundwater make SW1 SW2 Nagero Creek downstream of mine site Nagero Creek upstream of mine site Surface water quality of water stored in SD8 is proposed for operational purposes only, as SD8 discharges to a downstream dam. Monitoring would not be required by EPL
136 Table D 4 Summary of proposed points for Year 5 EPL number Monitoring point / discharge point type Discharge points Point 3 Point 1 Point 40 TBA TBA TBA TBA TBA Discharge water quality and Wet weather discharge Discharge water quality and Wet weather discharge Discharge water quality and Wet weather discharge Discharge water quality Discharge water quality Wet weather discharge (>100yr ARI 72hr design event) Wet weather discharge (>100yr ARI 72hr design event) Wet weather discharge (>100yr ARI 72hr design event) Storage Location / description Stored water SD3 SD6 SD23 SD27 SD7 SD10 SD11 SD12 Sediment dam located south-west of spoil dump Sediment dam located downstream of MIA (Nagero Dam) Sediment dam located near topsoil stockpile Sediment dam located near unshaped spoil dump in south-west Sediment dam located in eastern spoil dump Contaminated water dam located in CHPP Contaminated water dam located at rail loop Contaminated water dam located in CHPP Point 46 Discharge to waters - Outlet from sediment basins - Surface water quality points Point 38 Point 36 TBA NA 1 Point 42 TBA TBA TBA TBA Surface water quality Surface water quality Surface water quality Surface water quality (required for operational purposes only) Surface water quality Surface water quality Surface water quality Surface water quality Surface water quality SD3 SD6 SD7 SD8 SD23 SD10 SD11 SD12 SD27 Sediment dam located south-west of spoil dump Sediment dam located downstream of MIA (referred to as Nagero Dam) Sediment dam located in eastern spoil dump Sediment dam located in MIA Sediment dam located near topsoil stockpile Contaminated water dam located in CHPP Contaminated water dam located at rail loop Contaminated water dam located in CHPP Sediment dam located near unshaped spoil dump in south-west Dirty runoff from partially rehabilitated spoil dump Runoff from grassed areas near MIA, and overflows from SD8 Dirty runoff from topsoil stockpile Dirty runoff from spoil dump Dirty runoff from spoil dump and clean runoff from undisturbed catchment Contaminated runoff from product coal stockpile Contaminated runoff from TLO and product stockpile on southern side of rail loop Contaminated runoff from ROM coal stockpile Dirty runoff from partially rehabilitated spoil dump Runoff from grassed areas near MIA, and overflows from SD8 Dirty runoff from spoil dump and clean runoff from undisturbed catchment Dirty runoff from MIA Dirty runoff from topsoil stockpile Contaminated runoff from product coal stockpile Contaminated runoff from TLO and product stockpile on southern side of rail loop Contaminated runoff from ROM coal stockpile Dirty runoff from spoil dump
137 EPL number 1 TBA Point 41 Point 20 Monitoring point / discharge point type Surface water quality Surface water quality Surface water quality Ambient water quality points 5 Ambient water quality 6 Ambient water quality Storage Location / description Stored water MW5 MW3 Mine water dam (turkey s nest dam) Mine water dam located south of MIA Contaminated water pumped from pit Surplus contaminated water, sediment dam water for reuse Pit void Pit void Contaminated runoff and groundwater make SW1 SW2 Nagero Creek downstream of mine site Nagero Creek upstream of mine site Surface water quality of water stored in SD8 is proposed for operational purposes only, as SD8 discharges to a downstream dam. Monitoring would not be required by EPL
138 Table D 5 Summary of proposed points for Year 10 EPL number Monitoring point / discharge point type Discharge points Point 3 Point 1 Point 40 1 Point 40 1 TBA TBA TBA TBA TBA Discharge water quality and Wet weather discharge (>90 th percentile 5 day event) Discharge water quality and Wet weather discharge (>90 th percentile 5 day event) Discharge water quality and Wet weather discharge (>90 th percentile 5 day event) Discharge water quality and Wet weather discharge (>90 th percentile 5 day event) Discharge water quality and Wet weather discharge (>90 th percentile 5 day event) Discharge water quality Wet weather discharge (>100yr ARI 72hr design event) Wet weather discharge (>100yr ARI 72hr design event) Wet weather discharge (>100yr ARI 72hr design event) Storage Location / description Stored water SD3 SD6 SD23 SD13 SD14 SD7 SD10 SD11 SD12 Sediment dam located south-west of spoil dump Sediment dam located downstream of MIA Sediment dam located near topsoil stockpile Sediment dam located in spoil dump Sediment dam located in pre-strip Sediment dam located in eastern spoil dump Contaminated water dam located in CHPP Contaminated water dam located at rail loop Contaminated water dam located in CHPP Point 46 Discharge to waters - Outlet from sediment basins - Surface water quality points Point 38 Point 36 TBA NA 2 TBA TBA Surface water quality Surface water quality Surface water quality Surface water quality (required for operational purposes only) Surface water quality Surface water quality SD3 SD6 SD7 SD8 SD13 SD14 Sediment dam located south-west of spoil dump Sediment dam located downstream of MIA (referred to as Nagero Dam) Sediment dam located in eastern spoil dump Sediment dam located in MIA Sediment dam located in spoil dump Sediment dam located in pre-strip Dirty runoff from partially rehabilitated spoil dump Runoff from grassed areas near MIA, and overflows from SD8 Dirty runoff from topsoil stockpile Dirty runoff from spoil dump and overflows from SD7 Dirty runoff from cleared area ahead of mining Dirty runoff from spoil dump and clean runoff from undisturbed catchment Contaminated runoff from product coal stockpile Contaminated runoff from TLO and product stockpile on southern side of rail loop Contaminated runoff from ROM coal stockpile Dirty runoff from partially rehabilitated spoil dump Runoff from grassed areas near MIA, and overflows from SD8 Dirty runoff from spoil dump and clean runoff from undisturbed catchment Dirty runoff from MIA Dirty runoff from spoil dump and overflows from SD7 Dirty runoff from cleared area ahead of mining
139 EPL number 1 2 Point 42 TBA TBA TBA TBA Point 41 Point 20 Monitoring point / discharge point type Surface water quality Surface water quality Surface water quality Surface water quality Surface water quality Surface water quality Surface water quality Ambient water quality points 5 Ambient water quality Storage Location / description Stored water SD23 SD10 SD11 SD12 MW5 MW3 Sediment dam located near topsoil stockpile Contaminated water dam located in CHPP Contaminated water dam located at rail loop Contaminated water dam located in CHPP Mine water dam (turkey s nest dam) Mine water dam located south of MIA Dirty runoff from topsoil stockpile Contaminated runoff from product coal stockpile Contaminated runoff from TLO and product stockpile on southern side of rail loop Contaminated runoff from ROM coal stockpile Contaminated water pumped from pit Surplus contaminated water, sediment dam water for reuse Pit void Pit void Contaminated runoff and groundwater make MW1 Nagero Creek downstream of mine site Proposed to combine discharge points for SD23 and SD13 at EPL Point 40. Surface water quality of water stored in SD8 is proposed for operational purposes only, as SD8 discharges to a downstream dam. Monitoring would not be required by EPL
140 Table D 6 Summary of proposed points for Year 21 EPL number Monitoring point / discharge point type Discharge points Point 3 Point 1 Point 40 1 Point 40 1 TBA TBA TBA TBA TBA TBA TBA Discharge water quality and Wet weather discharge (>90 th percentile 5 day event) Discharge water quality and Wet weather discharge (>90 th percentile 5 day event) Discharge water quality and Wet weather discharge (>90 th percentile 5 day event) Discharge water quality and Wet weather discharge (>90 th percentile 5 day event) Discharge water quality and Wet weather discharge (>90 th percentile 5 day event) Discharge water quality and Wet weather discharge (>90 th percentile 5 day event) Discharge water quality and Wet weather discharge (>90 th percentile 5 day event) Discharge water quality Wet weather discharge (>100yr ARI 72hr design event) Wet weather discharge (>100yr ARI 72hr design event) Wet weather discharge (>100yr ARI 72hr design event) Storage Location / description Stored water SD3 SD6 SD23 SD19 SD21 SD22 SD24 CD5, CD6, CD7 and CD8 SD10 SD11 SD12 Sediment dam located south-west of spoil dump Sediment dam located downstream of MIA Sediment dam located near topsoil stockpile Sediment dam located in spoil dump Sediment dam located in spoil dump Sediment dam located in spoil dump Sediment dam located in spoil dump Highwall dams located ahead of pit Contaminated water dam located in CHPP Contaminated water dam located at rail loop Contaminated water dam located in CHPP Point 46 Discharge to waters - Outlet from sediment basins - Surface water quality points Point 38 Point 36 Surface water quality Surface water quality SD3 SD6 Sediment dam located south-west of spoil dump Sediment dam located downstream of MIA (referred to as Nagero Dam) Dirty runoff from partially rehabilitated spoil dump Runoff from grassed areas near MIA, and overflows from SD8 Dirty runoff from topsoil stockpile Runoff from recently rehabilitated spoil dump and overflows from SD20 Dirty runoff from spoil dump Dirty runoff from spoil dump Dirty runoff from spoil dump Clean runoff from undisturbed catchment Contaminated runoff from product coal stockpile Contaminated runoff from TLO and product stockpile on southern side of rail loop Contaminated runoff from ROM coal stockpile Dirty runoff from partially rehabilitated spoil dump Runoff from grassed areas near MIA, and overflows from SD8
141 EPL number NA TBA NA TBA TBA TBA Point 42 TBA TBA TBA TBA Point 41 Point 20 Monitoring point / discharge point type Surface water quality (required for operational purposes only) Surface water quality Surface water quality (required for operational purposes only) Surface water quality Surface water quality Surface water quality Surface water quality Surface water quality Surface water quality Surface water quality Surface water quality Surface water quality Surface water quality Ambient water quality points Ambient water quality Storage Location / description Stored water SD8 SD19 SD20 SD21 SD22 SD24 SD23 SD10 SD11 SD12 MW5 MW3 Sediment dam located in MIA Sediment dam located in spoil dump Sediment dam located in spoil dump Sediment dam located in spoil dump Sediment dam located in spoil dump Sediment dam located in spoil dump Sediment dam located near topsoil stockpile Contaminated water dam located in CHPP Contaminated water dam located at rail loop Contaminated water dam located in CHPP Mine water dam (turkey s nest dam) Mine water dam located south of MIA Dirty runoff from MIA Runoff from recently rehabilitated spoil dump and overflows from SD20 Dirty runoff from spoil dump Dirty runoff from spoil dump Dirty runoff from spoil dump Dirty runoff from spoil dump Dirty runoff from topsoil stockpile Contaminated runoff from product coal stockpile Contaminated runoff from TLO and product stockpile on southern side of rail loop Contaminated runoff from ROM coal stockpile Contaminated water pumped from pit Surplus contaminated water, sediment dam water for reuse Pit void Pit void Contaminated runoff and groundwater make SW1 Nagero Creek downstream of mine site Proposed to combine discharge points for SD23 and SD19 at EPL Point 40. Surface water quality of water stored in SD8 and SD20 is proposed for operational purposes only, as SD8 and SD20 discharge to downstream dams. Monitoring would not be required by EPL
142 Appendix E Sediment and Erosion Control maintenance and inspection
143 Maintenance and inspection The Blue Book Managing Urban Stormwater, Volume 2E: Mines and Quarries (DECC, 2008) recommends that erosion and sediment control measures should be inspected daily, with maintenance and modification as necessary, together with more intense inspection and maintenance regimes during periods of wet weather and wet-weather clean-up. Arrangements also need to be made for inspection and maintenance during industry shutdowns for weekends and holidays (e.g. Christmas and Easter), particularly if rainfall is predicted or there is predictable seasonal rainfall. A priority system for repairs and maintenance following large storms should be developed. This should initially focus on restoring controls in high erosion-risk areas which may impact on sensitive receiving environments, followed by restoration of controls in other areas. Due to the longer operational life of many erosion and sediment controls relative to urban subdivision construction (outlined in vol. 1), additional maintenance is often required for longterm controls. For example: erosion and sediment control measures should be maintained in a functioning condition until individual areas have been revegetated structures for diverting and conveying runoff should be inspected after significant storms so that sediment can be removed and damaged works promptly repaired and/or replaced inflow points and outflow structures (e.g. riser pipes and spillways) to sediment basins should be inspected after major storms and repaired as necessary. The construction and mining contractors are required to establish and implement a and inspection program of the erosion and sediment controls to ensure appropriate installation and operational control. The contractor program is outlined in Table E-1. Table E-1 Contractor program Monitoring program Frequency Responsibility Monitor rainfall onsite Daily Construction and Mining Contractor Monitor condition of soil and water management structures Volumes of water discharged from any sediment basins/structures Monitor clean, dirty and contaminated water quality. Obtain water samples for analysis to determine appropriate disposal option Daily Daily As required Construction and Mining Contractor Construction and Mining Contractor Construction and Mining Contractor The construction and mining contractors are required to complete a series of inspections to ensure the implementation of the agreed control measures. The inspection program is outlined in Table E-2.
144 Table E-2 Inspection program Inspection program Frequency Responsibility Inspect existing drainage lines/gullies adjacent to or within the Contractors worksite area Monitor sediment controls, silt fences and traps within the contractors worksite area and assess whether the installations are operating effectively Monitor the potential for dust nuisance from site haul roads and assesses whether dust control measures are sufficient and monitor their implementation Monitor potential for dust nuisance from stockpiles and assess whether dust control measures are sufficient and monitor their implementation Monitor encroachment of stockpiles on waterways and gullies Inspect contractors fuel and material storage areas and check these are appropriately designed Monitor/inspect water discharges from Contractors worksite area for visual contamination (TDS, fuel etc.) Inspection of sediment dams if ELP conditions are not met after a 5 day period, flocculants should be used to promote sedimentation Weekly Weekly or immediately after rainfall Daily Daily Daily Weekly Daily Before a discharge Environment Superintendent, Construction and Mining Contractors Environment Superintendent, Construction and Mining Contractors Environment Superintendent, Construction and Mining Contractors Environment Superintendent, Construction and Mining Contractors Environment Superintendent, Construction and Mining Contractors Environment Superintendent, Construction and Mining Contractors Environment Superintendent, Construction and Mining Contractors Environment Superintendent, Construction and Mining Contractors Maintenance of sediment dams Sediment dams at Boggabri Coal Mine should be maintained so that sediment does not build up in excess of the allowed sedimentation zone, so that the chance of overflow can be minimised. Sediment dams should be inspected and desilted regularly to maintain the sedimentation zone within the basin. The frequency of removal of sediment depends on the sediment type, size and the type of flocculants used on site. As a first estimate, sediment basins should be desilted at least every 2 months. Flocculants are currently used on site for the removal of suspended solids so that EPL discharge conditions are met.
145 Appendix F Sampling methods
146 1 Details on sampling methods to be adopted for the program are set out in Section M2 of the EPL and are listed in Table F-1 below: Table F-1 Surface water sampling methods Year 1 EPL Point Location Location Description Sampling method Ambient Point 5 SW1 Nagero Creek downstream Grab sample, ph in situ, flow in situ Point 6 SW2 Nagero Creek upstream Grab sample, ph in situ, flow in situ Event based Point 1 SD6 Nagero Dam Grab sample with conductivity and ph in situ Point 3 SD3 South west corner of spoil dump Point 4 SD4 Rail loop 15 km west of mine site Grab sample with conductivity and ph in situ Grab sample with conductivity and ph in situ Point 40 SD23 Topsoil stockpile Grab sample with conductivity and ph in situ TBA SD7 Sediment dam located in eastern spoil dump TBA SD27 Sediment dam located near unshaped spoil dump in southwest TBA SD10 Contaminated water dam located in CHPP TBA SD11 Contaminated runoff from TLO and product stockpile TBA SD12 Contaminated water dam located in CHPP Frequency based Grab sample with conductivity and ph in situ Grab sample with conductivity and ph in situ Grab sample with conductivity and ph in situ Grab sample with conductivity and ph in situ Grab sample with conductivity and ph in situ Point 19 MW2 North of pit void Conductivity and ph in situ Point 20 Pit void Pit void Conductivity and ph in situ Point 36 SD6 Nagero Dam Conductivity and ph in situ Point 38 SD3 South west corner of spoil dump Point 39 SD4 Rail loop 15 km west of mine site Conductivity and ph in situ Conductivity and ph in situ Point 41 MW3 South of MIA Conductivity and ph in situ Point 42 SD23 Topsoil stockpile Conductivity and ph in situ TBA SD7 Sediment dam located in eastern spoil dump TBA SD27 Sediment dam located near unshaped spoil dump in southwest TBA SD10 Contaminated water dam located in CHPP TBA SD11 Contaminated water dam located at rail loop TBA SD12 Contaminated water dam located in CHPP Conductivity and ph in situ Conductivity and ph in situ Conductivity and ph in situ Conductivity and ph in situ Conductivity and ph in situ TBA 1 SD8 Sediment dam located in MIA Conductivity and ph in situ Surface water quality of water stored in SD8 is proposed for operational purposes only, as SD8 discharges to a downstream dam. Monitoring would not be required by EPL
147 Appendix G Proforma sheets for sampling and geomorphology surveys
148 Date Point # Monitoring purpose Ambient / Event / Frequency / trip blank (please delete as appropriate) Sampling staff names Parameter Units Total Triplicate readings Average Reading 1 Reading 2 Reading 3 Water Level m Cross-sectional area (m 2 ) Flow velocity (m/s) Flow volume (calculated) m 3 s -1 EC ms/cm Nitrate mg N/l Nitrogen (total) mg N/l Oil and grease mg/l ph ph units Phosphorus (reactive) mg P/l Phosphorus (total) mg P/l Temperature C Total suspended solids mg /l Sample time GPS DATUM Easting Northing Site obs Photo #'s Readings 1, 2 & 3 to be spaced equidistantly across the wetted perimeter of the channel cross-section
149 Geomorphology template Project Date Surveyo r Reach code: Time Drainage channel Creek River Estuary Pond Wetland Lake Weather conditions U-S Grid ref D-S grid ref Upstream elevation (m) Downstream elevation (m) Slope Watercourse attributes Dimensions Width (m) Max. depth (m) Velocity (ms -1 ) Shape description Roughness Height (m) Bank erosion Instream vegetation (% cover [emergent, floating, submerged, algae, moss]) Smooth surface flow [H1] Sinuosity (straight, low, intermediate, high) Broken standing waves [H2] Unbroken standing waves [H3] Bank vegetation (% cover) Chute [H4] Rippled [H5] Bench vegetation (% cover) Flow type Scarcely perceptible flow [H6] Upwelling [H7] Free fall [H8] Organic matter Logs Twigs / Leaves Detritus Standing water Channel Planform Form Single Forked Braided Open Sand bars Gravel bars Rock outcrops Riparian strip Floodplain connectivity Floodplain land use Bank structure (concave, convex, straight, undercut) & slope % composition Boulder Cobble Bed character Gravel Sand Fine sand Silt / clay [H9] Bed stability (packed & armoured, packed not armoured, mod compaction, low compaction, no packing) U-S D-S U-S D-S U-S D-S U-S D-S U-S D-S Supply Deposition Erosion Conveying U-S D-S
150 Geomorphology template (continued) Site setting diagram & cross-section profiles (upstream and downstream)
151 Appendix H Water quality and quantity data collection

152 Water quality and quantity data collection Concentrations of chemical parameters in creeks are highly dependent on prevailing flow conditions. Delivery of additional chemical load to watercourses via overland flow pathways and dilution of chemical load in high flows are two important processes that might affect chemical concentrations at the time of sampling. As such, ambient water quality samples (as described in Section 6.2) should capture a range of flow conditions and a biannual review of sample representatives should be undertaken to evaluate this. There are no flow gauging stations close to the Boggabri Coal Mine site which could be used for this purpose. Therefore the following alternative four point procedure is proposed: 1. Install stage boards with automatic water level loggers at the two ambient sample locations (SW1 and SW2). Install a barometric logger in a dry location at a similar altitude to the water level loggers to correct for variations in ambient air pressure. Stable cross-sections should be selected with straight channels, good access and which are permanently inundated (or failing that upstream from a flow control point). A typical deployment is shown below. 2. Read stage height at the two sample locations on a weekly basis (minimum frequency advised but more often would be advantageous) and download data from loggers during ambient water quality sample collection.
153 3. Maintain an electronic record of readings (date, time, stage height, observations). 4. Water level readings should be categorised as low, medium, high and very high according to their percentile occurrence (e.g. 10, 50, 75 and 95 percentiles, respectively) in order to compare to water levels during sample collection events. The number of samples classified in each type of flow event can then be evaluated which can be used as a guide for the sampler about the timing of future sampling events. An equal distribution of sample events over the different flow conditions is desirable. These water level data should be converted to flow volumes using site measurements recorded in Appendix G. This would involve detailed surveys of the creek cross-sections.
154 Appendix I Flooding response and communication protocol
155 BOM issues Flood Warning for Namoi River Check upstream flow gauges, rainfall stations, weather forecasts If flow/water level at upstream gauges are low then not significant event If high flow/water level and further heavy rainfall is forecast then is a significant event Continue to monitor SES and BOM flood warnings and check daily flow readings at upstream gauges: Namoi@Boggabri Namoi@Gunnedah Nearest rainfall station: Boggabri Post Office Environment Superintendent must contact: Downstream landowners EPA Environment Superintendent to follow response plan and follow further instruction from EPA, SES, BOM
156 Appendix J Simple spill response

157