Lead and Copper Rule and Treatment Overview
|
|
|
- Domenic Kelly
- 5 years ago
- Views:
Transcription
1 Lead and Copper Rule and Treatment Overview for the Wisconsin Wastewater Operator s Association 2018 Annual Conference Cathrine Wunderlich, Chief Public Water Engineering Section October 16, 2018
2 Lead and Copper Overview - Sources of lead and contribution to DW - LCR monitoring - Assessing efficacy of treatment - Treatment options - Conclusions

3 Sources of Lead and Contribution to DW
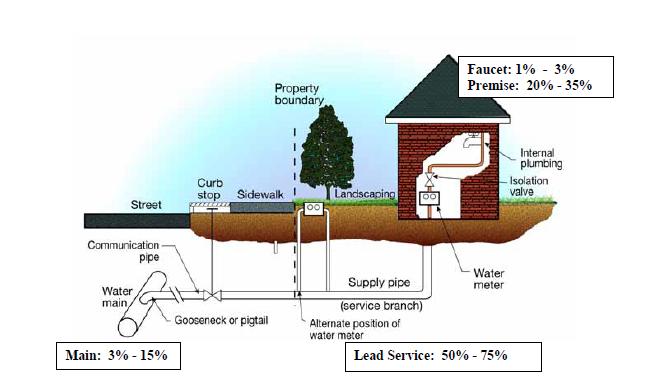
4 Sources of Lead and Contribution to DW PUBLIC PRIVATE
5 Sources of Lead and Contribution to DW - Lead plumbing - Copper plumbing with lead solder - Galvanized plumbing - Brass fixtures PUBLIC PRIVATE
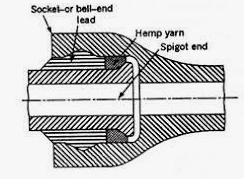
6 Sources of Lead- Galvanized Pipe 1. Lead bears a strong adsorptive affinity for both ferric and ferrous iron compounds, and scale formation by co-precipitation and deposition of lead-iron precipitates can potentially result in accumulation over decades of a crystalline iron corrosion scale rich in lead. 2. Lead adsorbs to galvanized iron corrosion scale; lead can persist and be mobilized to consumer taps after full replacement of lead service lines, potentially for the remaining service life of the galvanized plumbing. 3. More particulate lead was released per unit surface area of galvanized plumbing than was released from lead service lines. 4. Lead content can vary substantially in galvanized iron pipe corrosion scales depending on the history of the premise piping. A range from a few hundredths of a percent to as high as eight percent lead by weight was observed in galvanized plumbing from different homes where lead service lines have been in place.
7 Sources of Lead- Galvanized Pipe, cont d 5. Lead can reside in the deepest layers of galvanized iron corrosion scales indicating the potential for continued lead release for the remaining service life of the pipes. 6. Non-iron lead minerals such as apatites, carbonates and oxides of lead can exist in isolated deposits embedded in iron corrosion scales, indicating the potential for multiple adsorptive mechanisms including physical capture that will influence scale characteristics and lead release. 7. Lead release from galvanized plumbing will likely be exacerbated substantially by physical disturbance, especially immediately following a service line replacement. 8. Lead release from galvanized plumbing can be exacerbated by hydraulic disturbances such as water hammer or increased flow velocity. 9. Lead release from galvanized plumbing that appears to have subsided to some stable level over time following physical disturbance may increase again due to subsequent disturbances.
8 LCR Monitoring- Frequency NR Monitoring requirements for lead and copper in tap water. (4) TIMING OF MONITORING (d) Reduced monitoring A water supplier shall also conduct water quality parameter monitoring in accordance with s. NR (2), (3) or (4) during the monitoring period in which the action level was exceeded.
9 LCR Monitoring- Frequency NR Monitoring requirements for lead and copper in tap water. (4) TIMING OF MONITORING (d) Reduced monitoring A water supplier shall also conduct water quality parameter monitoring in accordance with s. NR (2), (3) or (4) during the monitoring period in which the action level was exceeded.
10 LCR Monitoring- Frequency NR Monitoring requirements for lead and copper in tap water. (4) TIMING OF MONITORING (d) Reduced monitoring A water supplier shall also conduct water quality parameter monitoring in accordance with s. NR (2), (3) or (4) during the monitoring period in which the action level was exceeded.

11 LCR Monitoring- Site Selection

12 Sampling Hierarchy
13 Assessing Efficacy of Treatment First draw 1 L sampling inadequate in assessing true lead exposure Improper site selection for LCR sampling Tier 2 and Tier 3 sites chosen over Tier 1 sites Inadequate records of LSL infrastructure The red dashed box approximates what is captured by one 1-liter sample Kitchen tap Lead Service Line X Water Main

14 Assessing Efficacy of Treatment First draw 1 L sampling inadequate in assessing true lead exposure Improper site selection for LCR sampling Tier 2 and Tier 3 sites chosen over Tier 1 sites Inadequate records of LSL infrastructure 159 ft LSL Distance Between Water Main and Homes Varies Significantly
15 Assessing Efficacy of Treatment HOUSE 1 Pb levels - 11th liter 50 ug/l Ph Adjustment (Orthophosphate Addition In March) Pb levels - 1st Liter 12 ug/l
16 Assessing Efficacy of Treatment HOUSE 2 (Orthophosphate Addition In March) Pb levels - 9th liter 32 ug/l Lead levels 1.5 yrs after ortho start
17 Assessing Efficacy of Treatment HOUSE 3 ph Adjust Started Jan 2016 Lead Levels Two years after Start of Orthophosphate Orthophosphate Started March 2016


18 Assessing Efficacy of Treatment We Know Lead and copper in drinking water can be 4-8 times higher than what first-draw sample values demonstrate.

19 Assessing Efficacy of Treatment MARCH 2016

 conditions can")


20 Assessing Efficacy of Treatment Many different water quality (WQ) conditions can impact Pb and Cu release and need to be considered CHLORIDE SULFATE MASS RATIO DISSOLVED INORGANIC CARBON
21 Chapter 2 Assessing Efficacy of Treatment ph Alkalinity Dissolved inorganic carbon (DIC) Temperature Hardness, calcium and magnesium Conductivity Ammonia, chloride, and sulfate Iron, aluminum, and manganese Corrosion Control Inhibitors Chlorine, chloramines Oxidation reduction potential (ORP) Buffer intensity Dissolved oxygen Natural organic matter Others (fluoride, sequestration) Alkalinity, ph, DIC, corrosion inhibitors, and ORP (in certain types of waters) remain critical parameters that directly impact lead release.
22 Treatment Options CCT SCIENCE Was CCT selected to reduce lead and/or copper levels? Is CCT dosed at a rate that will effectively reduce lead and/or copper levels to the greatest extent practical? Was CCT selected to work in combination with another treatment goal (i.e. sequestration)? Are the technologies competing with each other? With other water quality factors? If using blended phosphates, is the addition of excess polyphosphate sequestering lead and copper? EPA OCCT Guidance March 2016
23 Treatment Options ORTHOPHOSPHATE Systems should target distribution system orthophosphate residuals of 1-3 mg/l or as high as 3-6 mg/l where systems have LSLs Lead levels may continue to decline for years after optimal ortho doses have been applied due to slow rate of scale formation (passivation dose vs. maintenance dose) Blended phosphates can add excess polyphosphate to systems and sequester lead and copper EPA OCCT Guidance March 2016
24 2017 EMOR Data - DS Orthophosphate Residuals Status DS Ortho (mg/l) # Systems Totals Percent Total Not Likely Optimized Maybe Optimized Likely Optimized Total Systems *For systems with LSLs
25 THEORETICAL FORMATION OF PB(II) ORTHOPHOSPHATE SOLIDS Treatment Options Schock, M.R. & Lytle, D.A., 2011 (Sixth ed.). Internal Corrosion and Deposition Control. Ch. 20 in: Water Quality and Treatment: A Handbook of Community Water Supplies, J.K. Edzwald ed. McGraw-Hill, Inc., New York.
26 Treatment Options High doses in excess of 20 mg/l may be required to control lead release Start-up dose of 24 mg/l is recommended; eventual maintenance does of 8-12 mg/l (maybe???) Silicates can raise ph SILICATES Silicates can also sequester where Fe and Mn are <1 mg/l Chloride, calcium, and Mn can affect optimum dose Lack of research an field information proving its effectiveness EPA OCCT Guidance March 2016
27 Status 2017 EMOR DATA EP SILICA Residuals EP Silicate (mg/l) No of Systems Totals Percent Total Not Likely Optimized Maybe Optimized Likely Optimized > Total *For systems with LSLs
28 Treatment Options ph Adjustment Target ph should be 8.8 to 10. Systems with lead service lines that are not using a corrosion inhibitor should consider increasing the ph to 9.0 or greater. Lower ph values, particularly between 8.2 and 8.5, can result in poor buffer intensity of the water (regardless of DIC levels) and wide swings in distribution system ph EPA OCCT Guidance March 2016
29 2017 EMOR Data - DS ph Values Status ph (SU) # Systems Totals < Percent Total Not Likely Optimized Likely Optimized > Total Systems *For systems with LSLs
30 Conclusions 1) Passing Lead and copper sampling is not an indication that lead and copper exposures have been minimized or that CCT is optimized. 2) First draw samples peak lead levels. Peak lead levels can be up to 4-8 times higher. 3) Corrosion Control Treatment targets tailored to 90 th percentile values are not necessarily optimized. 4) Treatments must be tailored to the source of lead and/or copper present in a given community (i.e. LSLs vs. fixtures)


31